Project 1 - Parsing NASA thermodynamic data
OBJECTIVE:
Write a function that extracts the 14 coefficients and calculates the enthalpy, entropy and specific heats for all the species in the data file.
PRE-REQUISITES:
i) The process of "parsing" can be described as reading in a data stream of some sort and building an in-memory model or representation of the semantic content of that data, in order to facilitate performing some kind of transformation on the data.
ii) The governing equations are:

PROCEDURE:
a) Main Code:
%FOR MAIN PROGRAM
% NASA Thermodynamic Data file parsing
clear
close all
clc

% Loading the data from the file
f1 = fopen('THERMO.dat','r');
fgetl(f1);
tline = fgetl(f1);
A = strsplit(tline,' ');
Global_low_temp = str2double(A(2)); % global low temperature
Global_mid_temp = str2double(A(3)); % global mid temperature
Global_high_temp = str2double(A(4));% global high temperature

% Leaving the comment lines
for i = 3:5
    l = fgetl(f1);
end

% Getting temperature and coefficient for each species
for j = 1:53

    species = fgetl(f1);
    t = strfind(species,'.')

    % local low temperature for each species
    species(52-3:52+3);
    Tl = species(52-3:t(1)+3);
    Tl1 = str2double(Tl);

    % local high temperature for each species
    species(t(1)+6:62+3);
    Th = species(t(1)+6:t(2)+3);
    Th1 = str2double(Th);

    % local mid temperature for each species
    species(t(2)+6:72+3);
    Tm = species(t(2)+6:t(3)+3);
    Tm1 = str2double(Tm);

    species_name = species(1:6); % name of the species

    %  first line coefficients for each species
        coeff_line1 = fgetl(f1)              ; a_1 = strfind(coeff_line1,'E');
        a1 = coeff_line1(1:a_1(1)+3)         ; c1 = str2double(a1);
        a2 = coeff_line1(a_1(1)+4:a_1(2)+3)  ; c2 = str2double(a2);
        a3 = coeff_line1(a_1(2)+4:a_1(3)+3)  ; c3 = str2double(a3);
        a4 = coeff_line1(a_1(3)+4:a_1(4)+3)  ; c4 = str2double(a4);
        a5 = coeff_line1(a_1(4)+4:a_1(5)+3)  ; c5 = str2double(a5);

        %  second line coefficients for each species
        coeff_line2 = fgetl(f1)              ; a_2 = strfind(coeff_line2,'E');
        a6 = coeff_line2(1:a_2(1)+3)         ; c6 = str2double(a6);
        a7 = coeff_line2(a_2(1)+4:a_2(2)+3)  ; c7 = str2double(a7);
        a8 = coeff_line2(a_2(2)+4:a_2(3)+3)  ; c8 = str2double(a8);
        a9 = coeff_line2(a_2(3)+4:a_2(4)+3)  ; c9 = str2double(a9);
        a10 = coeff_line2(a_2(4)+4:a_2(5)+3) ; c10 = str2double(a10);

        %  third line coefficients for each species
        coeff_line3 = fgetl(f1)              ; a_3 = strfind(coeff_line3,'E');
        a11 = coeff_line1(1:a_3(1)+3)         ; c11 = str2double(a11);
        a12 = coeff_line1(a_3(1)+4:a_3(2)+3)  ; c12 = str2double(a12);
        a13 = coeff_line1(a_3(2)+4:a_3(3)+3)  ; c13 = str2double(a13);
        a14 = coeff_line1(a_3(3)+4:a_3(4)+3)  ; c14 = str2double(a14);

        % calculation of specific heat, enthalpy, and entropy
        T = linspace(Tl1,Th1,100);
        [cp,h,s] = thermodynamic_property_function(c1,c2,c3,c4,c5,c6,c7,c8,c9,c10,c11,c12,c13,c14,T,Tm1);

        % plotting and then saving in a directory
        folder = pwd;
        mkdir(species_name)
        cd(species_name)

        % plot for specific heat vs temperature
        figure(1)
        title('species_name')
        plot(T,cp,'color','b','linewidth',2)
        xlabel('Temperature [K]')
        ylabel('Specific Heat [J/K]')
        title(species_name)

        % plot for enthalpy vs temperature
        figure(2)
        plot(T,h,'color','r','linewidth',2)
        xlabel('Temperature [K]')
        ylabel('Enthalpy [J/kg]')
        title(species_name)

        % plot for entropy vs temperature
        figure(3)
        plot(T,s,'color','k','linewidth',2)
        xlabel('Temperature [K]')
        ylabel('Entropy [J/K]')
        title(species_name)

        saveas(figure(1),'T vs Cp.png')
        saveas(figure(2),'T vs H.png')
        saveas(figure(3),'T vs S.png')

        cd(folder)

        % calculating the molecular weight
        [Mol_wght] = molecular_weight_function(species_name);
        M = ['Molecular weight of ', species_name,' = ',num2str(Mol_wght)];
        disp(M)

end
b) Steps involved:
i) Open the .dat file using fopen command and we are reading the file so we mention r for reading and save the whole data in a variable f1.
ii) Then use fgetl command for reading a single line of the file at a time, it does not print it as it is suppressed by using the semicolon.
iii) Every lines data is stored in a variable tline and its value gets updated as the next line is read.
iv) Now using the strsplit command the data is split by specifying the delimiter, here it is a space and is stored in a variable A.
v) Now the numerical value of low, mid, and high temperature is stored in variables by using str2double command which converts the text data into a double-precision value, through this a string can be converted into a numerical value.
vi) For leaving the header lines, getting the local temperature and then coefficients a for loop is used.
vii) To find the local temperature the strfind command is used with a delimiter “.” and then some places are added or subtracted from that to get the whole lower, mid, and high local temperature.
viii) The string is then converted into a double-precision value using str2double, and the numeric values are stored in variables “Tl1”, Th1”, and “Tm1”.
ix) Now for the name of the species first six places are read and then stored in a variable “species_name”.
xi) Now for getting the value of coefficients for each species firstly “fgetl” is used for reading the first coefficient line and storing the data
xii) Then with the help of strfind command is used for locating E and then places are added to get the whole value and is stored in a1.
xiii) It is then converted into a double-precision value using the “str2double” command and the numeric value is stored.
xiv) The same process is used to store numeric values stored in c1, c2,....,c14.
xv) Now temperature range is divided in hundred equal intervals using the linspace command.
xvi) To calculate the specific heat “cp”, enthalpy “h”, and entropy “s”, a function “td_properties” is called which is programmed separately.
xvii) Now for plotting and then saving the plots first we provide the location of the folder for saving the plots.
xviii) In that main folder, using “mkdir” a new folder is created by the name of species and its name is changed to the species name using “cd” command.
xix) Now plott a graph between specific heat and temperature data, between enthalpy and temperature and entropy and temperature.
xx) To save the plots, saveas command is used here we have to provide it with the name of the file and its extension.
xxi) To calculate the molecular weight for each species a function “molecular_weight” is called.
xxii) For displaying the data to the command window disp command is used and for that the numeric value is converted into a string using num2str command.
c) Molecular weight function:
%FOR MOLECULAR WEIGHT FUNCTION PROGRAM
% molecular weight function program

function [m_weight] = molecular_weight_function(species_name)
atomic_weight = [1.009, 12.011, 14.006, 15.999, 32.065, 39.948];
element = ['H','C','N','O','S','A'];
m = 0;

for f = 1:length(species_name)
    for g = 1: length(element)
        if strcmp(species_name(f),element(g))
            m = m + atomic_weight(g);
            c = g;
        end
    end

    num = str2double(species_name(f));
    if num > 1
        m = m + (atomic_weight(c)*(num-1));
    end
end
m_weight = m;
end
d) Steps involved:
i) Now atomic weight is assigned to a variable “atomic_weight”.
ii) all the elements used are defined to a variable “element”.
iii) For loop is used for the molecule which has a length of six, another for loop is used having the length of “element”.
iv) Now using the strcmp command the “species_name” and “elements” string and by doing this all the common data in both the string are stored and by using those species molecular weight is calculated.
v) Now if the molecule contains numeric in it then molecular weight is calculated by “m + (atomic_weight(c) * (num-1)) and the value is stored in a variable “m
e) Thermodynamic property function:
%FOR THERMODYNAMIC PROPERTIES FUNCTION PROGRAM
% thermodynamic properties calculation function program

function [cp,h,s] = thermodynamic_property_function(c1,c2,c3,c4,c5,c6,c7,c8,c9,c10,c11,c12,c13,c14,T,Tm1)
          R = 8.314;

          for i = 1:length(T)

          if T (i)>= Tm1
              cp = (c1 + c2.*T + c3.*(T).^2 + c4.*(T).^3 + c5.*(T).^4).*R;
              h = (c1 + (c2.*T)./2 + (c3.*(T).^2)./3 + (c4.*(T).^3)./4 + (c5.*(T).^4)./5 + c6./T).*R.*T;
              s = (c1.*log(T) + c2.*T + (c3.*(T).^2)./2 + (c4.*(T).^3)./3 + (c5.*(T).^4)./4 + c7).*R;

          else
              cp = (c8 + c9.*T + c10.*(T).^2 + c11.*(T).^3 + c12.*(T).^4).*R;
              h = (c8 + (c9.*T)./2 + (c10.*(T).^2)./3 + (c11.*(T).^3)/.4 + (c12.*(T).^4)./5 + c13./T).*R.*T;
              s = (c8.*log(T) + c9.*T + (c10.*(T).^2)./2 + (c11.*(T).^3)./3 + (c12.*(T).^4)./4 + c14).*R;
          end
          end
end
f) Steps involved:
i) For the function program it is important that the name of the program should be same as the name of the function.
ii) “td_properties” function is defined for calculating the specific heat, enthalpy, and entropy for each species.
iii) Now for loop is used for running the code for every temperature point.
iv) Now “Tm1” is given to if and else condition, where if the temperature “T” is greater than or equal to “Tm1” the program will calculate the “cp”, “h”, and “s” values using the coefficients “c1” to “c7” and if “T” is less than “Tm1”, the program will calculate the properties using the coefficients “c8” to “c14”.
RESULTS:
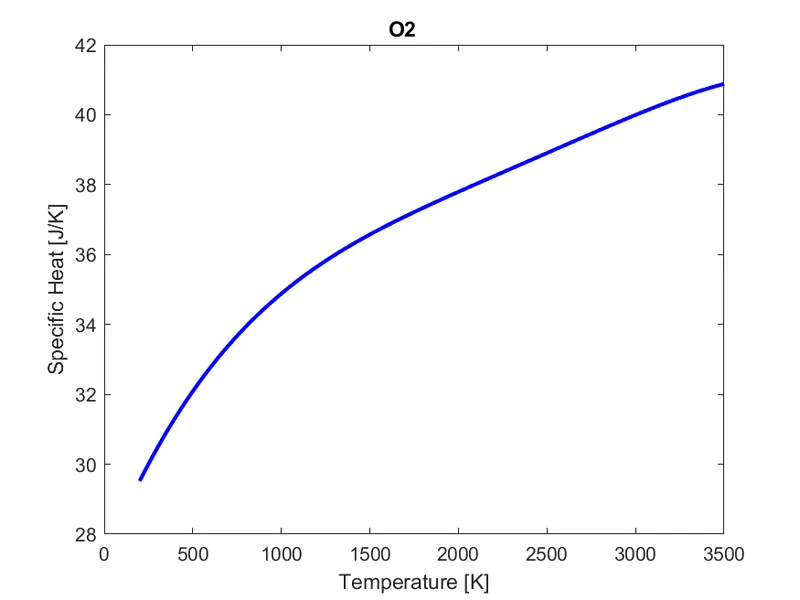
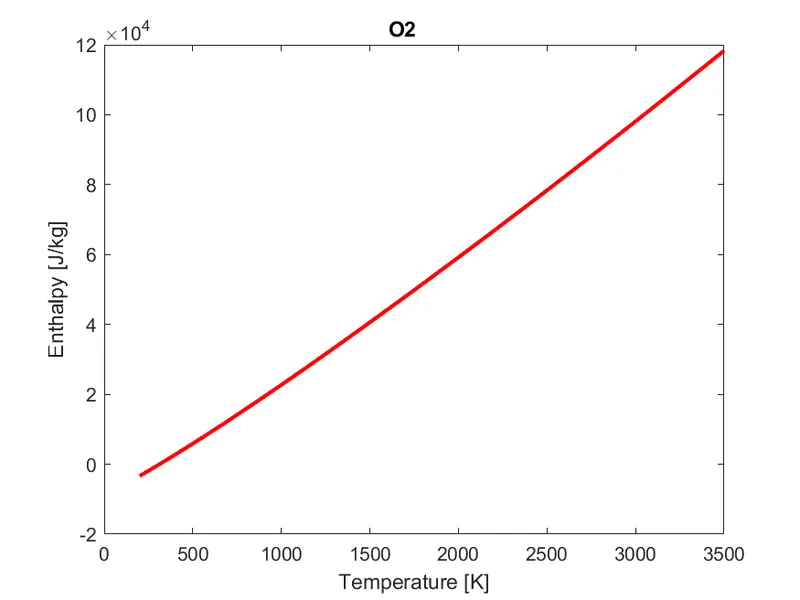
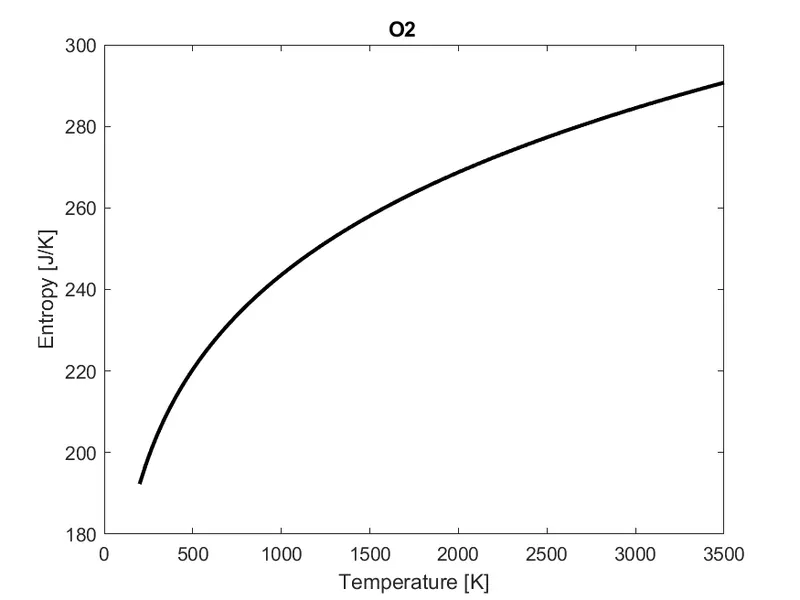
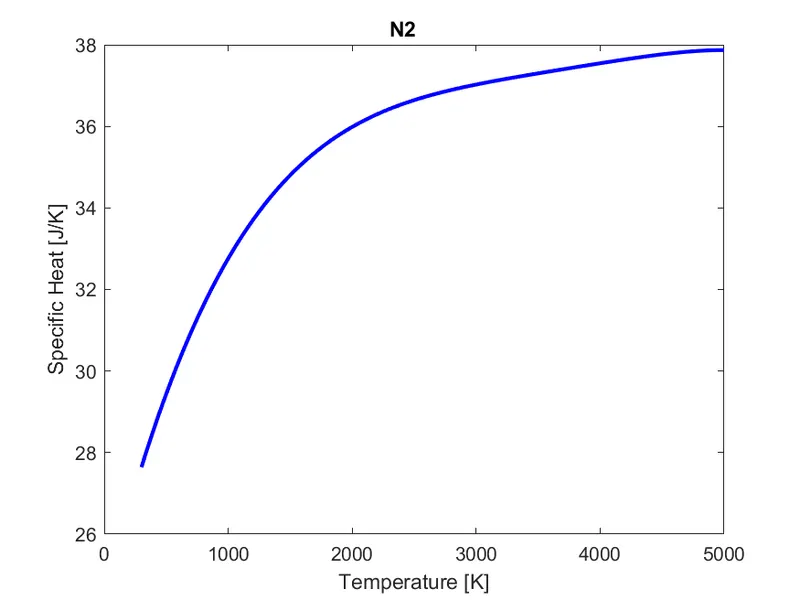
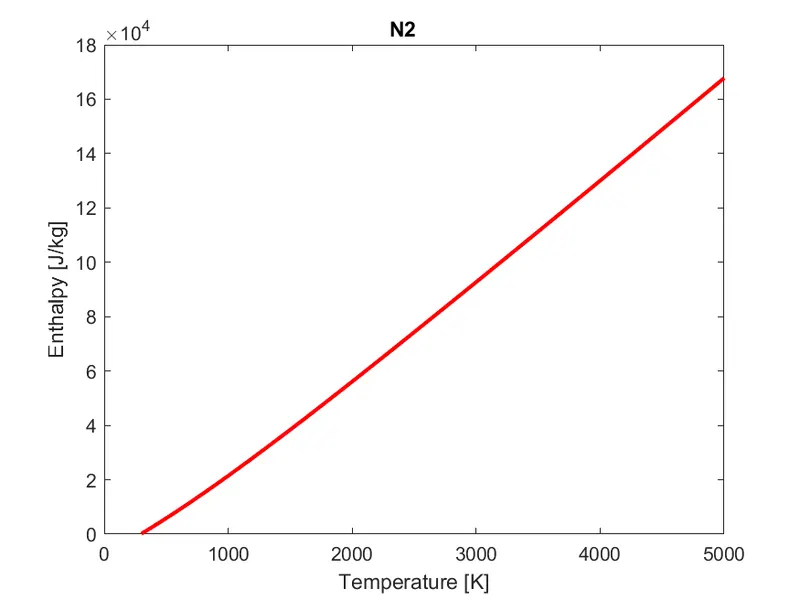
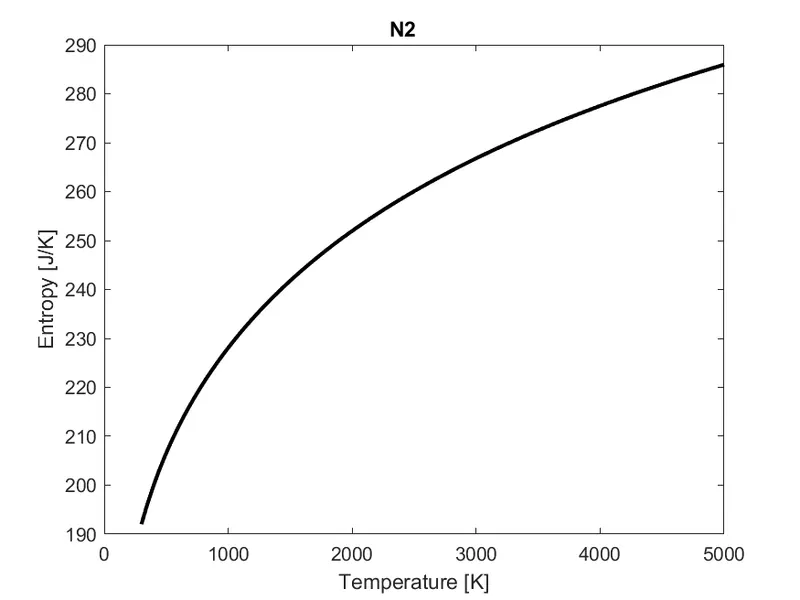
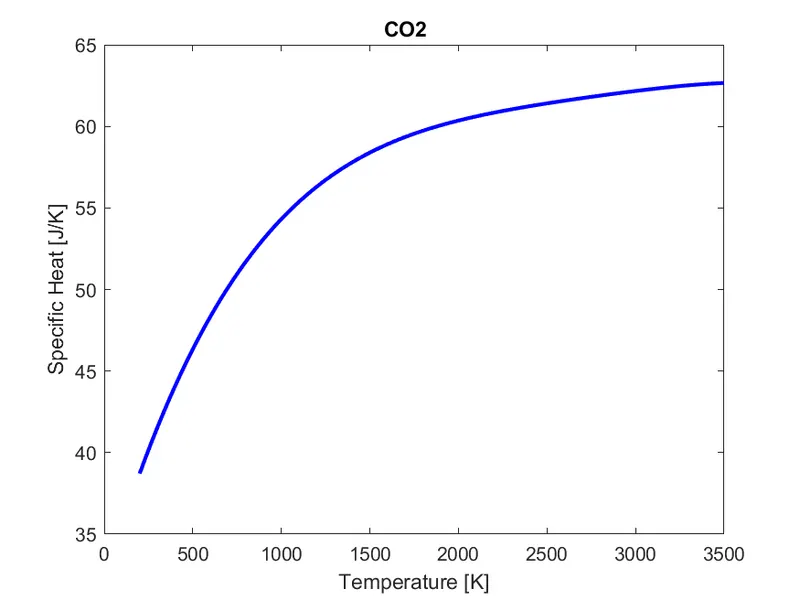
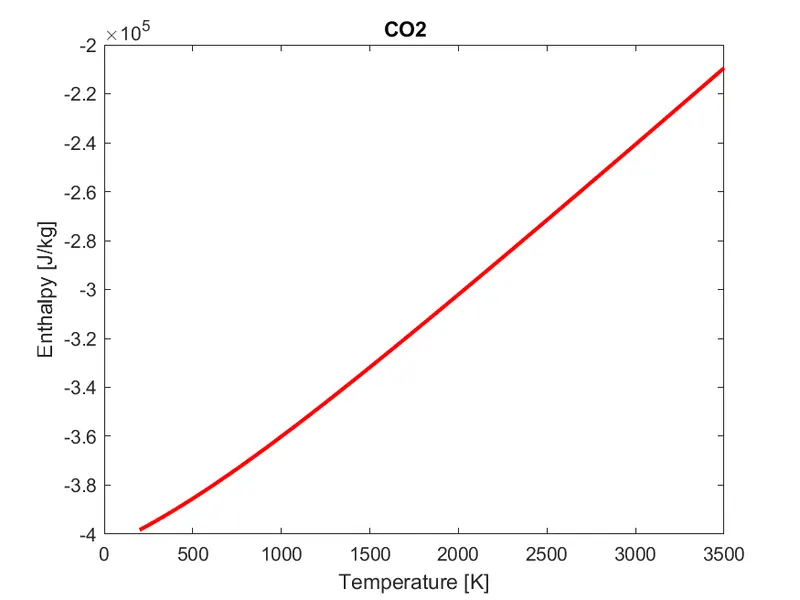
i) The following plots are obtained for:
a) 02:
b) N2:
c) C02:
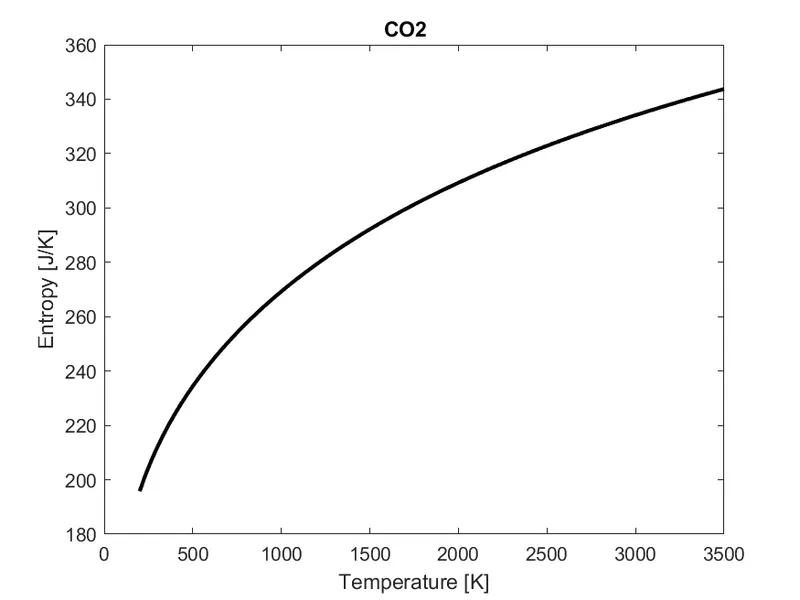
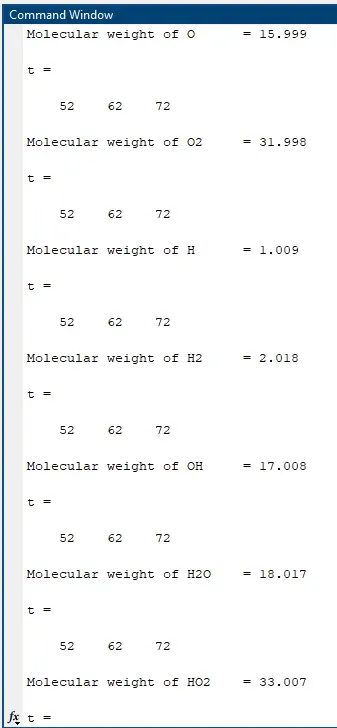
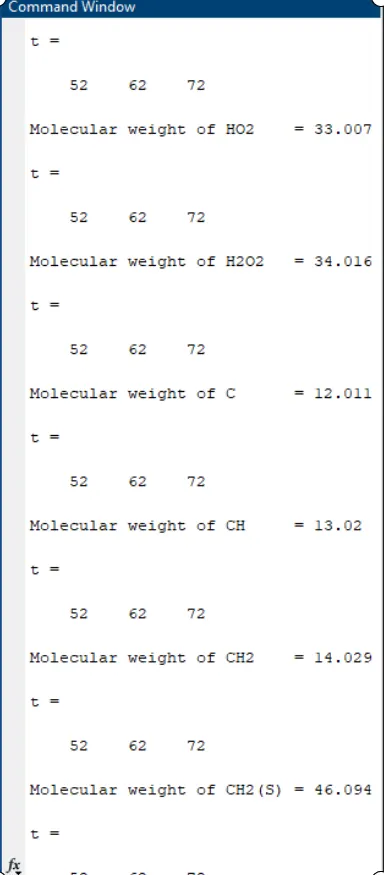
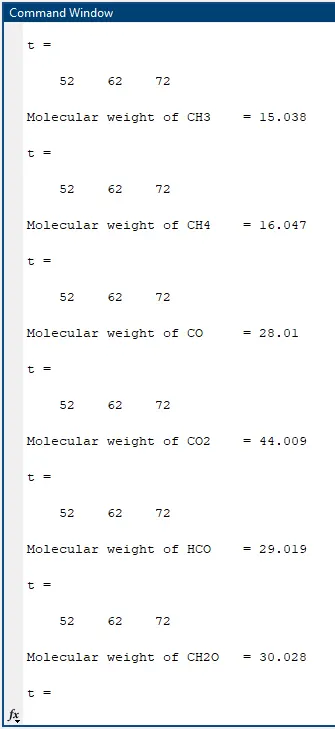
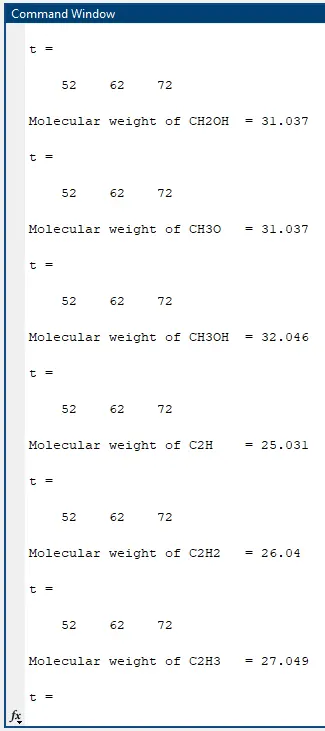
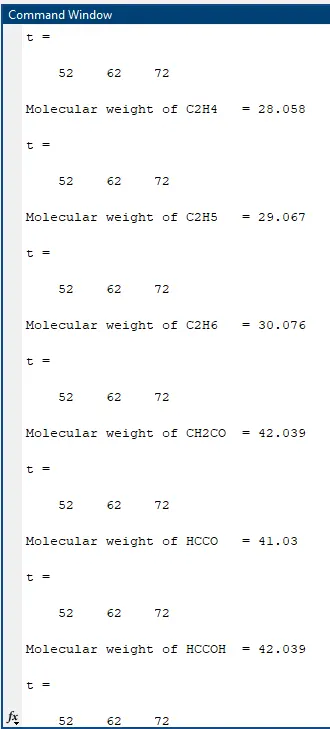
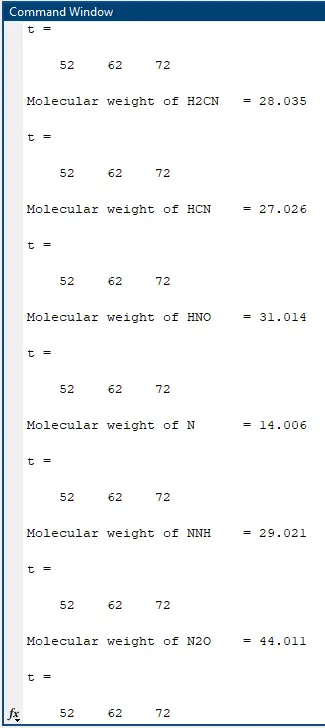
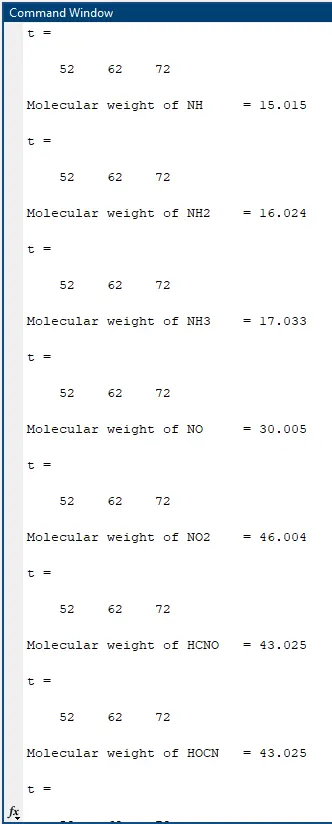
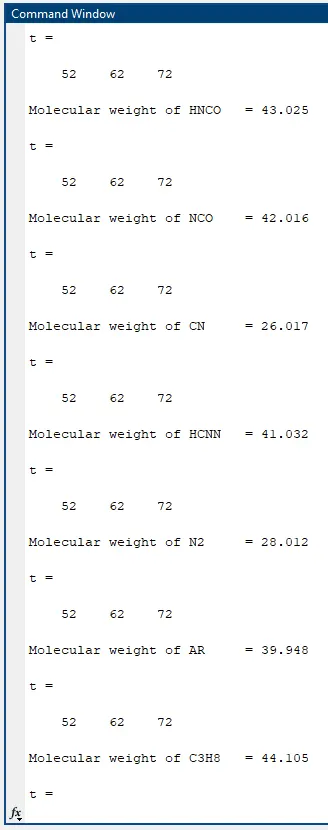
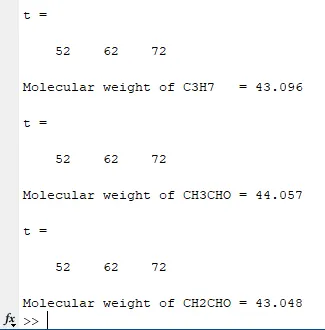
ii) The molecular weight of all the species are listed below:
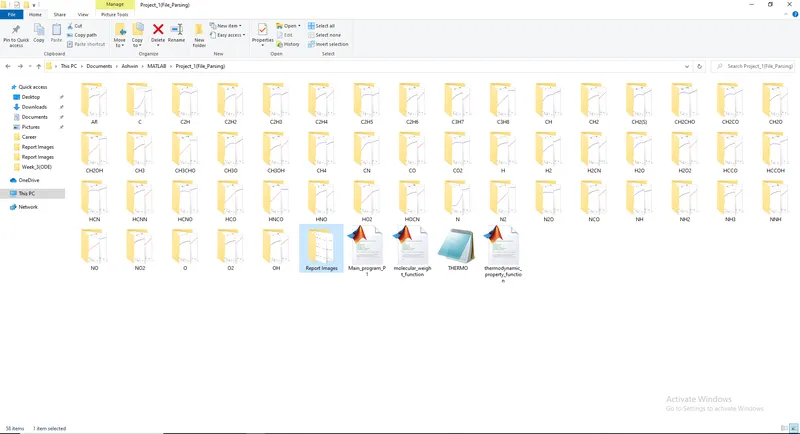
iii) The following image shows all the folders created:
CONCLUSION:
i) The program was successful in parsing all the NASA data.
ii) All the thermodynamic plots were saved and the molecular weight was calculated.