Project 1 - Parsing NASA thermodynamic data
AIM:
- Write a function that extracts the 14 coefficients and calculates the enthalpy, entropy and specific heats for all the species in the data file. And, also calculate the molecular weight of each species and display in the command window.
THEORY:
a:Parsing
Parsing a file means reading in a data stream of sort and building an in memory model of the semantic content of that data. This aims at facilitating performing some kind of transformation on the data.
b: Specific Heat
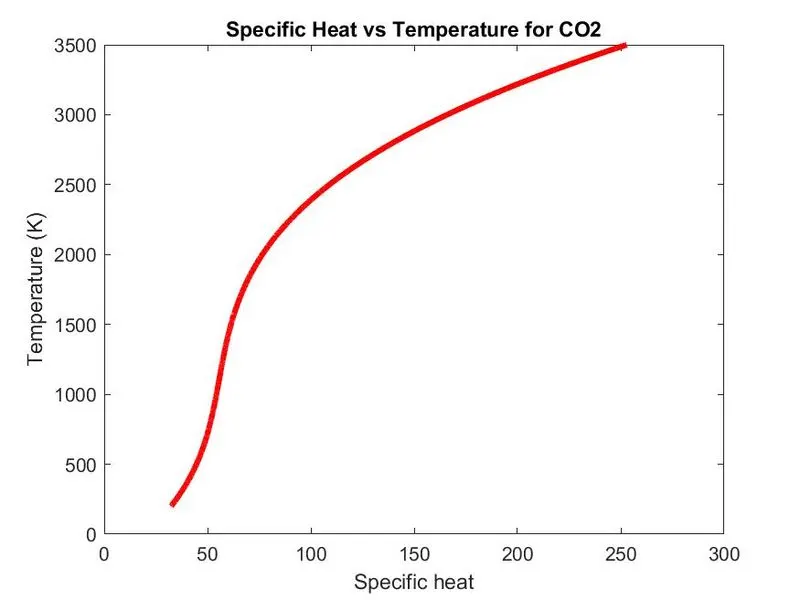
The specific heat is the amount of heat per unit mass required to raise the temperature by one degree Celsius. The relationship between heat and temperature change is usually expressed in the form shown below where Cp is the specific heat.

Where Cp = Specific Heat
R = Universal Gas Constant
c: Enthalpy
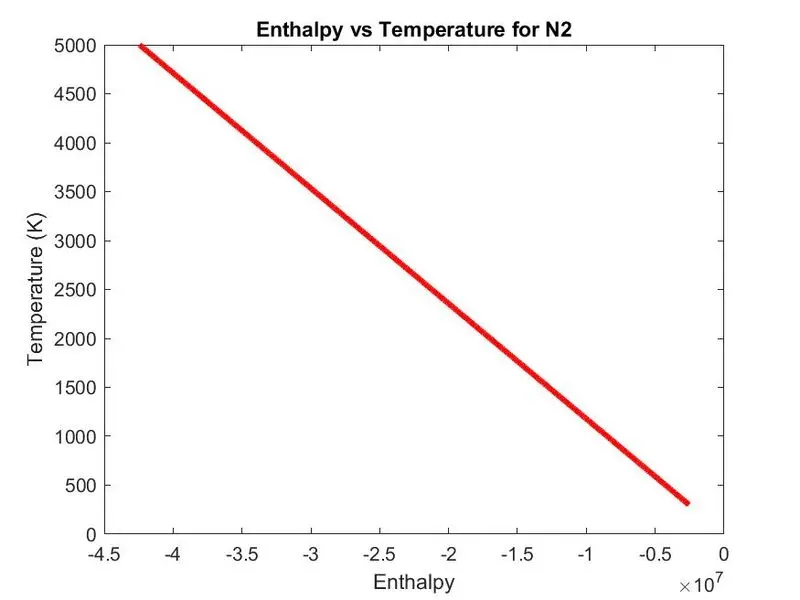
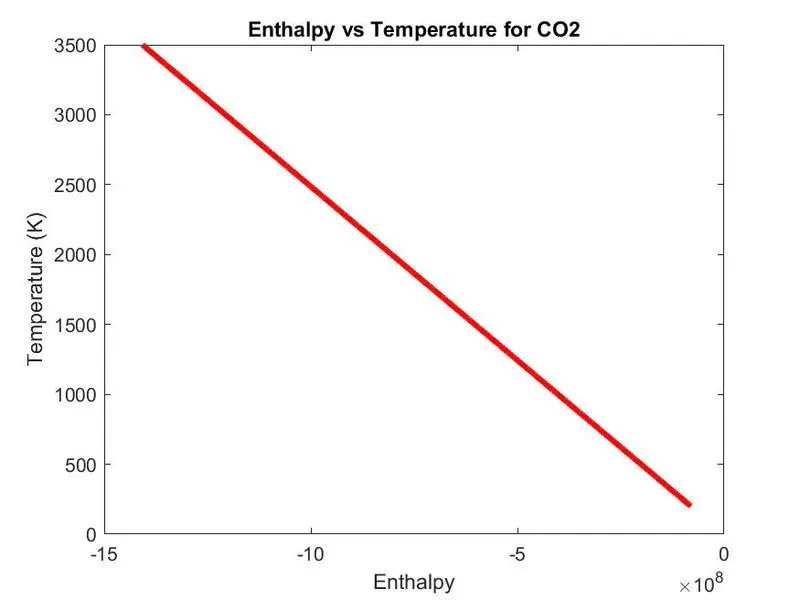
Enthalpy is a property of a thermodynamic system, defined as the sum of the system's internal energy and the product of its pressure and volume, H = U + pV. It is a convenient state function standardly used in many measurements in chemical, biological, and physical systems at a constant pressure.

d: Entropy
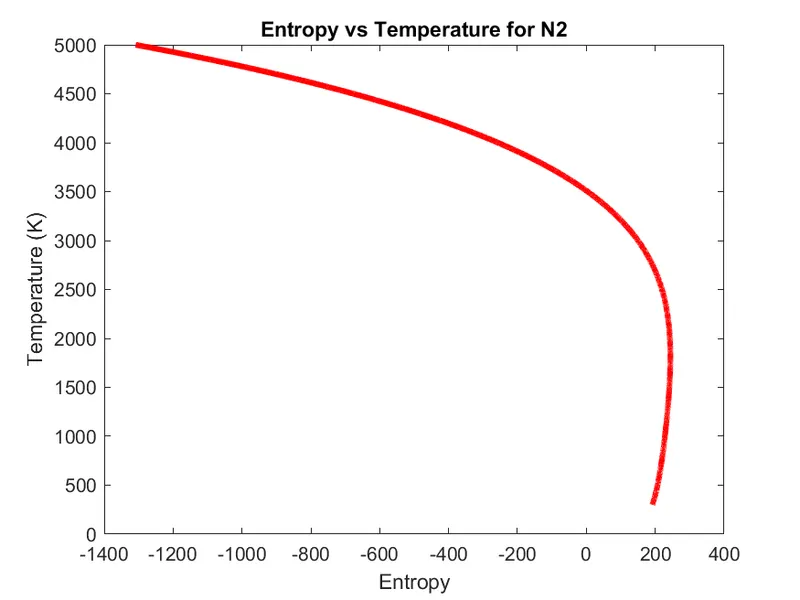
Entropy, the measure of a system's thermal energy per unit temperature that is unavailable for doing useful work. Because work is obtained from ordered molecular motion, the amount of entropy is also a measure of the molecular disorder, or randomness, of a system.

MAIN PROGRAMMING CODE:
clear all

close all

clc


f1 = fopen('THERMO.dat','r');

tline = fgetl(f1);


% Universal gas constant(J/K mol)

R = 8.314;


% Loop to run the first 4 lines of the data file

for i = 1:4

    fgetl(f1);

end


% Loop to obtain data and get the plots for each species

for i = 1:53


    % Obtaining the name of the species and converting to a string value

    % for our convenience

    tline1 = fgetl(f1);

    a = strsplit(tline1,' ');

    species = char(a(1));


    % Finding the local values of temperature for each species

    str1 = strfind(tline1, '.');

    local_low_temp = str2double(tline1(str1(1)-4:str1(1)+3));

    local_high_temp = str2double(tline1(str1(2)-4:str1(2)+3));

    local_mid_temp = str2double(tline1(str1(3)-4:str1(3)+3));


    % Obtaining the coefficients from the subsequent three lines

    tline2 = fgetl(f1);

    str = strfind(tline2, 'E');

    C1 = str2double(tline2(1:str(1)+3));

    C2 = str2double(tline2(str(1)+4:str(2)+3));

    C3 = str2double(tline2(str(2)+4:str(3)+3));

    C4 = str2double(tline2(str(3)+4:str(4)+3));

    C5 = str2double(tline2(str(4)+4:str(5)+3));


    tline3 = fgetl(f1);

    C6 = str2double(tline3(1:str(1)+3));

    C7 = str2double(tline3(str(1)+4:str(2)+3));

    C8 = str2double(tline3(str(2)+4:str(3)+3));

    C9 = str2double(tline3(str(3)+4:str(4)+3));

    C10 = str2double(tline3(str(4)+4:str(5)+3));


    tline4 = fgetl(f1);

    C11 = str2double(tline4(1:str(1)+3));

    C12 = str2double(tline4(str(1)+4:str(2)+3));

    C13= str2double(tline4(str(2)+4:str(3)+3));

    C14= str2double(tline4(str(3)+4:str(4)+3));


    % a1-a7 are low temperature coefficients, a8-a14 are high temperature

    % coefficients


    % Calculating molecular weight of each species

    M = molecular_mass(species);

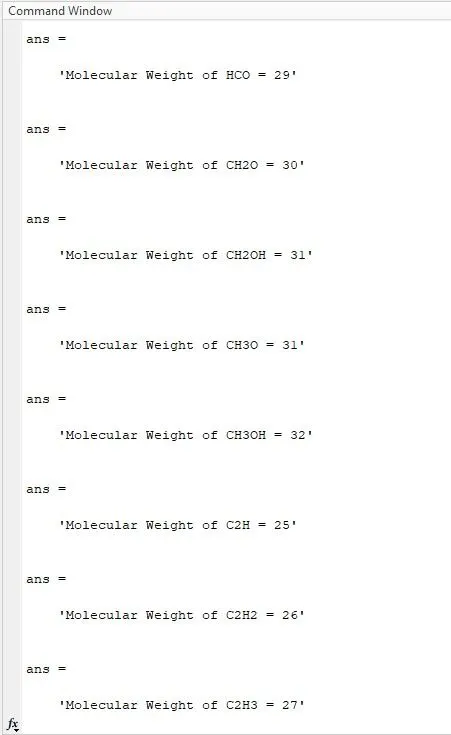
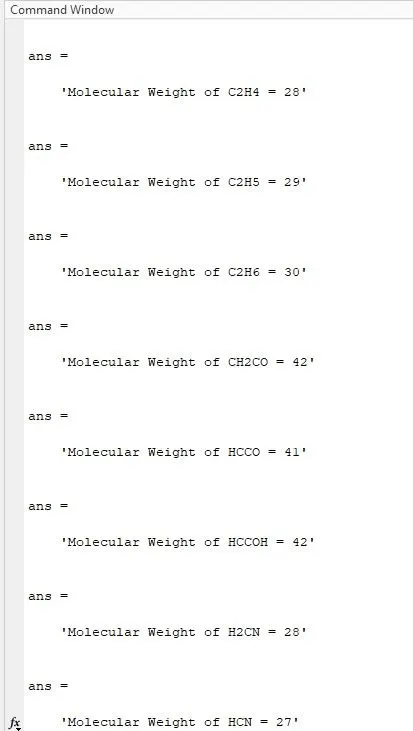
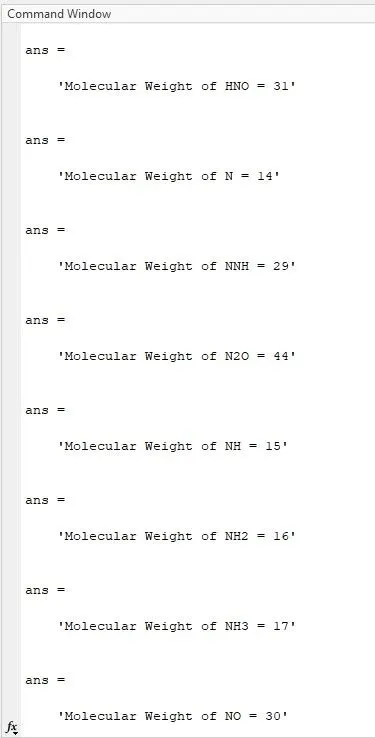
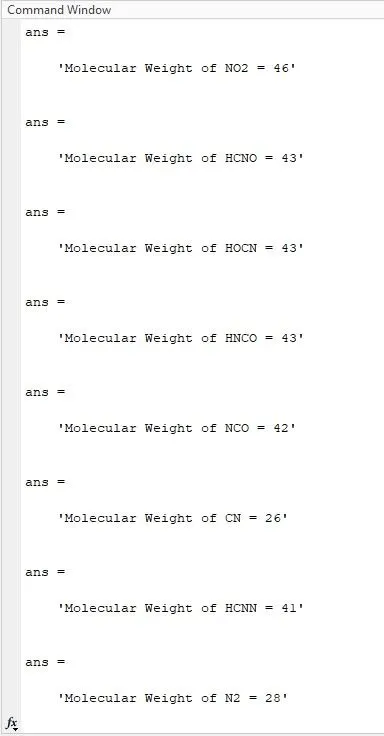
    sprintf('Molecular Weight of %s = %d',species,M)


    % Defining T

    T = local_low_temp : local_high_temp;


    % Obtaining the values for Cp, enthalpy and entropy using the

    % coefficients

    if (T>local_mid_temp)

        % Specific Heat

        Cp = R*(C1 + (C2*T) + (C3*(T.^2)) + (C4*(T.^3)) + (C5*(T.^4)));

        % Enthalpy

        H = R*(C1 + (C2*T/2) + (C3*(T.^2)/3) + (C4*(T.^3)/4) + (C5*(T.^4)/5) + (C6*(T)));

        % Entropy

        S = R*((C1*log(T)) + (C2*T) + (C3*(T.^2)/2) + (C4*(T.^3)/3) + (C5*(T.^4)/4) + C7);

    else


        % Specific Heat

        Cp = R*(C8 + (C9*T) + (C10*(T.^2)) + (C11*(T.^3)) + (C12*(T.^4)));

        % Enthalpy

        H = R*(C8 + (C9*T/2) + (C10*(T.^2)/3) + (C11*(T.^3)/4) + (C12*(T.^4)/5) + (C13*(T)));

        % Entropy

        S = R*((C8*log(T)) + (C9*T) + (C10*(T.^2)/2) + (C11*(T.^3)/3) + (C12*(T.^4)/4) + C14);

    end

    % Creating the folder for the species

        t = sprintf('%s', species);

        mkdir(t)


        % Going into the folder of the species to save the plots

        cd(t)


        % Plotting the curves

        % Specific Heat vs Temperature

        figure(1)

        plot(Cp,T,'linewidth',3,'color','r')

        xlabel('Specific heat')

        ylabel('Temperature (K)')

        Cp_text = sprintf('Specific Heat vs Temperature for %s', species);

        title(Cp_text);

        saveas(gcf, 'Cp.jpg');


        % temperature vs Enthalpy

        figure(2)

        plot(H,T,'linewidth',3,'color','r')

        xlabel('Enthalpy')

        ylabel('Temperature (K)')

        H_text = sprintf('Enthalpy vs Temperature for %s', species);

        title(H_text);

        saveas(gcf, 'H.jpg');


        % temperature vs Entropy

        figure(3)

        plot(S,T,'linewidth',3,'color','r')

        xlabel('Entropy')

        ylabel('Temperature (K)')

        S_text = sprintf('Entropy vs Temperature for %s', species);

        title(S_text);

        saveas(gcf, 'S.png');


        % Going back to the previous directory

        cd ..;

end
EXPLANATION:
- Used fopen command to open the ‘THERMO.dat’ file to read.
- Used fgetl to get header comments and global temperature data and stored in different variables.
- Strsplit to split the provided global temperature which was in the form of combined data.
- Str2double to convert string to numbers. To extract temperature and store in other variables.
- Using the loop for extract information of each species by repeating the extraction Algorithm.
- Strfind to find the separator between constants and combine exponential part.
- Mkdir was used to create a folder directory to store the result data.
- If-else is used to solve the low temp and high temp separately based on the value of temp. Also common commands such as plot(to plot graph) and cd (to change directory was used).
- Molecular_mass function is formed so as to calculate the molecular weight of the given elements.
MOLECULAR WEIGHT CODE:
function [M] = molecular_mass(species)


elements = ['H','C','N','O','R'];

atomic_weight = [1 12 14 16 40];

M=0;


for k = 1:length(species)

    for l = 1:length(elements)

        if strcmp(species(k),elements(l))

            M=M+atomic_weight(l);

            u=l;

        end

    end

    n=str2double(species(k));

    if n>1

        M=M+(atomic_weight(u))*(n-1);

    end

end
RESULT:
The plot of Element O2 (in order of Enthalpy, Entropy, Specific Heat)
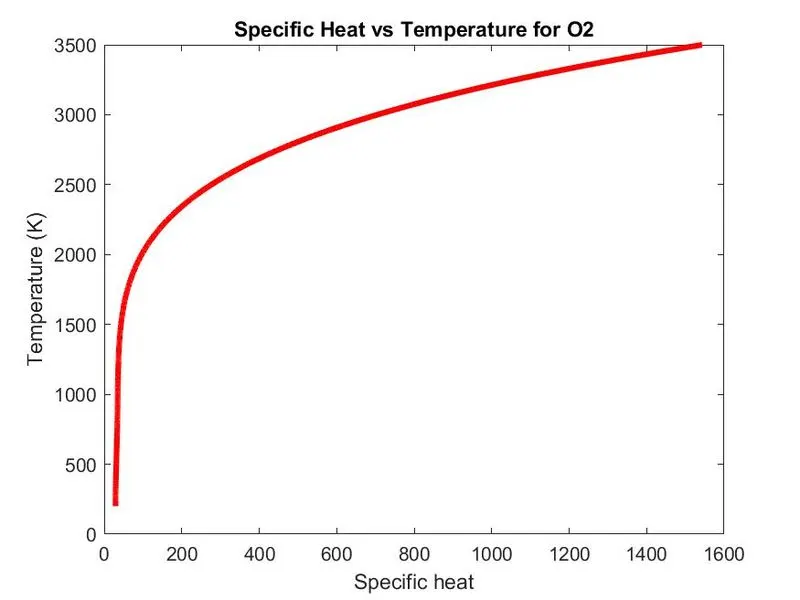
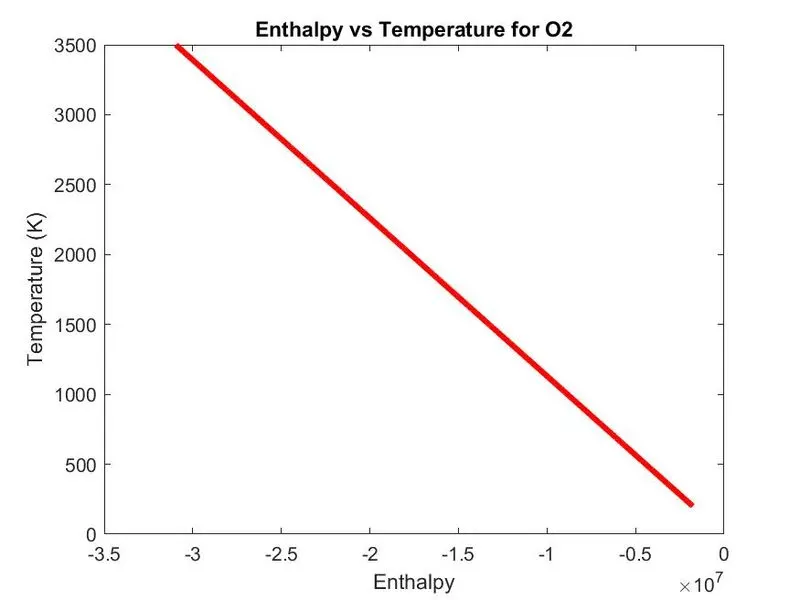
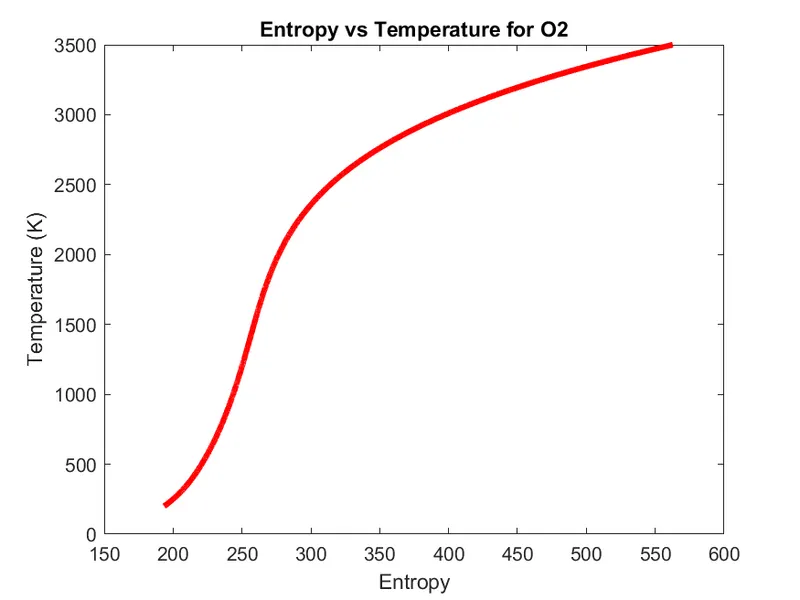
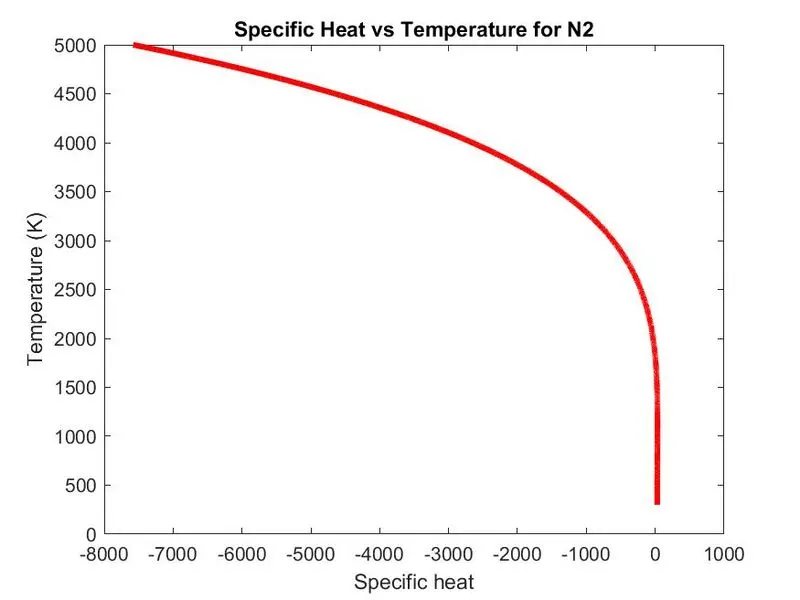
The plot of Element N2 (in order of Enthalpy, Entropy, Specific Heat)
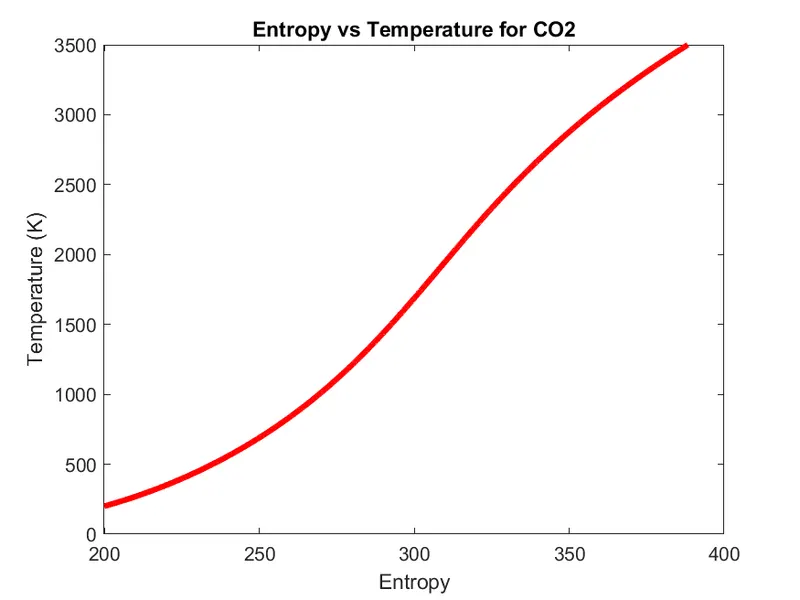
The plot of Element CO2 (in order of Enthalpy, Entropy, Specific Heat)
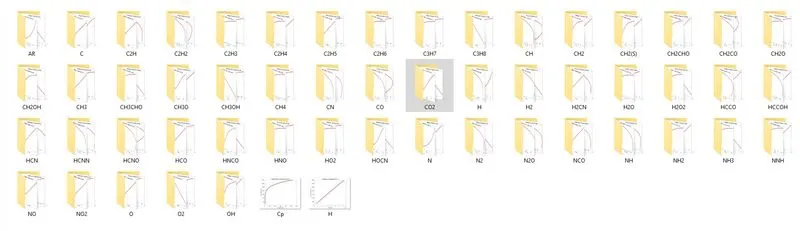
Screenshot for different folder of the Other Elements Created
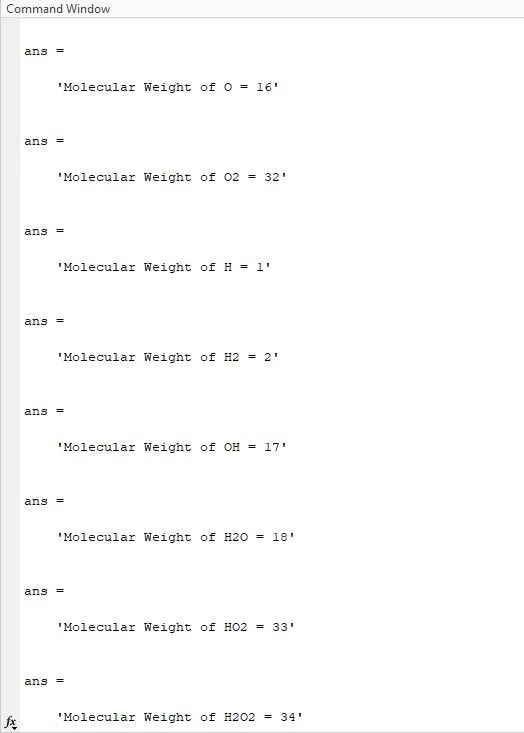
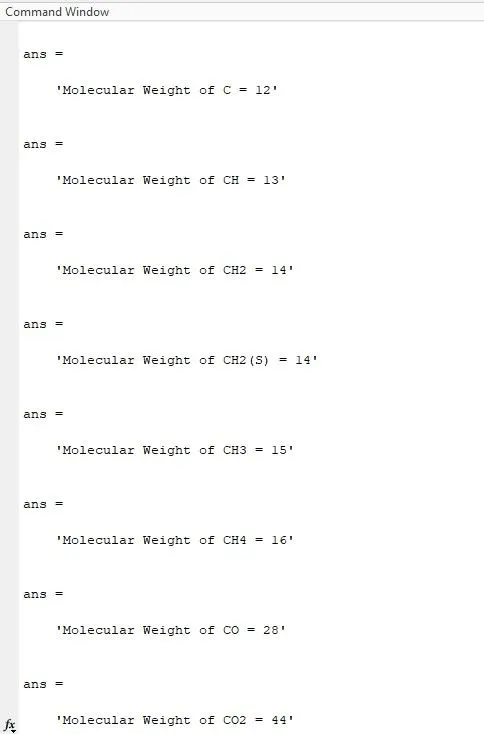
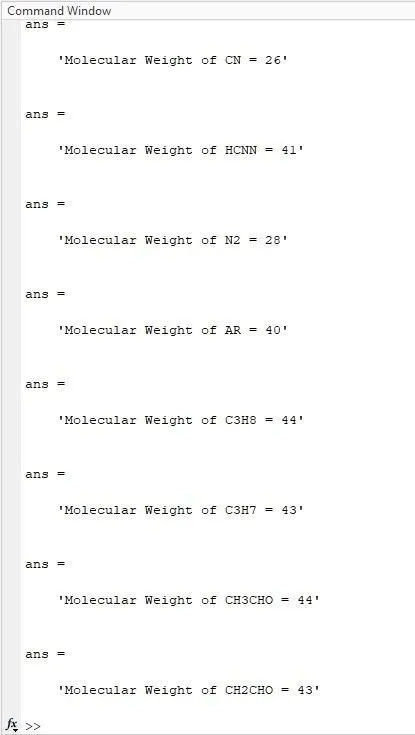
Molecular mass Screenshot (from command window)
CONCLUSION:
Thus File parsing is done for NASA Thermodynamics Data and the thermodynamics properties like Specific Heat , Enthalpy and Entropy are calculated. Also plotting is dine for the same and stored in the seperate directory by using MATLAB Code.