MATLAB Project - Parsing NASA thermodynamic data
PARSING NASA'S THERMODYNAMIC DATA FILE USING MATLAB
Aim :
To write a code to extract the co-efficient from a NASA Thermodynamic data using MATLAB and execute the code to plot the graph for Specific Heat, Enthalpy, Entropy and Molecular weight with respect to Temperature.
FILES : NASA_PARSING
Objective :
- Write a function that extracts the co-efficient to calculate the enthalpy, entropy and specific heats for all the species in the data file.
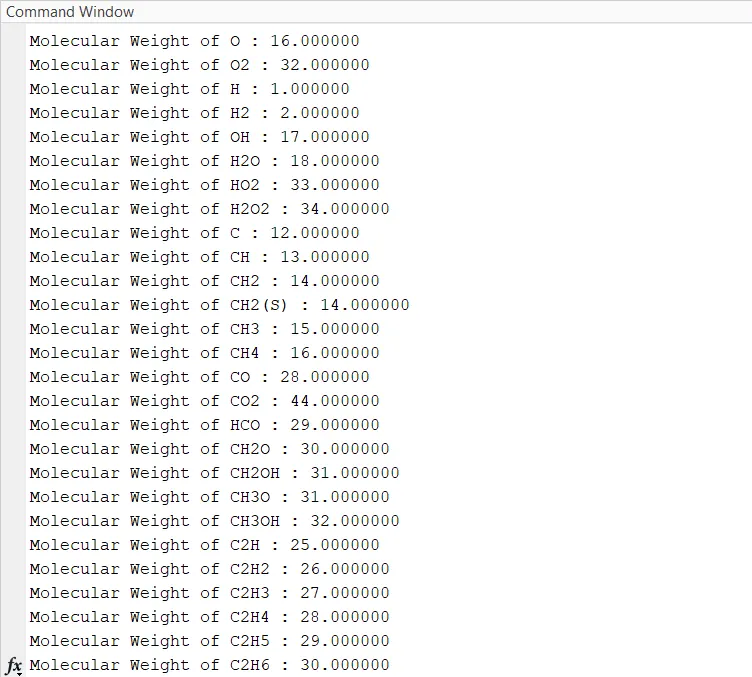
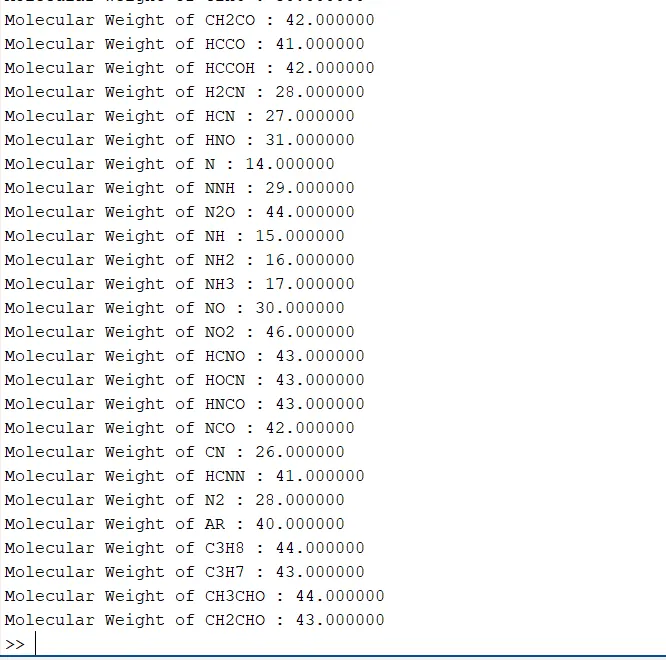
- To calculate the Molecular Weight of each species and display it in the command window of MATLAB.
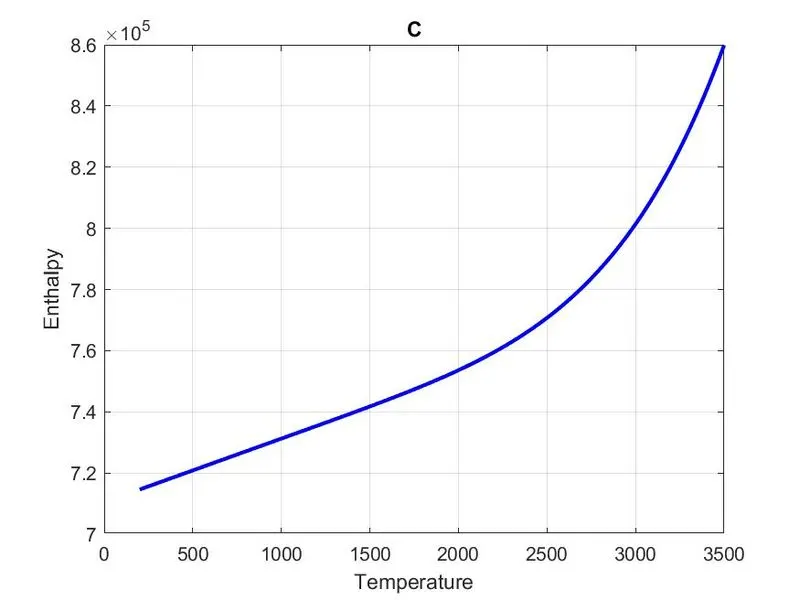
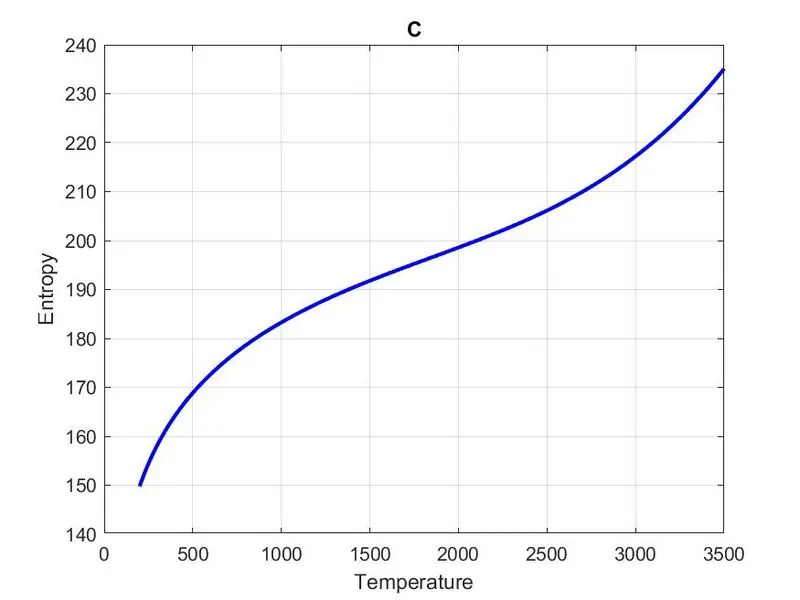
- Plot the Specific Heat, Enthalpy and Entropy for the local temperature range specific for each species.
- Save the plots as images with appropriate names and dump them in separate folders for each species with suitable name.
File Parsing :
Parse essentially means to “resolve into its component parts and describe their syntactic roles”. Parsing in a computer language refers to syntactic analysis of the input code into its components parts in order to facilitate the writing of compilers and interpreters. It can be used to describe split or separation. Parsing a file means reading in a data stream of some sort and building an in-memory model of the semantic content of that data. This aims at facilitating performing some kind of transformation on the data.
Here NASA’s Thermodynamic data file contains coefficients for polynomials that are used to calculate thermodynamic properties for various chemical species. We are going to use file parsing to read the data given and to extra these coefficients and perform calculations in MATLAB.
The Formulas are given below :

Code Logic :
- First open the into the MATLAB using fopen
- Using fgetl command to read the particular line from the data file. This function will read the lines one by one until we define a line number. For this we create for loop to make the function read the desired line.
- Store the line into a variable.
- In order to get the numerical value from the line, we first convert the string into number using the command str2num and store that value. This is done to get the rest of the co=efficients.
- This is done in a for loop for 53 time, because the file contains 53 compounds.
- Now to calculate the Specific Heat, Enthalpy and Entropy with respect to Temperature range, different functions are created to reduce the complexity of the MATLAB program.
- Plot the graph for Specific Heat, Enthalpy and Entropy for temperature range (l_low_temp to l_high_temp) and create a folder each species. And also calculate the molecular weight of each species.
- The molecular weight of each species is printed on the command window.
CODE :
clear all
close all
clc

% Reading the thermo data file
f1 = fopen('THERMO.dat','r');
first_line = fgetl(f1);

% Reading the Global Temperature
Temp = fgetl(f1);
T = strsplit(Temp,' ');

% Global temperatures given
g_low_temp = str2num(T{2});
g_mid_temp = str2num(T{3});
g_high_temp = str2num(T{4});

% To skip the comments
for i = 1:3
    fgetl(f1);
end

R = 8.314; % Gas Constant R

% Reading all the species from data file

for j = 1:53
    tline = fgetl(f1);
    A = strsplit(tline,' ');
    species_name = (A{1});

    %Reading the Global Temp
    l_low_temp  = str2num(A{end-3});
    l_high_temp = str2num(A{end-2});
    l_mid_temp  = str2num(A{end-1});

    %Reading the first line
    tline = fgetl(f1);
    a = strfind(tline,'E'); % To get each seperate values

    %Converting the string to num
    a1 = tline(1:a(1)+3);
    a1 = str2num(a1);
    a2 = tline(a(1)+4:a(2)+3);
    a2 = str2num(a2);
    a3 = tline(a(2)+4:a(3)+3);
    a3 = str2num(a3);
    a4 = tline(a(3)+4:a(4)+3);
    a4 = str2num(a4);
    a5 = tline(a(4)+4:a(5)+3);
    a5 = str2num(a5);

    tline = fgetl(f1); %Reading the second line
    a = findstr(tline,'E');

    b1 = tline(1:a(1)+3);
    b1 = str2num(b1);
    b2 = tline(a(1)+4:a(2)+3);
    b2 = str2num(b2);
    b3 = tline(a(2)+4:a(3)+3);
    b3 = str2num(b3);
    b4 = tline(a(3)+4:a(4)+3);
    b4 = str2num(b4);
    b5 = tline(a(4)+4:a(5)+3);
    b5 = str2num(b5);

    tline = fgetl(f1); % Reading the third line
    a = findstr(tline,'E');

    c1 = tline(1:a(1)+3);
    c1 = str2num(c1);
    c2 = tline(a(1)+4:a(2)+3);
    c2 = str2num(c2);
    c3 = tline(a(2)+4:a(3)+3);
    c3 = str2num(c3);
    c4 = tline(a(3)+4:a(4)+3);
    c4 = str2num(c4);

    atom = ['O','H','C','N','Ar']; %Elements in each species
    atom_weight = [16,1,12,14,40]; %Atomic mass of each element
    M =0;

    %Comparting atoms to read data of species name and calculating
    %molecular weight
    for i = 1:length(species_name)
        for j = 1:length(atom)
            if strcmp(species_name(i),atom(j))
                M = M + atom_weight(j);
                count = j;
            end
        end
        n = str2num(species_name(i));
        if(n>1)
            M = M + atom_weight(count)*(n-1);
        end
    end
    %TO display the Molecular weight
    fprintf('Molecular Weight of %s : ',species_name);
    fprintf('%f',M);
    fprintf('n'); %TO insert a new line

    %Defining Temperature range for calculations
    T = linspace(l_low_temp,l_high_temp,1500);

    %Calling function to calculate the following
    Cp = specific_heat(a1,a2,a3,a4,a5,b3,b4,b5,c1,c2,R,T,l_mid_temp); %Calculating Specific heat
    S = entropy(a1,a2,a3,a4,a5,b2,b3,b4,b5,c1,c2,c4,R,T,l_mid_temp); %Calculation Entropy
    H = enthalpy(a1,a2,a3,a4,a5,b1,b3,b4,b5,c1,c2,c3,R,T,l_mid_temp);%Calculating Enthalpy

    %Creating seperate folders for each species to store graph
    cd('D:SAVEFILESMatLab_savesFile_parsing');
    mkdir(species_name);
    cd(species_name);

    %Plotting the graph
    %Specific heat
    f2 = figure(1);
    plot(T,Cp,'linewidth',2,'color','r');
    xlabel('Temperature');
    ylabel('Specific Heat');
    title(char(species_name));
    grid on
    saveas(f2,'Specific_heat.jpg');

    f3 = figure(2);
    plot(T,S,'linewidth',2,'color','b');
    xlabel('Temperature');
    ylabel('Entropy');
    title(char(species_name));
    grid on
    saveas(f3,'Entropy.jpg');

    f4 = figure(3);
    plot(T,H,'linewidth',2,'color','b');
    xlabel('Temperature');
    ylabel('Enthalpy');
    title(char(species_name));
    grid on
    saveas(f4,'Enthalpy.jpg');

    %To change directory to the original path after each loop
    cd('D:SAVEFILESMatLab_savesFile_parsing');

end
Function to calculate Specific Heat :
%Specific heat function
function Cp = specific_heat(a1,a2,a3,a4,a5,b3,b4,b5,c1,c2,R,T,l_mid_temp)

if T>l_mid_temp
    Cp = R * (a1 + (a2*T) + (a3*T.^2) + (a4*T.^3) + a5*T.^4);
else
    Cp = R * (b3 + (b4*T) + (b5*T.^2) + (c1*T.^3) + c2*T.^4);
end
end
Function to calculate Entropy :
% Entropy Function
function S = entropy(a1,a2,a3,a4,a5,b2,b3,b4,b5,c1,c2,c4,R,T,l_mid_temp)

if T>l_mid_temp
    S = R*(a1.*log(T) + a2*T + ((a3*T.^2)/2) + ((a4*T.^3)/3) + ((a5*T.^4)/4) + b2);
else
    S = R*(b3.*log(T) + b4*T + ((b5*T.^2)/2) + ((c1*T.^3)/3) + ((c2*T.^4)/4) + c4);
end
end
Function to calculate Enthalpy :
%Specific Enthaly Function
function H = enthalpy(a1,a2,a3,a4,a5,b1,b3,b4,b5,c1,c2,c3,R,T,l_mid_temp)

if T>l_mid_temp
    H = R*T.* (a1 + ((a2*T)/2) + ((a3*T.^2)/3) + ((a4*T.^3)/4) + ((a5*T.^4)/5) + b1./T );
else
    H = R*T.* (b3 + ((b4*T)/2) + ((b5*T.^2)/3) + ((c1*T.^3)/4) + ((c2*T.^4)/5) + c3./T );
end
end
The molecular weight is calculated by taking the species_name and comparing it with the given atom name. Each elements of the compund and their respective atomic weights are inserted in an array. Two loops are used, one for the data in species_name and other loop is used to compare them using the strcmp command.
OUTPUT :
The Molecular Weight are printed in the command window :
OUTPUT GRAPHS :
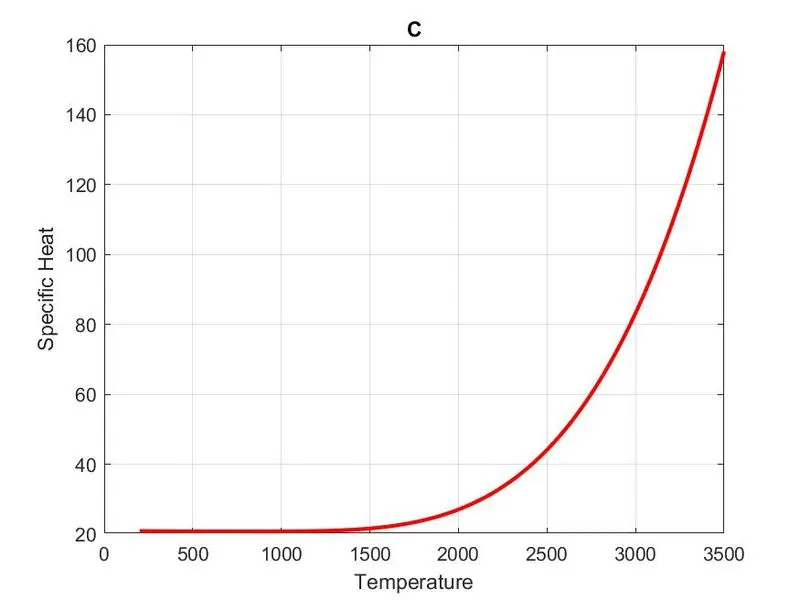
The given plots are outputs of 'C' :
Screenshot of the location where folders are saved :

ERRORS OCCURRED :
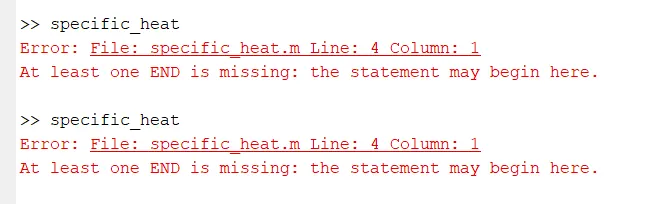
This is error fixed by putting the end command at the correct command lines.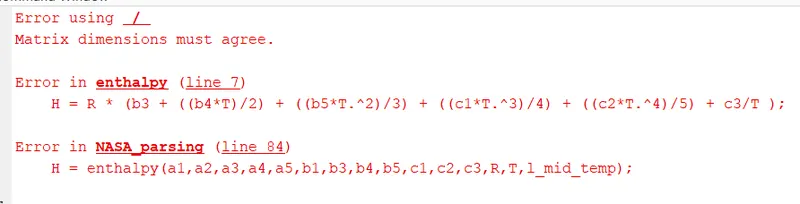
This error occurred when the code was unable to access the array value while calculating the formula. The fixed code is given below :
CONCLUSION :
Executed the code successfully and the graphs are plotted.