Project 1 - Parsing NASA thermodynamic data
Parsing NASA thermodynamic data
INTRODUCTION:
Parsing a data means to break it down into component parts so that its syntax can be analyzed, categorized, and understood. Pharsing makes reading of data in a file easier. Here we are parsing the thermodynamics data of NASA for 53 different species and also calculating specific heat,Enthalpy,Entropy for various species using the parsed data. pharsing is done using parser.
PARSER:
- A parser is commonly used as a component of an interpreter or a compiler.
- A parser is component that breaks data into smaller elements for easy translation into another language.
- A parser takes input in the form of a sequence of tokens, interactive commands, or program instructions and breaks them up into parts that can be used by other components in programming.
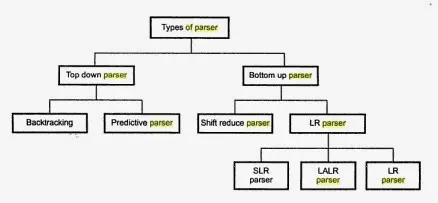
Pharser is of two types,
1) Top-Down parser : Top-down parsing technique parses the input, and starts constructing a parse tree from the root node gradually moving down to the leaf nodes.
2) Bottom-Up parser : Bottom-up parsing starts from the leaf nodes of a tree and works in upward direction till it reaches the root node.
They are further classified as,
Formula:
Where,
Cp - Specific heat (J/Kg.K)
H - Enthalpy (kJ)
S - Entropy (J/K)
R - Gas constant (J⋅mol−1⋅K−1)
T - Temperature (K)
a1 - a7 - species coefficients
MAIN PROGRAM:
%Pharsing NASA Thermodynamics data
clear all
close all
clc
%Opening file is Read mode
f1 = fopen('THERMO.dat','r');
%Reading header
header = fgetl(f1);
%Global temperatures
global_temps = fgetl(f1);
g_temps = strsplit(global_temps,' ');
global_low_temp = str2double(g_temps{2});
global_mid_temp = str2double(g_temps{3});
global_high_temp = str2double(g_temps{4});
%Skipping lines
fgetl(f1);
fgetl(f1);
fgetl(f1);
% First line
for i = 1 : 53
%Species
L_1 = fgetl(f1);
x = strsplit(L_1,' ');
species = x{1};
%Local temperatures
G = strfind(L_1,'G ');
l_low = L_1(G+3 : G+11);
local_low_temp = str2double(l_low);
l_high = L_1(G+13 : G+21);
local_high_temp = str2double(l_high);
l_mid = L_1(G+23 : G+31);
local_mid_temp = str2double(l_mid);
%Second line (1 to 5 coefficients)
cf_line_1 = fgetl(f1);
y = strfind(cf_line_1,'E');
cf1 = cf_line_1(1:y(1)+3);
a1 = str2double(cf1);
cf2 = cf_line_1(y(1)+4:y(2)+3);
a2 = str2double(cf2);
cf3 = cf_line_1(y(2)+4:y(3)+3);
a3 = str2double(cf3);
cf4 = cf_line_1(y(3)+4:y(4)+3);
a4 = str2double(cf4);
cf5 = cf_line_1(y(4)+4:y(5)+3);
a5 = str2double(cf5);
%Third line (6 to 10 coefficients)
cf_line_2 = fgetl(f1);
y = strfind(cf_line_2,'E');
cf6 = cf_line_2(1:y(1)+3);
a6 = str2double(cf6);
cf7 = cf_line_2(y(1)+4:y(2)+3);
a7 = str2double(cf7);
cf8 = cf_line_2(y(2)+4:y(3)+3);
a8 = str2double(cf8);
cf9 = cf_line_2(y(3)+4:y(4)+3);
a9 = str2double(cf9);
cf10 = cf_line_2(y(4)+4:y(5)+3);
a10 = str2double(cf10);
%Fourth line (11 to 14 coefficients)
cf_line_3 = fgetl(f1);
y = strfind(cf_line_3,'E');
cf11 = cf_line_3(1:y(1)+3);
a11 = str2double(cf11);
cf12 = cf_line_3(y(1)+4:y(2)+3);
a12 = str2double(cf12);
cf13 = cf_line_3(y(2)+4:y(3)+3);
a13 = str2double(cf13);
cf14 = cf_line_3(y(3)+4:y(4)+3);
a14 = str2double(cf14);
%gas constant
R = 8.314;
%Temperature ranging between local low and high temperatures(T)
T = linspace(local_low_temp,local_high_temp,500);
%Calling function for Specific Heat (Cp)
Cp = specific_heat(a1,a2,a3,a4,a5,a8,a9,a10,a11,a12,T,R,local_mid_temp);
%Plotting Temperature (T) Vs Specific Heat (Cp)
figure(1)
plot(T,Cp,'linewidth',2);
xlabel('TEMPERATURE (T) K');
ylabel('SPECIFIC HEAT (Cp) J/Kg.K');
grid on;
title(['Specific Heat plot of ',species]);
%Calling function for Enthalpy (H)
H = enthalpy(a1,a2,a3,a4,a5,a6,a8,a9,a10,a11,a12,a13,T,R,local_mid_temp);
%Plotting Temperature (T) Vs Enthaply (H)
figure(2)
plot(T,H,'linewidth',2,'color','r');
xlabel('TEMPERATURE (T) K');
ylabel('ENTHALPY (H) kJ');
grid on;
title(['Enthalpy plot of ',species]);
%Calling function for Entropy (S)
S = entropy(a1,a2,a3,a4,a5,a7,a8,a9,a10,a11,a12,a14,T,R,local_mid_temp);
%Plotting Temperature (T) Vs Entropy (S)
figure(3)
plot(T,S,'linewidth',2,'color','g');
xlabel('TEMPERATURE (T) K');
ylabel('ENTROPY (S) J/K');
grid on;
title(['Entropy plot of ',species]);
%Molecular Weight of species
M = molecular_wt(species); %Calling Molecular_wt function
mw = sprintf('The molecular weight of %s is %f',species,M);
disp(mw) %Displaying Molecular Weight
%creating new folder
current_folder = pwd;
mkdir(species)
cd(species)
%Saving to created folder
saveas(1,'specific_heat(Cp).png')
saveas(2,'enthalpy(H).png')
saveas(3,'entropy(S).png')
cd(current_folder);
end
%closing the file
fclose(f1);
- The "THERMO.dat" file is opened in read mode.
- The command used to read the file line by line is 'fgetl'.
- The First line of the file has only the header of the file which is stored to variable 'header'.
- The next line consist of Global temperatures arranged in low, mid, high order.
- The next 3 lines are comment lines.
- There are 53 species in this file, each species has 4 lines which are numbered at the leftmost of the line.
- The first line of every species has species name and local temperatures arranged in low, high, mid order.
- The second line of every species has 5 coefficients which are pharsed and stored in variables a1-a5.
- The third line of every species again has 5 coefficents which are pharsed and stored in variables a6-a10.
- The Fourth line of every species has 4 coefficents which are pharsed and stored in variables a11-a14.
- A for loop is made to repeats the above 4 lines for 53 species.
- The coefficients are found using 'strfind' command.
- The linspace cmd is used to generate 500 temperature values ranged between the local high and low temperature.
- The functions are used for better understanding.
- The functions to calculate specific heat, enthalpy, entropy, molecular weight are called and plots are made .
- A folder is created for every species and the graphs are saved in their respective folders.
Specific Heat:
function Cp = specific_heat(a1,a2,a3,a4,a5,a8,a9,a10,a11,a12,T,R,local_mid_temp)
Cp = 0*ones(1,length(T));
for i = 1 : length(T)
if T(i) >= local_mid_temp
    Cp(i) = (a1 + (a2*T(i)) + (a3*(T(i).^2)) + (a4*(T(i).^3)) + (a5*(T(i).^4))) * R;
elseif T(i) < local_mid_temp
    Cp(i) = (a8 + (a9*T(i)) + (a10*(T(i).^2)) + (a11*(T(i).^3)) + (a12*(T(i).^4))) * R;
end
end
end
Above is the function for calculating specific heat (Cp).
Enthalpy:
function H = enthalpy(a1,a2,a3,a4,a5,a6,a8,a9,a10,a11,a12,a13,T,R,local_mid_temp)
H = 0*ones(1,length(T));
for i = 1 : length(T)
if T(i) >= local_mid_temp
    H(i) = (a1*T(i) + a2*(T(i).^2)/2 + (a3*(T(i).^3)/3) + (a4*(T(i).^4)/4) + (a5*(T(i).^5)/5) + a6) * R;
elseif T(i) < local_mid_temp
    H(i) = (a8*T(i) + a9*(T(i).^2)/2 + (a10*(T(i).^3)/3) + (a11*(T(i).^4)/4) + (a12*(T(i).^5)/5) + a13) * R;
end
end
end
Above is the function for calculating Enthalpy (H).
Entropy:
function S = entropy(a1,a2,a3,a4,a5,a7,a8,a9,a10,a11,a12,a14,T,R,local_mid_temp)
S = 0*ones(1,length(T));
for i = 1 : length(T)
if T(i) >= local_mid_temp
     S(i) =(a1*log(T(i)) + (a2*T(i)) + (a3*(T(i).^2)/2) + (a4*(T(i).^3)/3) + (a5*(T(i).^4)/4) +a7) * R;
elseif T(i) < local_mid_temp
    S(i) = (a8*log(T(i)) + (a9*T(i)) + (a10*(T(i).^2)/2) + (a11*(T(i).^3)/3) + (a12*(T(i).^4)/4) +a14) * R;
end
end
Above is the function for calculating Entropy (S).
Molecular Weight:
function M = molecular_wt(species)
atoms = {'H','C','N','O','A'};
atomic_weight = [1, 12, 14, 16, 40];

%Assigining inital value for Molecular weight as 0
M = 0;

for i = 1 : length(species)
    for j = 1 : length (atoms)
        if (strcmpi(species(i),atoms(j))==1)
           M = M + atomic_weight(j);
           k = atomic_weight(j);
        end
    end
            n = str2double(species(i));
            if n > 1
                M = M + (k * (n - 1));

            end
end

end
Above is the function for calculating molecular wt in the given data. The intial value for molecular weight is assingned zero. The 'k' is a temperoary variable used to save atomic weight of elements which occurs more than once.
- The molecular weight of species is calculated using the Species name and the individual atomic masses of elements, which is already index matched with atomic names and stored in seperate cells.
- Two different 'For' loops are used for iterating Species and Atoms array (their lengths are taken as limits for the loop) and a Linear Search is performed for finding the mass of individual atoms.
- A variable (mem) saves atomic mass of the current atom for a reason.
- If the Species has more than 1 same atom and a number is in between the species name (like CH3OH), then the first for loop is failed and exited.
- The next 'If' loop checks if the next iteration within species is a number. If it is a numeric value then the number is detucted by 1 and multiplied the mem variable which stored the atomic mass in previous iteration.
- The number is deducted by 1 to avoid readdition of the mass of same atom again which already occured in previous iteration.
- The atomic weight of all atoms were continuously added and stored for each iteration then forms as molecular mass of the species after the last iteration and is displayed in the command window.
- strcmpi is used to make string compare case insensitive.
Errors faced:
1) Error occured due to missing change current directory command.
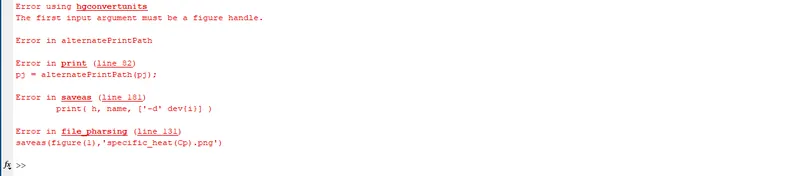
Error rectified after adding change current directory cmd ,
cd(current_folder);
2)Error occured due to using 'ln' instead of 'log' command.

Error rectified after changing 'ln' to 'log' command,
S = R*(a8*log(T) + (a9*T) + (a10*(T.^2)/2) + (a11*(T.^3)/3) + (a12*(T.^4)/4) +a14);
3) The plot for HCN was bank, after analising the thermo data i came to know there was another string 'GRI/98H' before 'G' which i used to find the local temperature values. The error was corrected by adding a blank space after 'G ' in string find cmd,
G = strfind(L_1,'G ');
Results:
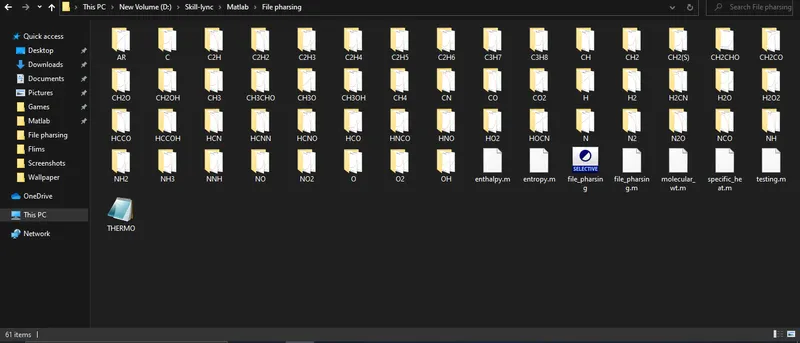
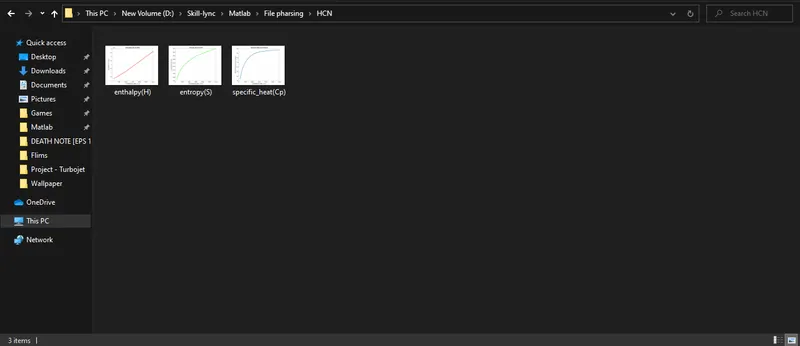
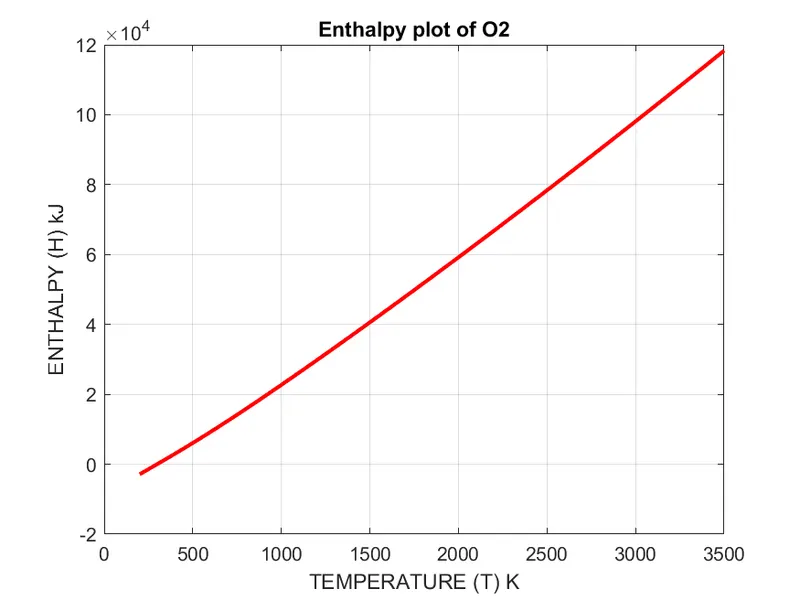
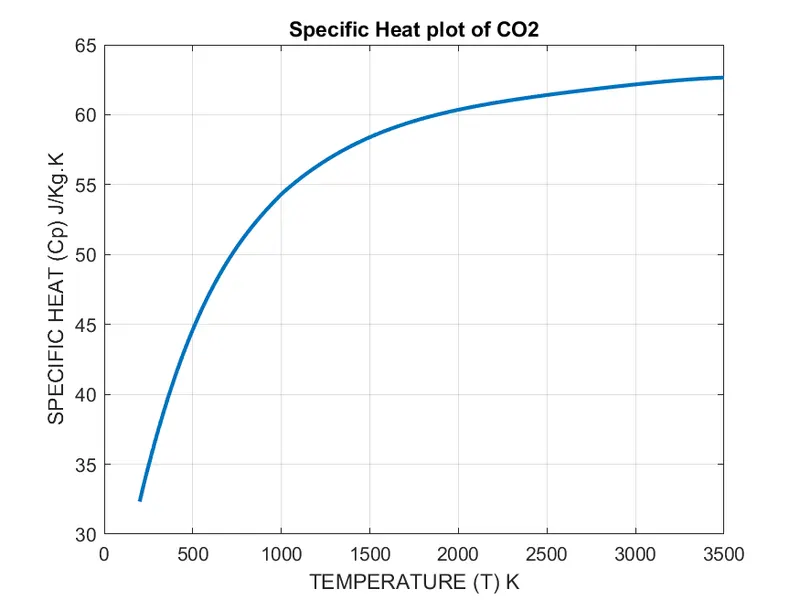
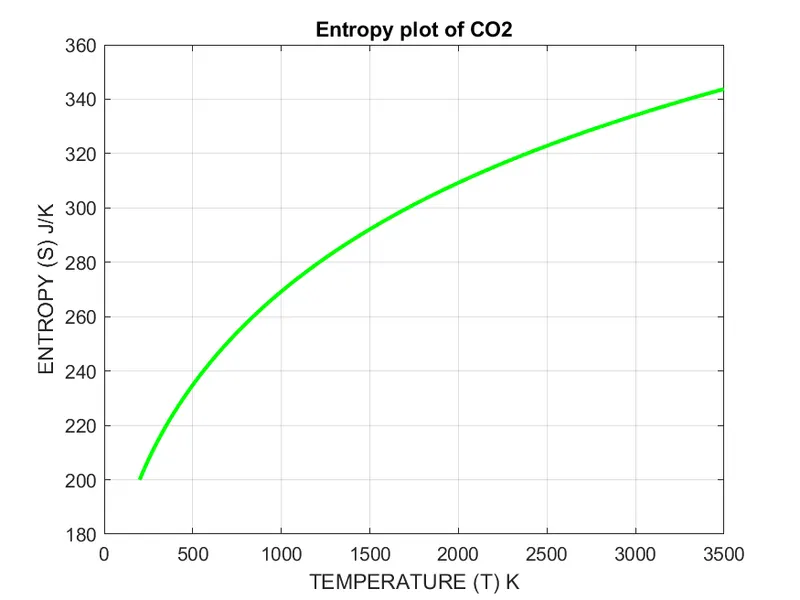
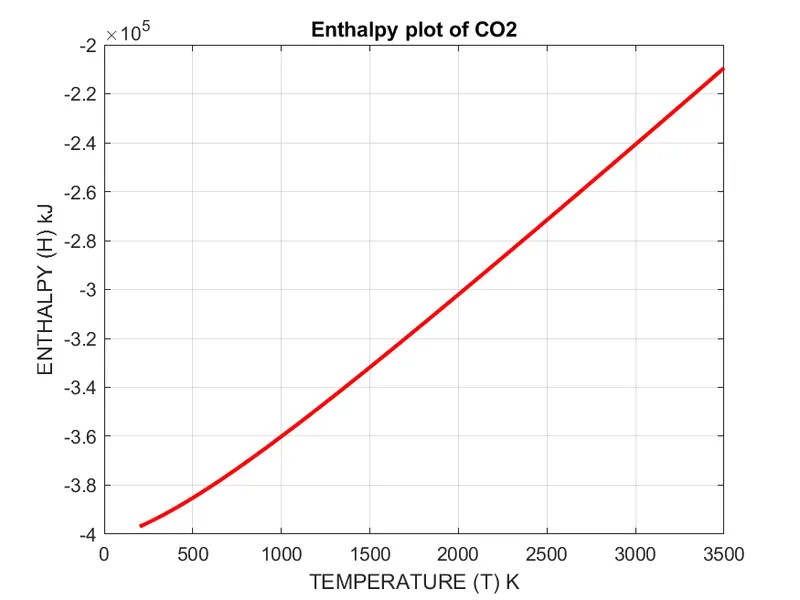
1) The folders created with the name of species and the specific heat, enthalpy and entropy graphs of that species are stored.
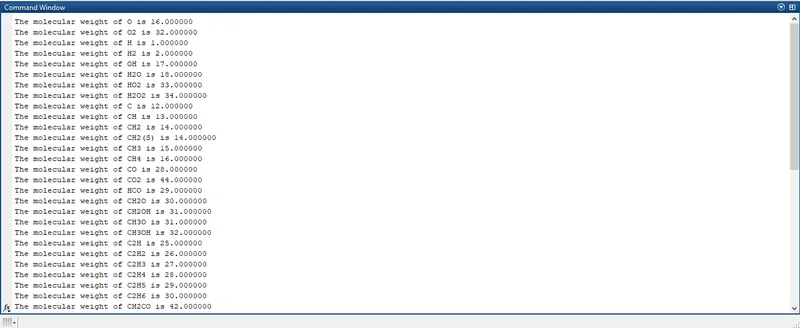
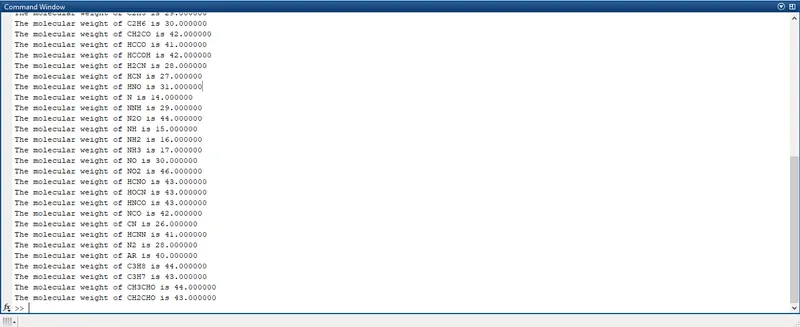
2) The molecular weight of each species displayed in the command window.
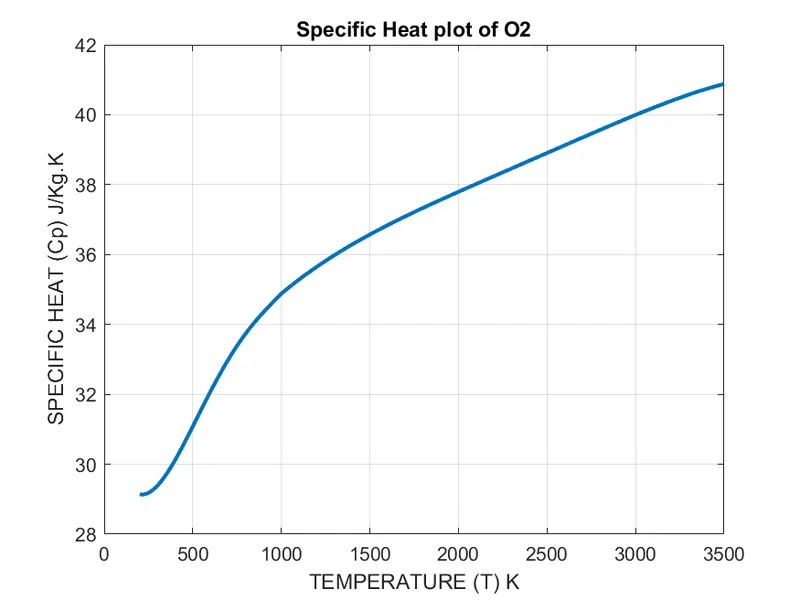
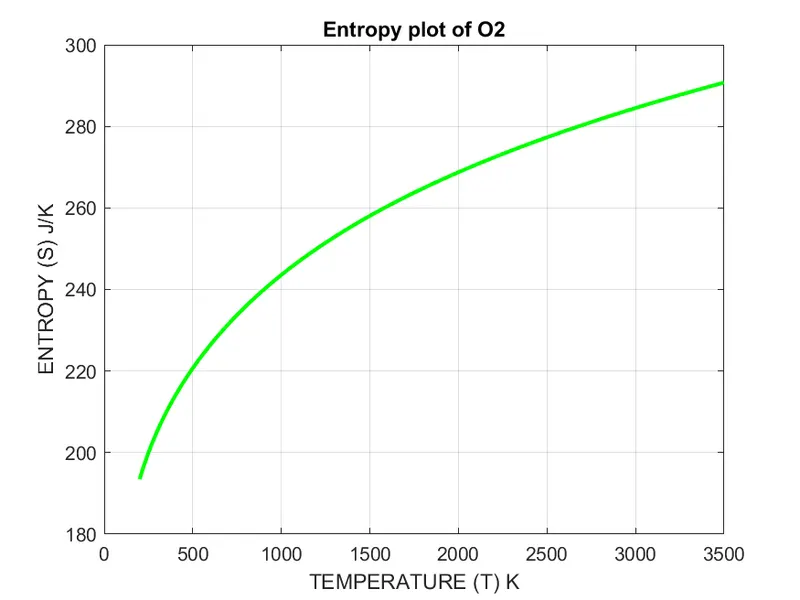
3) The plots of species O2:
4) The plots of species N2:
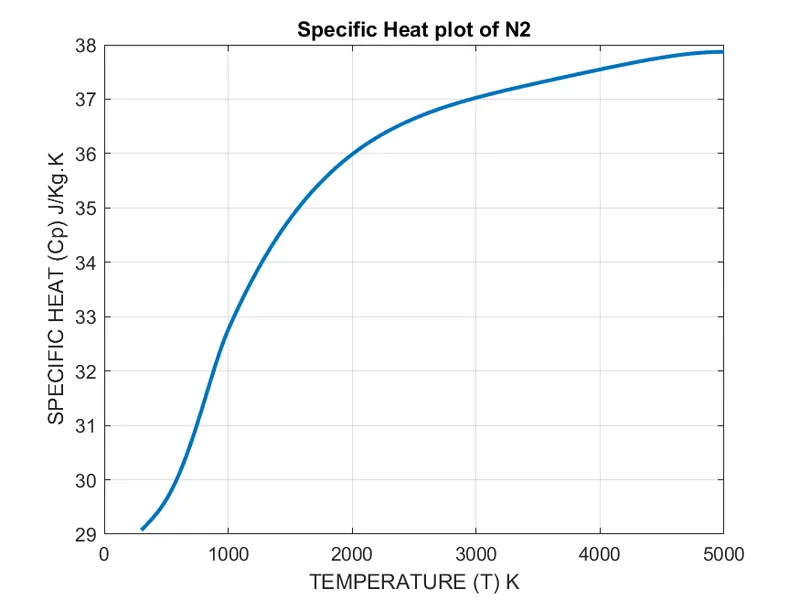
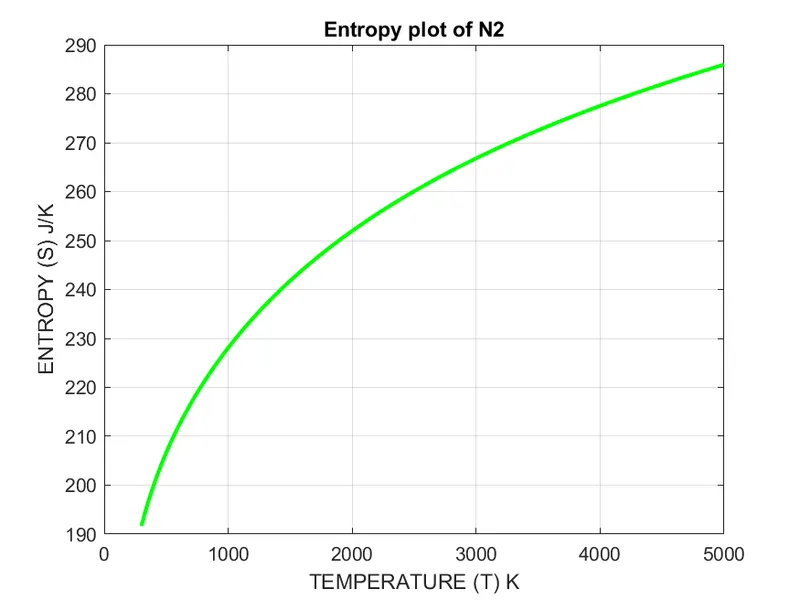
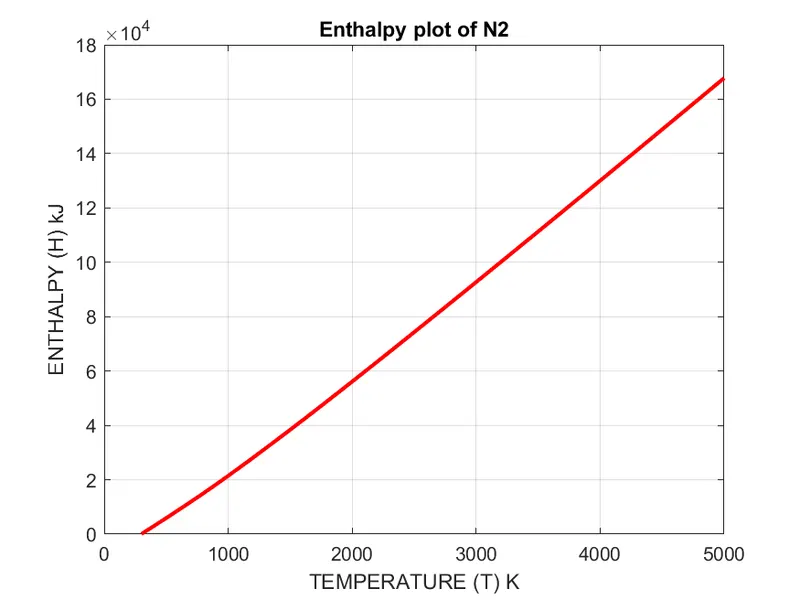
5) The plots of species CO2:
References:
https://www.tutorialspoint.com/compiler_design/compiler_design_parser.htm
https://in.mathworks.com/help/matlab/ref/pwd.html?searchHighlight=pwd&s_tid=srchtitle