Curve fitting
Aim:
- To write code to fit a linear and cubic polynomial for the Cp data.
- To plot the linear and cubic fit curves along with the raw data points. Title and axes labels are a must, legends could be shown if necessary.
- To write a code to show splitwise method.
- To explain the parameters used(Goodness of fitting) to measure the fitness characteristics for the curves.
Theory:
Curve Fitting:It is a process of constructing a curve which has the closest similarity for the series of data being considered. This method really helps in the mathematical modeling of an experimental or natural process.
Goodness of Fitting:There are 2 main quantities which help us measure the goodness of fit criteria or how well the equation represents the datapoints. They are,
- Sum of Squares of Errors(SSE).
- Rsquare (R^2).
where,
SSE(sum of squared errors) = sum(error^2)
R^2 = SSR/SST
Sum of Squares of Regression (SSR) = sum((predicted_datapoints-mean(datapoints))^2)
Sum of Squares Total (SST) = SSR + SSE
Code for Linear and Cubic fit:
clear all
close all
clc

%getting input data and assigning variables to it
cp_data=load('data');
temperature=cp_data(:,1);
cp=cp_data(:,2);

%Original curve plot
plot(temperature,cp,'linewidth',3,'color','red');
xlabel('Temperature (K)');
ylabel('Specific Heat (KJ/Kmol-K)');
title('Temperature vs Specific Heat');
grid on
hold on

%Curve fitting

%Linear Curve fit
coeffs_linear = polyfit(temperature,cp,1);
predicted_cp_linear = polyval(coeffs_linear,temperature);
%plotting predicted linear curve
plot(temperature,predicted_cp_linear,'linewidth',2,'color','blue')

%Cubic Curve fit
coeffs_cubic = polyfit(temperature,cp,3);
predicted_cp_cubic = polyval(coeffs_cubic,temperature);
%plotting predicted cubic curve
plot(temperature,predicted_cp_cubic,'linewidth',2,'color','green')
legend('Original Dataset','Linear','Cubic','location','northwest')

%goodness of fitting
%number of data points (n)
n=3200;

%Goodness of Linear fit
error_linear = cp-predicted_cp_linear;
SSE_linear = sum(error_linear.^2)
SSR_linear = sum((predicted_cp_linear - mean(cp)).^2);
SST_linear = SSR_linear+SSE_linear;
Rsquare_linear = SSR_linear/SST_linear
RMSE_linear = sqrt(SSE_linear/n);

%Goodness of Cubic fit
error_cubic = cp-predicted_cp_cubic;
SSE_cubic = sum(error_cubic.^2)
SSR_cubic = sum((predicted_cp_cubic - mean(cp)).^2);
SST_cubic = SSR_cubic+SSE_cubic;
Rsquare_cubic = SSR_cubic/SST_cubic
RMSE_cubic = sqrt(SSE_cubic/n);
I have added comment lines for better understand of program.
Output:
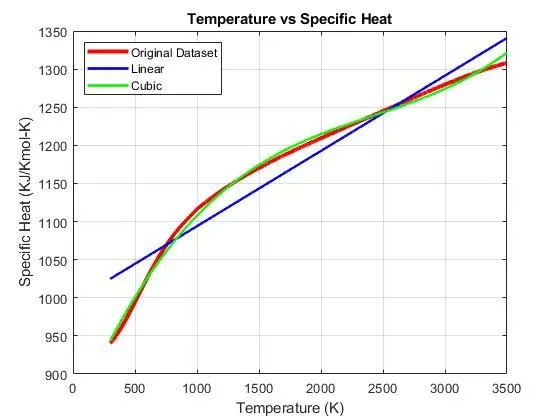
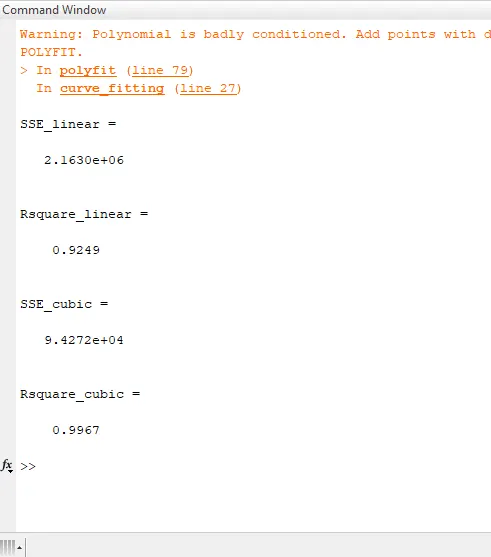
From graph and R-square value we can understand,
linear curve fit is bad fit (R^2<0.95)
cubic curve fit is best fit (R^2>0.95)
Even though we got a best fit with cubic curve fit, still the polynomial is badly conditioned and still not perfect curve so we use splitwise method
Splitwise Method:
Code for Splitwise Method:
clear all
close all
clc

%Getting input values
cp_data=load('dataa');
temperature=cp_data(:,1);
cp=cp_data(:,2);

%Original curve plot
plot(temperature,cp,'linewidth',4,'color','red');
xlabel('Temperature (K)');
ylabel('Specific Heat (KJ/Kmol-K)');
title('Temperature vs Specific Heat');
grid on
hold on

%Curve fitting using splitwise method
%Splitting temperatue values
temperature1=cp_data(1:400,1);
temperature2=cp_data(401:800,1);
temperature3=cp_data(801:1200,1);
temperature4=cp_data(1201:1600,1);
temperature5=cp_data(1601:2000,1);
temperature6=cp_data(2001:2400,1);
temperature7=cp_data(2401:2800,1);
temperature8=cp_data(2801:3200,1);

%Splitting cp values
cp1=cp_data(1:400,2);
cp2=cp_data(401:800,2);
cp3=cp_data(801:1200,2);
cp4=cp_data(1201:1600,2);
cp5=cp_data(1601:2000,2);
cp6=cp_data(2001:2400,2);
cp7=cp_data(2401:2800,2);
cp8=cp_data(2801:3200,2);

%Getting predicted_cp values
%Y=a*X^3+b*X^2+cX+d; Where X=T,Y=cp for 3rd degree
coeffs1=polyfit(temperature1,cp1,2);
predicted_cp1=polyval(coeffs1,temperature1);

coeffs2=polyfit(temperature2,cp2,2);
predicted_cp2=polyval(coeffs2,temperature2);

coeffs3=polyfit(temperature3,cp3,2);
predicted_cp3=polyval(coeffs3,temperature3);

coeffs4=polyfit(temperature4,cp4,2);
predicted_cp4=polyval(coeffs4,temperature4);

coeffs5=polyfit(temperature5,cp5,2);
predicted_cp5=polyval(coeffs5,temperature5);

coeffs6=polyfit(temperature6,cp6,2);
predicted_cp6=polyval(coeffs6,temperature6);

coeffs7=polyfit(temperature7,cp7,2);
predicted_cp7=polyval(coeffs7,temperature7);

coeffs8=polyfit(temperature8,cp8,2);
predicted_cp8=polyval(coeffs8,temperature8);

predicted_cp=[predicted_cp1;predicted_cp2;predicted_cp3;predicted_cp4;predicted_cp5;predicted_cp6;predicted_cp7;predicted_cp8];

%Plotting predicted values
plot(temperature,predicted_cp,'linewidth',2,'color','g')
legend('Original data','Predicted data','location','northwest')

%goodness of splitwise fitting
%number of data points (n)
n=3200;

error = cp-predicted_cp;
SSE_splitwise = sum(error.^2)
SSR = sum((predicted_cp - mean(cp)).^2);
SST = SSR+SSE_splitwise;
Rsquare_splitwise = SSR/SST
RMSE = sqrt(SSE_splitwise/n);
The 3200 input values is split into 8 set each of 400 values for splitwise method .
Output:
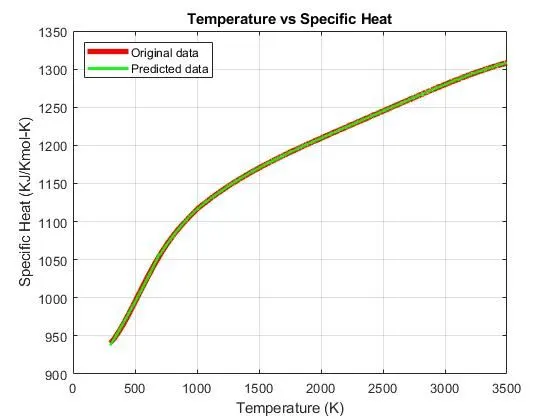
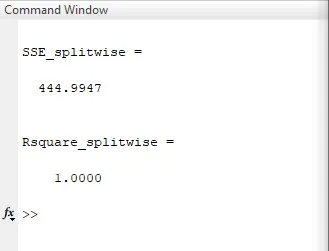
From the graph and R-square value we can understand,
Splitwise method is perfect fit (R^2=1)
Inquest:
1)How to make a curve fit perfectly?
perfect fit means the predicted curve should fit the oringal curve at every datapoints without getting any error or warning. For this we can use the splitwise operator by using which we can get a perfect fit. The other method is to increase the degree of polynomial but it may result in badly conditioned polynomial warning. So the best meothd is splitwise with 2nd degree.The R^2 should be 1 for perfect fit.
eg)splitwise for which i got R^2= 1
2)How to get the best fit?
A best fit refers to R^2 > 0.95
eg) Cubic curve fit for which i got R^2=0.9967
3)What could be done to improve the cubic fit?
To improve a cubic fit, we should try to increase r value by increasing no. of splits in splitwise method.