Project 1 - Parsing NASA thermodynamic data
FILE PARSING OF NASA THERMODYNAMIC DATA
AIM:
To execute file or data parsing from the nasa thermodynamic data file.
FILE PARSING DEFINITION:
Parsing is the process of analyzing a string or symbol, either in natural language, computer languages or data structurtes conforming to the rules of a formal grammar.Within computational language the term is used to refer to the formal analysis by a computer of a sentence or other string of words into its constituents, resulting in a parse tree showing their syntactic relation to each other, which may also contain semantic and other information . Some parsing algorithms may generate a parse forest or list of parse trees for a syntactically ambiguous input.
OBJECTIVE:
- To extracts the 14 co-efficients and calculates the enthalpy, entropy and specific heats for all the species in the data file.
- To calculate the molecular weight of each species and display it in the command window.
- To Plot the Cp, Enthalpy and Entropy for the local temperature range.
- To Save the plots as images with appropriate names and dump them in separate folders for each species with suitable name. And all this will be done automatically.
- To submit the main program that will just take the "THERMO.dat" file as an input and generate Cp, H and S plots.
CONTENTS:
- CODE WITH EXPLANATION.
- FULL PROGRAM.
- PLOTS.
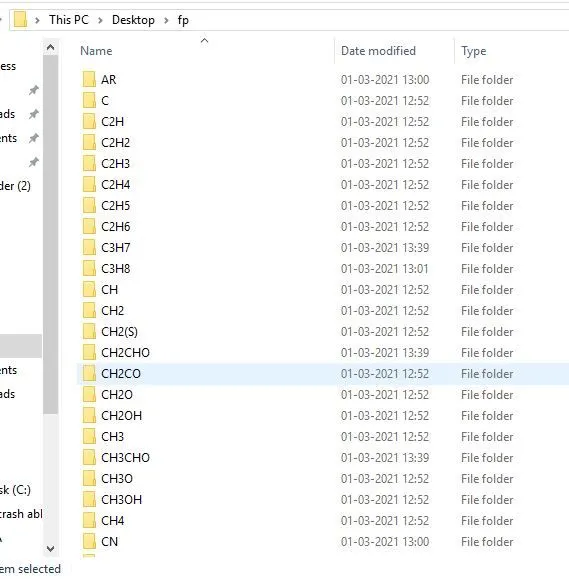
- SCREENSHOT OF THE WINDOW WHERE ALL THE FOLDERS ARE STORED.
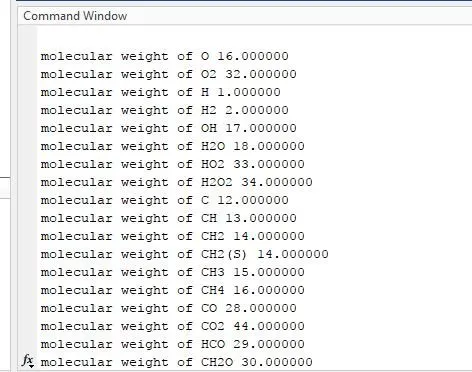
- SCREENSHOT OF THE COMMAND WINDOW WHICH SHOWS THE MOLECULART WEIGHT OF EACH SPECIES.
- SCREENSHOT OF THE WORKSPACE.
- ERRORS.
- REFERENCE.
- RESULT.
CODE WITH EXPLANATION:
clear all
close all
clc
%opening the file 'THERMO.dat' from the directory
f1=fopen('THERMO.dat','r')
fgetl(f1) %skiping the first
global_temp=fgetl(f1) % getting the line data which is the global temperature
GT=strsplit(global_temp,' ')% splitting the string
HERE,
clear all clears the workspace,close all closes all figure windows if any, clc clears all text or code in the command window. Then we use 'fopen' command which is an inbuilt command in matlab to open the file , here the file is 'THERMO.dat' so fopen('THERMO.dat','r') opens the file and 'r' denotes that we are going to read the data from the file and the data is stored in 'f1' as output. Then 'fgetl' which is again a inbuilt command is used to get first line from 'f1' data and we are not storing it in any variable since we do not need the first line so it is more like skipping the first line, the next step again getting first line using'fgetl' and storing it in 'global_temp' since its the global temperature. Now the temperatures are in string so we are splitting it with 'strsplit'(inbuilt command) inbetween the spaces so we use' ' for the matlab to split where there is space and stroing it in output 'GT'.
%converting string to number
global_low_temp=str2num(GT{2})
global_mid_temp=str2num(GT{3})
global_high_temp=str2num(GT{4})
%skiping the next 3 lines
fgetl(f1)
fgetl(f1)
fgetl(f1)
HERE,
we have global temperatures but we need them separately as global low,mid and high tempeartures, so we are storing them separately into 'global_low_temp,global_mid_temp,global_high_temp' and at the same time coverting the string to number using str2num(inbuilt command) , and GT{2}.GT{3},GT{4} are global low,mid and high respectively. And next three lines in the data file are not necessary so we are getting and skipping it.
for i=1:53

%getting local temperature data
lT=fgetl(f1)
lT=strsplit(lT)
LT=length(lT)
HERE,
we have 53 elements in the data file so we need to run the iteration to run 53 times starting from first element so 'for i=1:53' is used for this purpose. Now once we got the global temperatures we are going to the next line which has the element and its local temperature, so we are getting the line with 'fgetl' of file'f1' and storing it in 'lT' , now since it is in string we are splitting it to separate strings. And the length of 'lt' is stored in 'LT'.
% splitting the string
%converting string to number
species_name=lT{1};
local_low_temp=lT{LT-3};
local_mid_temp=lT{LT-1};
local_high_temp=lT{LT-2};
t1=str2num(local_low_temp);
t2=str2num(local_mid_temp);
t3=str2num(local_high_temp);
HERE,
The string 'lt' is in 1*4 array so as we need each element and their temperature ranges separately we are using'{}' to get the each element of the cell separately and storing them accordingly. And we then convert the string to number using 'str2num'(inbuilt command).
ce1l=fgetl(f1);%getting co.eff data from 1st line
ce2l=fgetl(f1);%getting co.eff data from 2nd line
ce3l=fgetl(f1);%getting co.eff data from 3rd line
HERE,
we are getting the coefficients of each line and storing them in 'ce1l,ce2l,ce3l'.
%separating each co.eff data and assigning them under different variable
%extracting high temperature co.eff
a=strfind(ce1l,'E');
e1=str2double(ce1l(1:a(1)+3));
e2=str2double(ce1l(a(1)+4:a(2)+3));
e3=str2double(ce1l(a(2)+4:a(3)+3));
e4=str2double(ce1l(a(3)+4:a(4)+3));
e5=str2double(ce1l(a(4)+4:a(5)+3));
b=strfind(ce2l,'E');
e6=str2double(ce2l(1:b(1)+3));
e7=str2double(ce2l(b(1)+4:b(2)+3));
HERE,
The ce1l ,ce2l and ce3l will be in a string in order to separate them we use 'strfind'(inbuilt command) to find 'E' which is the comman reference letter for each value and we '+' them with number of elements that is needed in the lines that follows. So a will separate the string using 'E' as reference and then in the next line as we need the first coefficient so we use 'ce1l(1:a(1)+3)' and well get the first value ,the same follows for all the 14 coefficients. And 'str2double' is used since we need to convert the string to integer value with decimals. And the first 7 coefficients are hihg temperature coeffcients .
%extracting low temperature co.eff
e8=str2double(ce2l(b(2)+4:b(3)+3));
e9=str2double(ce2l(b(3)+4:b(4)+3));
e10=str2double(ce2l(b(4)+4:b(5)+3));
c=strfind(ce3l,'E');
e11=str2double(ce3l(1:c(1)+3));
e12=str2double(ce3l(c(1)+4:c(2)+3));
e13=str2double(ce3l(c(2)+4:c(3)+3));
e14=str2double(ce3l(c(3)+4:c(4)+3));
Here,
The same steps are followed as mentioned for previous lines of code but these are all low temperature coefficients.
R=8.3145 ;% universal gas constant is 8.3145j/molk^

T=linspace(t1,t3,100);%taking 100 different temperature range
for i=1:length(T);%asking loop to run from 1st temperature to the 100th temperature
if T(i)> t2 ;%if T(i) lies between t1 and t2 execute 1st set of formula with higher
%temperature co.eff else excute with 2nd set formula with lower co.eff
%temperature.

    Cp(i)=(e1+(e2*T(i))+(e3*T(i)^2)+(e4*T(i)^3)+(e5*T(i)^4))*R;
    H(i)=(e1+(e2*T(i)/2)+((e3*T(i)^2)/3)+((e4*T(i)^3)/4)+((e5*T(i)^4)/5)+(e6/T(i)))*R*T(i);
    S(i)=((e1*log(T(i)))+(e2*T(i))+((e3*T(i)^2)/2)+((e4*T(i)^3)/3)+((e5*T(i)^4)/4)+(e7))*R;
else
    Cp(i)=(e8+(e9*T(i))+(e10*T(i)^2)+(e11*T(i)^3)+(e12*T(i)^4))*R;
    H(i)=(e8+(e9*T(i)/2)+((e10*T(i)^2)/3)+((e11*T(i)^3)/4)+((e12*T(i)^4)/5)+(e13/T(i)))*R*T(i);
    S(i)=((e8*log(T(i)))+(e9*T(i))+((e10*T(i)^2)/2)+((e11*T(i)^3)/3)+((e12*T(i)^4)/4)+(e14))*R;

end
end
Here,
'R' is the universal gas constant so we input it manually. Then 'T=linspace(t1,t3,100)' is used because we want 100 different temperature range between the local low temperature and local high temperature, and 'linspace' is an inbuilt command to take the values inbetween any two range and 100 is the range. And next line we are asking the loop to run from 1 to length of T which is 100 so the loop will run from 1st temperature to the 100th temperature. And in the next line we use 'if' because we want separate set of answers for low temperature ranges and high temperature ranges so if T(i)>t2 (t2=mid temperature) then execute the first set fo formula which is for higher temperature range and if it T(i) is lesser than t2 it will run the secind set of formula which is the lower temperature ranges. ( NOTE: the formula is predefined)
%ploting between Temperature and Cp ( specific heat)
figure(1)
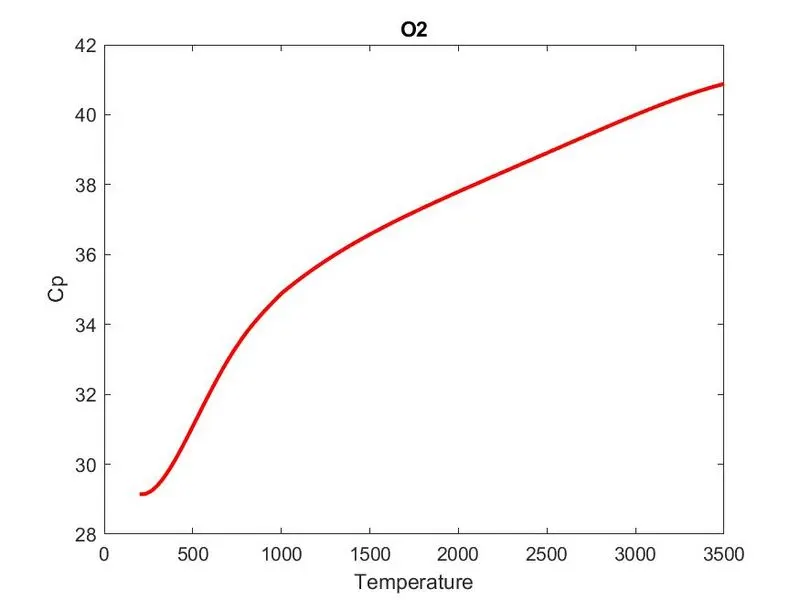
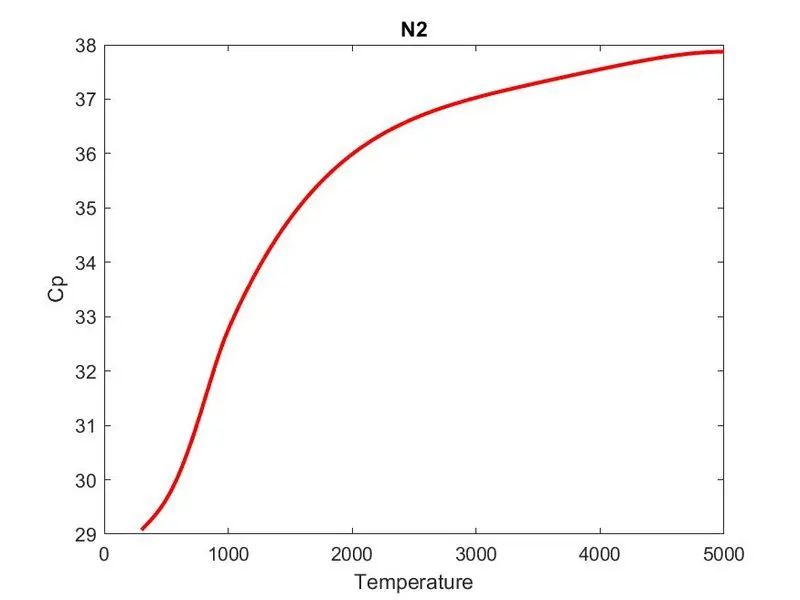
plot(T,Cp,'color','r','linewidth',2)
xlabel('Temperature')
ylabel('Cp')
title(species_name);
%ploting between Temperature and H (entropy)
figure(2)
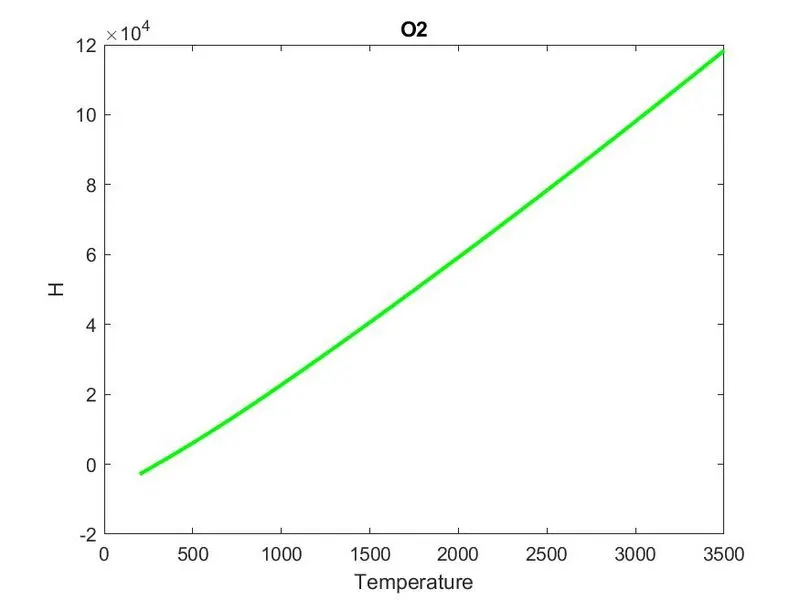
plot(T,H,'color','g','linewidth',2)
xlabel('Temperature')
ylabel('H')
title((species_name));
%ploting between Temperature and S (enthalpy)
figure(3)
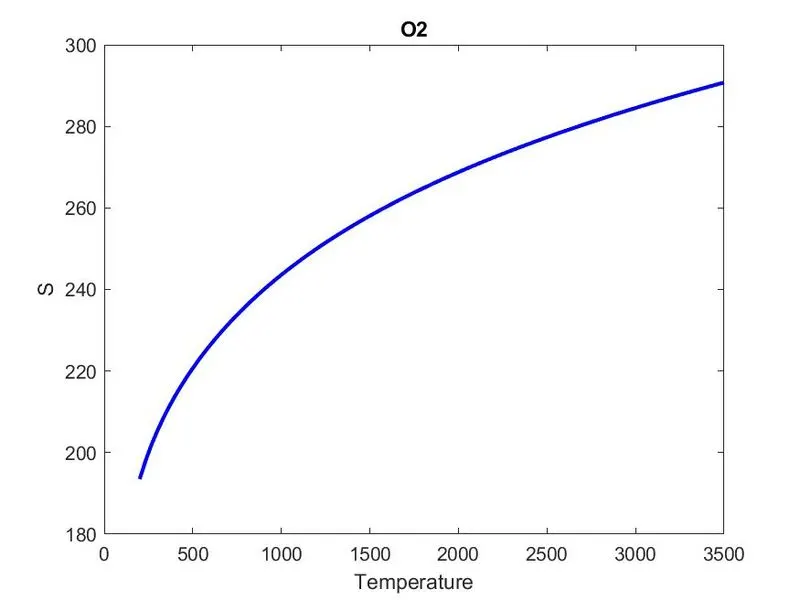
plot(T,S,'color','b','linewidth',2)
xlabel('Temperature')
ylabel('S')
title((species_name));
HERE,
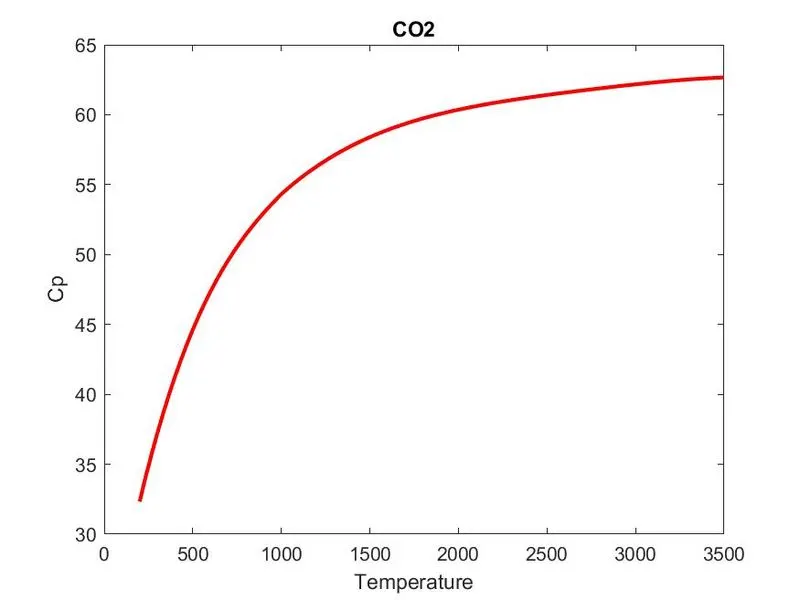
we are going to plot temperature between Cp,H,S(specific heat,enthalpy and entropy). So plot command is used here which is inbuilt command for plotting and we give color to be 'r','g','b' which changes color accordingly and linewidth of the plot will be 2 for all. Figure (1) ,Figure (2),Figure (3) will have have plot between temperature and Cp, temperature and H,temperature and S respectively. 'xlabel' and'ylabel' which is a command is used to define the x asis and y axis is used and their names are given accordingly. And the title will hold name of each species when the loop rub separately for each element, 'title' is also an inbuilt command when we need a title for our plot.
mkdir(['C:\Users\Skill_Lync\Desktop\fp\',species_name])
cd(['C:\Users\Skill_Lync\Desktop\fp\',species_name])
saveas(1,'Cp','jpg');
saveas(2,'H','jpg');
saveas(3,'S','jpg');
Here ,
we are creating a folder where the plots need to be stored and location we want in the computer that is the dircetory is copied and pasted along the 'mkdir' and 'saveas' is used to save each figure separately.
%for finding the molecular weight of each element.
atom=['O','H','C','N','R','A'];
atom_weight=[16 1 12 14 40 39];
M=0;
for i=1:length(species_name);
  for j=1:length(atom);
    if strcmp(species_name(i),atom(j));
      M=M+atom_weight(j);
      position=j;
    end
    end
      n=str2num(species_name(i));
      if n>1
      M=M+atom_weight(position)*(n-1) ;

    end
end
   fprintf('molecular weight of %s %f \n' ,species_name,M)
end
Here,
we are going to find the molecular weight of each element as asked . We are first deriving each atoma and its molecular mass separately in the first tow lines of the code. And we want the weight for all the 53 elements so we are asking the iteration to run from 1st element of the species to 53rs element of the species using 'for' command and same for each elements molecular mass. Once we have that we are comparing each species with the atom using 'strcmp'(inbuilt command for comparing) which compares and takes the right value of each species. And for some elements we have 2 elements for example in H2O we have 2 H inorder to calculate that we find the position at which the iteration stops and then using 'if' command we ask the matlab to excecute second formula. And fprintf is used to print each species and their molecular weight respectively.
FULL PROGRAM:
clear all
close all
clc
%opening the file 'THERMO.dat' from the directory
f1=fopen('THERMO.dat','r');
fgetl(f1) %skiping the first
global_temp=fgetl(f1) ;% getting the line data which is the global temperature
GT=strsplit(global_temp,' ');% splitting the string
%converting string to number
global_low_temp=str2num(GT{2}) ;
global_mid_temp=str2num(GT{3});
global_high_temp=str2num(GT{4});
%skiping the next 3 lines
fgetl(f1);
fgetl(f1);
fgetl(f1);

for i=1:53

%getting local temperature data
lT=fgetl(f1);
lT=strsplit(lT);
LT=length(lT);
% splitting the string
%converting string to number
species_name=lT{1};
local_low_temp=lT{LT-3};
local_mid_temp=lT{LT-1};
local_high_temp=lT{LT-2};
t1=str2num(local_low_temp);
t2=str2num(local_mid_temp);
t3=str2num(local_high_temp);

ce1l=fgetl(f1);%getting co.eff data from 1st line
ce2l=fgetl(f1);%getting co.eff data from 2nd line
ce3l=fgetl(f1);%getting co.eff data from 3rd line
%separating each co.eff data and assigning them under different variable
%extracting high temperature co.eff
a=strfind(ce1l,'E');
e1=str2double(ce1l(1:a(1)+3));
e2=str2double(ce1l(a(1)+4:a(2)+3));
e3=str2double(ce1l(a(2)+4:a(3)+3));
e4=str2double(ce1l(a(3)+4:a(4)+3));
e5=str2double(ce1l(a(4)+4:a(5)+3));
b=strfind(ce2l,'E');
e6=str2double(ce2l(1:b(1)+3));
e7=str2double(ce2l(b(1)+4:b(2)+3));
%extracting low temperature co.eff
e8=str2double(ce2l(b(2)+4:b(3)+3));
e9=str2double(ce2l(b(3)+4:b(4)+3));
e10=str2double(ce2l(b(4)+4:b(5)+3));
c=strfind(ce3l,'E');
e11=str2double(ce3l(1:c(1)+3));
e12=str2double(ce3l(c(1)+4:c(2)+3));
e13=str2double(ce3l(c(2)+4:c(3)+3));
e14=str2double(ce3l(c(3)+4:c(4)+3));
R=8.3145 ;% universal gas constant is 8.3145j/molk^

T=linspace(t1,t3,100);%taking 100 different temperature range
for i=1:length(T);%asking loop to run from 1st temperature to the 100th temperature
if T(i)> t2 ;%if T(i) lies between t1 and t2 execute 1st set of formula with higher
%temperature co.eff else excute with 2nd set formula with lower co.eff
%temperature.

    Cp(i)=(e1+(e2*T(i))+(e3*T(i)^2)+(e4*T(i)^3)+(e5*T(i)^4))*R;
    H(i)=(e1+(e2*T(i)/2)+((e3*T(i)^2)/3)+((e4*T(i)^3)/4)+((e5*T(i)^4)/5)+(e6/T(i)))*R*T(i);
    S(i)=((e1*log(T(i)))+(e2*T(i))+((e3*T(i)^2)/2)+((e4*T(i)^3)/3)+((e5*T(i)^4)/4)+(e7))*R;
else
    Cp(i)=(e8+(e9*T(i))+(e10*T(i)^2)+(e11*T(i)^3)+(e12*T(i)^4))*R;
    H(i)=(e8+(e9*T(i)/2)+((e10*T(i)^2)/3)+((e11*T(i)^3)/4)+((e12*T(i)^4)/5)+(e13/T(i)))*R*T(i);
    S(i)=((e8*log(T(i)))+(e9*T(i))+((e10*T(i)^2)/2)+((e11*T(i)^3)/3)+((e12*T(i)^4)/4)+(e14))*R;

end
end
%ploting between Temperature and Cp ( specific heat)
figure(1)
plot(T,Cp,'color','r','linewidth',2)
xlabel('Temperature')
ylabel('Cp')
title(species_name);
%ploting between Temperature and H (entropy)
figure(2)
plot(T,H,'color','g','linewidth',2)
xlabel('Temperature')
ylabel('H')
title((species_name));
%ploting between Temperature and S (enthalpy)
figure(3)
plot(T,S,'color','b','linewidth',2)
xlabel('Temperature')
ylabel('S')
title((species_name));

mkdir(['C:\Users\Skill_Lync\Desktop\fp\',species_name])
cd(['C:\Users\Skill_Lync\Desktop\fp\',species_name])
saveas(1,'Cp','jpg');
saveas(2,'H','jpg');
saveas(3,'S','jpg');

%for finding the molecular weight of each species of element.
atom=['O','H','C','N','R','A'];
atom_weight=[16 1 12 14 40 39];
M=0;
for i=1:length(species_name);
  for j=1:length(atom);
    if strcmp(species_name(i),atom(j));
      M=M+atom_weight(j);
      position=j;
    end
    end
      n=str2num(species_name(i));
      if n>1
      M=M+atom_weight(position)*(n-1) ;

    end
end
   fprintf('molecular weight of %s %f \n' ,species_name,M)
end
PLOTS:
PLOT of Cp,H and S for O2:
Temperature and Cp
Temperature and H
Temperature and S
PLOT of Cp,H and S for N2:
Temperature and Cp
Temperature and H
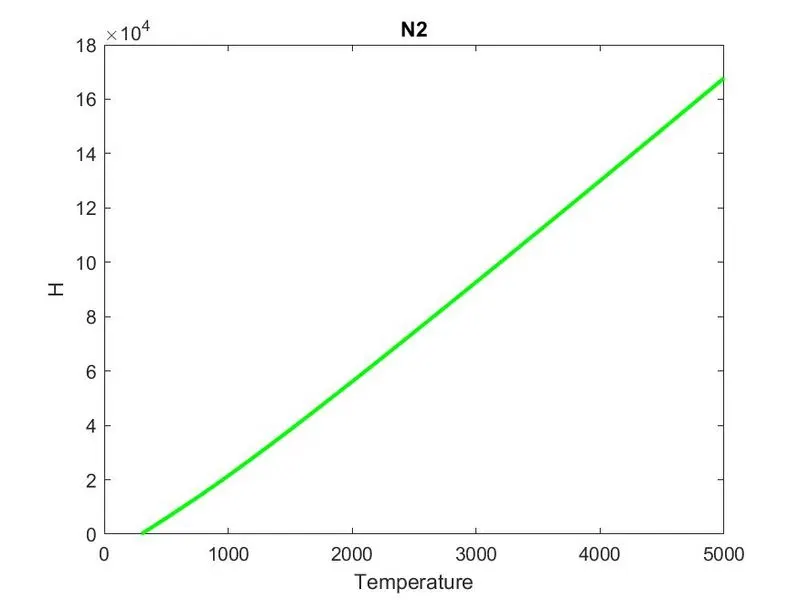
Temperature and S
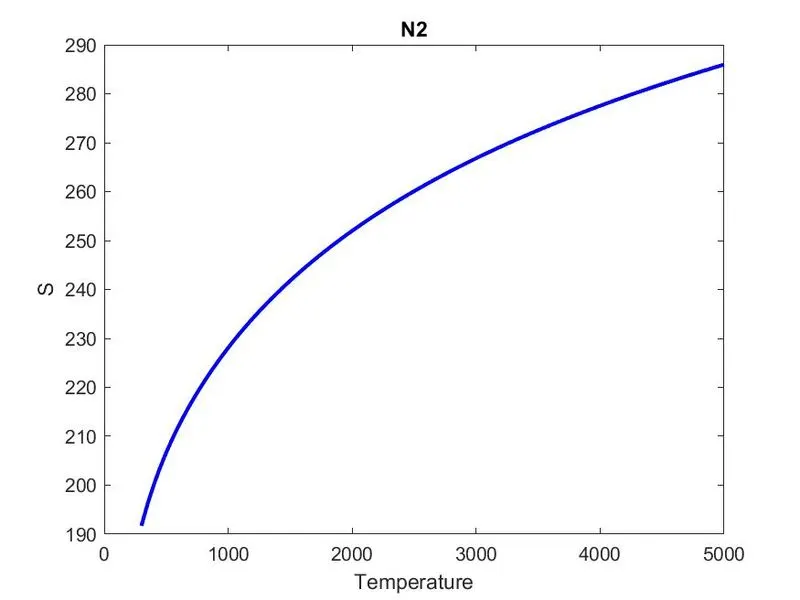
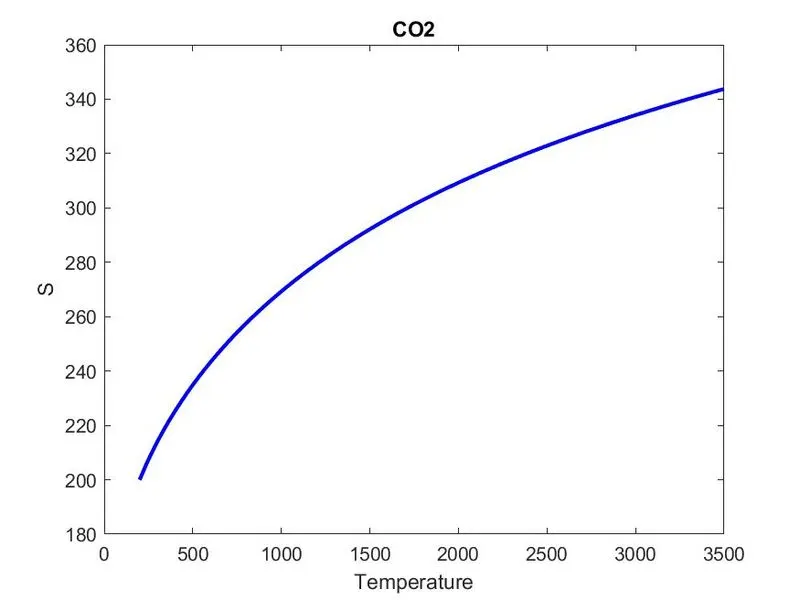
PLOT of Cp,H and S for CO2:
Temperature and Cp
Temperature and H
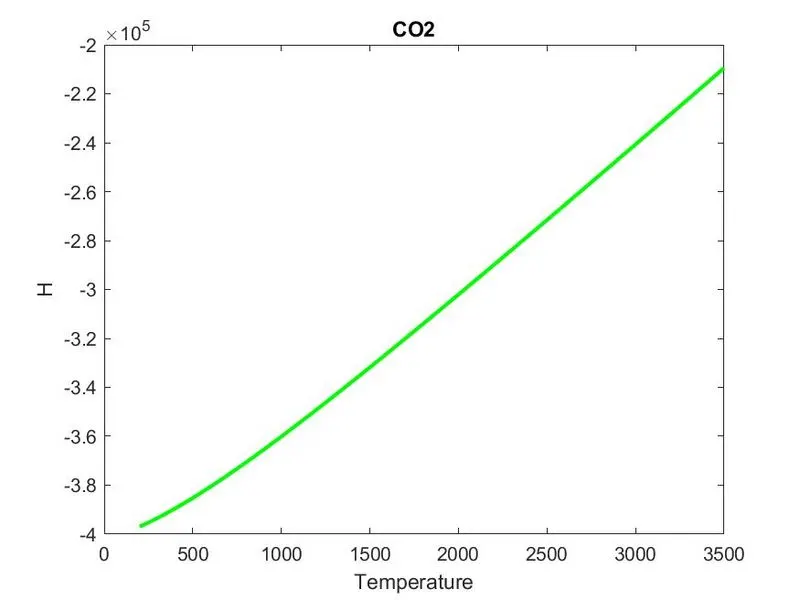
Temperature and S
Screenshot of the window where all the folders are saved:
Screenshot of the command window which shows molecular weights of each species:
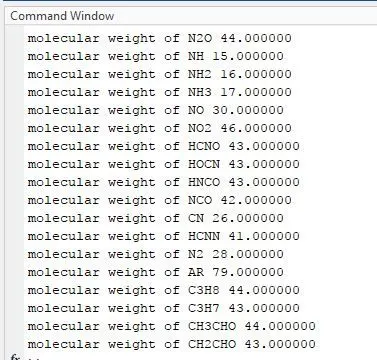
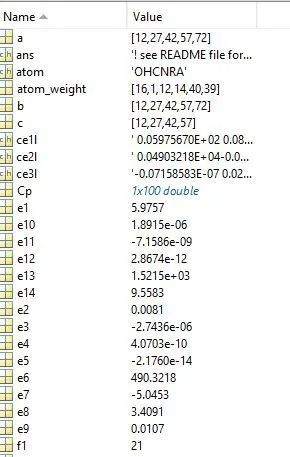
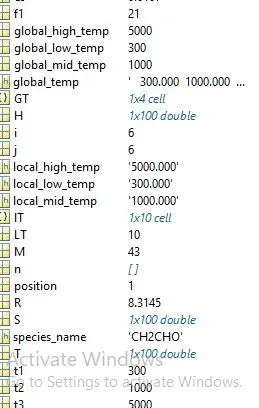
Screenshot of the workspace:
ERRORS:
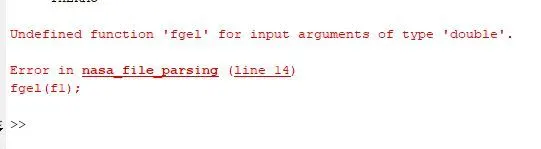
instead of fgetl i typed fgel by mistake after the error occured i changed into right spelling.

linspace range was stored in 'T' but by mistake i gave 't' so after the error occured i changed it into right T.
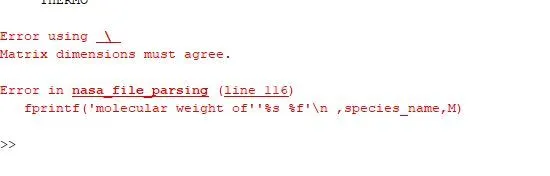
my cotes where not correct once error occured i changed it into right syntax.
REFERENCE:
https://en.wikipedia.org/wiki/Parsing
https://www.engineeringtoolbox.com/oxygen-d_978.html
RESULTS:
The graphs between temperature and Cp, temperature and H and temperature and S are succesfully plotted and the molecular weight of each species is also found.