Project 1 - Parsing NASA thermodynamic data
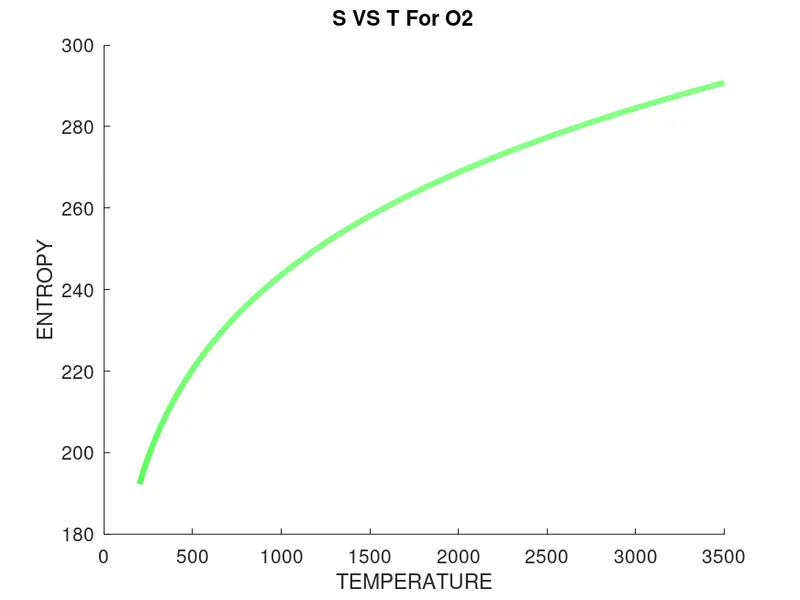
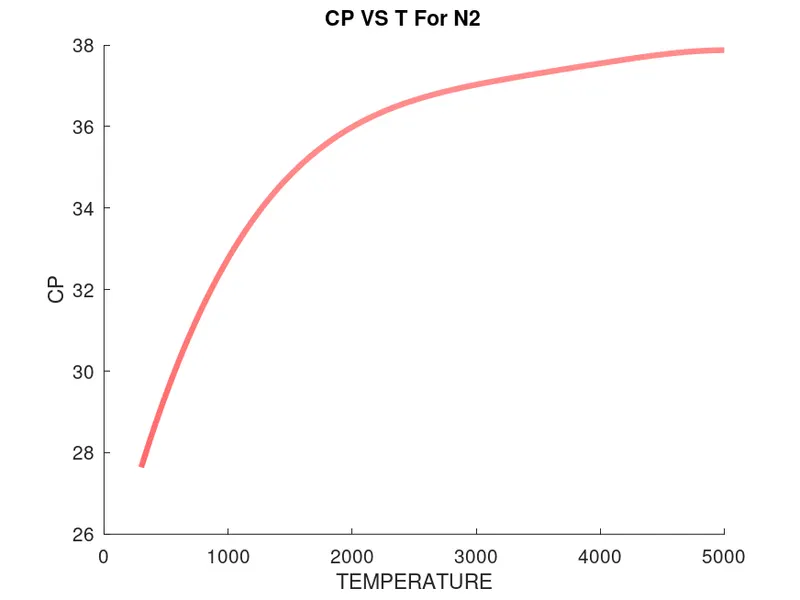
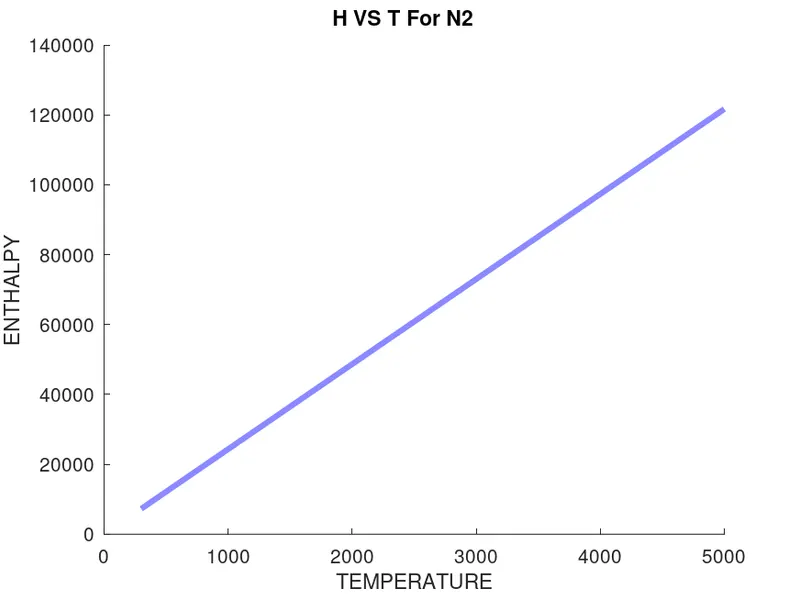
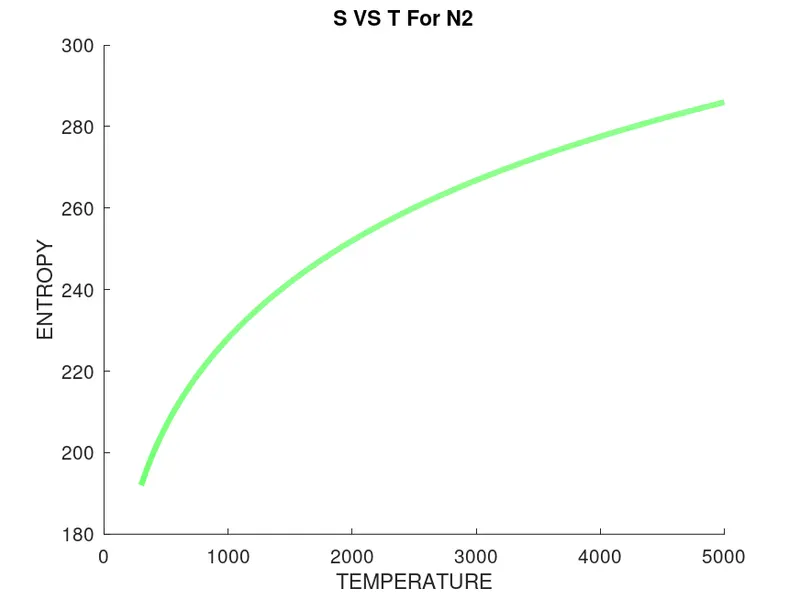
AIM: To Parse NASA thermodynamic data and plot the Specific Heat, Entropy, Enthalpy vs temperature in a given species range.
Introduction:
The meaning of parsing data from a file is to convert a string of data into a readable data format. So for reading a thermo.dat file, in this case, will mean converting the lines of strings into readable data and using temperature and coefficients to calculate entropy enthalpy and specific heat for each element.
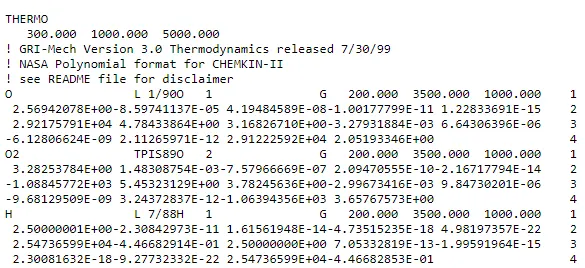
In the above example line - 1 is 'THERMO' so we read that line as a string. Then, Line - 2 is ' 300.000 1000.000 5000.000' which is actually a collection of temperature but to a text file is a string of data. To break this into individual data/temperature a common character for all three temperatures is taken which in this case is '.' so in every temperature '.' is common and unique by using strfind() command in Matlab location of each '.' is stored in a variable then by using str2num and selecting the appropriate range for the address of each character with respect to the location of '.' the string is converted to a number and then it can be used to calculate anything one needs.
To plot the Specific Heat, Entropy, Enthalpy vs temperature for each element in the NASA data file. following formulas are to be used:-

where,
Cp=Specific heat
H= Enthalpy
S= Entropy
R= Universal gas constant
T= Temperature of species
a1,a2,a3,a4,a5,a6,a7 = Coefficients to be read from NASA Thermodynamic data file.
In the given data it is mentioned that the first 7 coefficients are for low to mid-temperature of the given species and the next 7 coefficients are for mid to high temperature for the species.
Functions Used:
1. mol_func(): To calculate the molecular weight of each element.
function [mef]=mol_func(compound)
  s=compound;
  %common elements in the thermo.dat
  element=['O' 'C' 'H' 'N' 'S' 'A'];
  %constant values
  at_weight = [ 15.999 1.008 12.106 14.007 32.06 39.95];
  mw = 0;

   for i=1:length(s)
     for j=1:length(element)
       if strcmp(s(i),element(j))
         mw=mw+at_weight(j);
         x=j;%location of matched element
       end
     end
     %calculating the multiplication factor of elements after a element name
     l=str2num(s(i));
     if l>1
       mw=mw+(at_weight(x)*(l-1));
     end
   end
  mef=mw;
end
2. CP_High(): To calculate the specific heat for each temperature range of each element.
function [CP,T]=CP_High(a1,a2,a3,a4,a5,a8,a9,a10,a11,a12,lowtemp1,midtemp1,hightemp1,species,R,ct)
  %temperture is taken into range of low to high
  T=lowtemp1:hightemp1;
  %if else for temperature below and above midtemp of given species and formula for each of them.
  if T>midtemp1
    CP=(a8+(a9.*T)+(a10.*T.^2)+(a11.*T.^3)+(a12.*T.^4))*R;
  else
    CP=(a1+(a2.*T)+(a3.*T.^2)+(a4.*T.^3)+(a5.*T.^4))*R;
  end

end
3. S_High(): To calculate the Entropy for each temperature range of each element.
function [S]=S_High(a1,a2,a3,a4,a5,a7,a8,a9,a10,a11,a12,a14,lowtemp1,midtemp1,hightemp1,species,R,xt)
  %temperture is taken into range of low to high
  T=lowtemp1:hightemp1;
  %if else for temperature below and above midtemp of given species and formula for each of them.
  if T>midtemp1
    S=(a8.*ln(T)+(a9.*T)+(a10.*(T.^2)./2)+((a11.*T.^3)./3)+((a12.*T.^4)./4)+a14)*R;
  else
    S=(a1.*log(T)+(a2.*T)+(a3.*(T.^2)./2)+((a4.*T.^3)./3)+((a5.*T.^4)./4)+a7)*R;
  end

end
4. H_High(): To calculate the Enthalpy for each temperature range of each element.
function [H]=H_High(a1,a2,a3,a4,a5,a6,a8,a9,a10,a11,a12,a13,lowtemp1,midtemp1,hightemp1,species,R,zt)
  %temperture is taken into range of low to high
  T=lowtemp1:hightemp1;
  %if else for temperature below and above midtemp of given species and formula for each of them.
  if T>midtemp1
    H=(a8.*T+(a9.*T./2)+(a10.*(T.^2)./3)+((a11.*T.^3)./4)+((a12.*T.^4)./5)+a13./T)*R;
  else
    H=(a1.*T+(a2.*T./2)+(a3.*(T.^2)./3)+((a4.*T.^3)./4)+((a5.*T.^4)./5)+a6./T)*R;
  end

end
Main Program:
close all
clear all
clc

R=8.3144;
%to open the file Thermo.dat
f1=fopen('THERMO.DAT','r')

% to skip the first 5 lines
for i=1:5
  tline=fgetl(f1);

end
%counters for calling each figure uniquely
ct=1;
xt=53;
zt=106;

EN='END'

% To read the data and parse each temp , coefficient , species name
for i=1:212

  tline2=fgetl(f1);

  % to check if we are in the species line
  if tline2(45)=='G'
    %'.' gives the address of the temperature to be extracted
    z=strfind(tline2,'.');
    %calls a mol_func() to calculate molecular weight of the species
    ELEMENT=char(tline2(1:6))%shows the species name
    molecular_weight=mol_func(ELEMENT)
    for j=1:1
      %finds the low high and mid temperature of each element
      lowtemp1=str2num(tline2(z(j)-4:z(j)));
      hightemp1=str2num(tline2(z(j+1)-4:z(j+1)));
      midtemp1=str2num(tline2(z(j+2)-4:z(j+2)));
    end
    %increments the counter
    ct=ct+1;
    xt=xt+1;
    zt=zt+1;

    % To find coefficients "E" gives the location of a common letter in each coefficient
    %stores the location of 'E' and converts the range of data to numerical
  else

    v=strfind(tline2,'E');
    a1=str2num(tline2(1:v(1)+3));
    a2=str2num(tline2(v(1)+4:v(2)+3));
    a3=str2num(tline2(v(2)+4:v(3)+3));
    a4=str2num(tline2(v(3)+4:v(4)+3));
    a5=str2num(tline2(v(4)+4:v(5)+3));
    tline4=fgetl(f1);
    v=strfind(tline4,'E');
    a6=str2num(tline4(1:v(1)+3));
    a7=str2num(tline4(v(1)+4:v(2)+3));
    a8=str2num(tline4(v(2)+4:v(3)+3));
    a9=str2num(tline4(v(3)+4:v(4)+3));
    a10=str2num(tline4(v(4)+4:v(5)+3));
    tline5=fgetl(f1);
    v=strfind(tline5,'E');
    a11=str2num(tline5(1:v(1)+3));
    a12=str2num(tline5(v(1)+4:v(2)+3));
    a13=str2num(tline5(v(2)+4:v(3)+3));
    a14=str2num(tline5(v(3)+4:v(4)+3));
    % calling functions CP_High,S_High,H_High to calculate cp H and S and return a range of values.
    [CP,T]=CP_High(a1,a2,a3,a4,a5,a8,a9,a10,a11,a12,lowtemp1,midtemp1,hightemp1,ELEMENT,R,ct-1);
    S=S_High(a1,a2,a3,a4,a5,a7,a8,a9,a10,a11,a12,a14,lowtemp1,midtemp1,hightemp1,ELEMENT,R,xt-1);
    H=H_High(a1,a2,a3,a4,a5,a6,a8,a9,a10,a11,a12,a13,lowtemp1,midtemp1,hightemp1,ELEMENT,R,zt-1);

    % creates a new folder of name of species and saves CP, H, S vs T plots separately
    mkdir(ELEMENT)
    cd(ELEMENT)
    %PLot for T Vs CP
    figure(ct)
    hold on
    plot(T,CP,'linewidth',3,'color','r')
    title(sprintf('CP VS T For %s',ELEMENT))
    xlabel('TEMPERATURE')
    ylabel('CP')
    file_text=sprintf('CP.png');
    saveas (gca, file_text);

    %PLot for T Vs S
    figure(xt)
    hold on
    plot(T,S,'linewidth',3,'color','g')
    title(sprintf('S VS T For %s',ELEMENT))
    xlabel('TEMPERATURE')
    ylabel('ENTROPY')
    file_text=sprintf('S.png');
    saveas (gca, file_text);

    %PLot for T Vs H
    figure(zt)
    hold on
    plot(T,H,'linewidth',3,'color','b')
    title(sprintf('H VS T For %s',ELEMENT))
    xlabel('TEMPERATURE')
    ylabel('ENTHALPY')
    file_text=sprintf('H.png');
    saveas (gca, file_text);
    cd ..   %to go back to main directory
    disp('=========================================')

  end
  if strcmp(tline2,EN)
    break
  end

end
OUTPUT:
Part1: Making directory of each species name separately

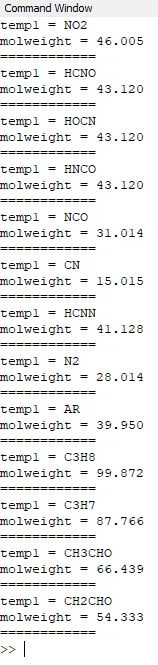
Part 2: Molecular weight of each element with element name:


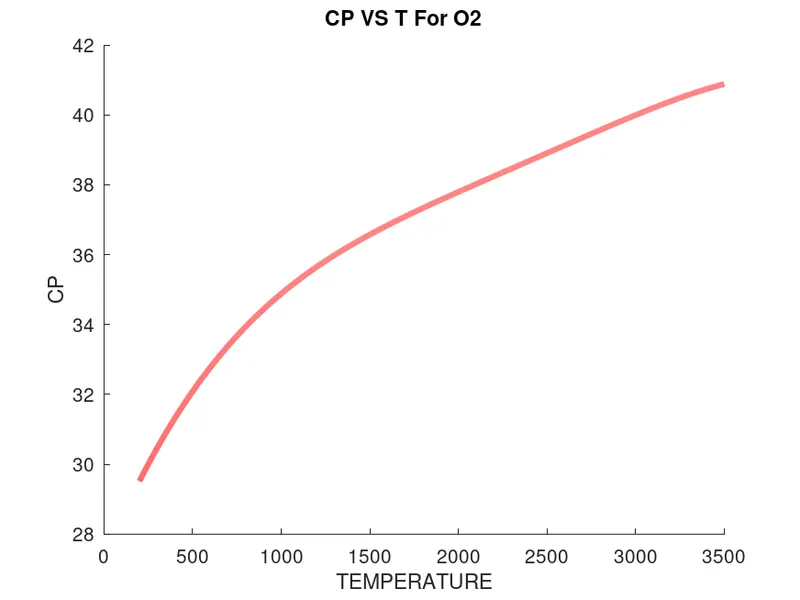
Part 3: PLOT for O2 (CP vs T, H vs T, S Vs T)
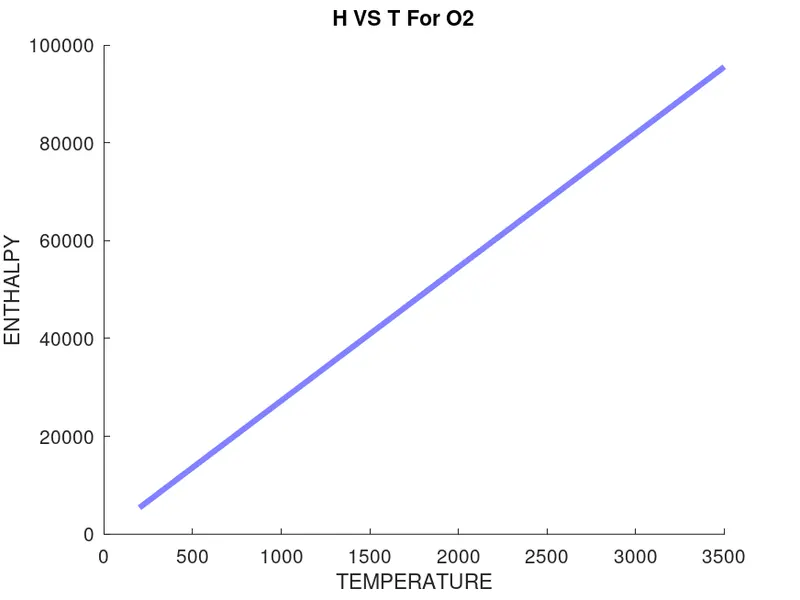
Part 4: PLOT for N2 (CP vs T, H vs T, S Vs T)
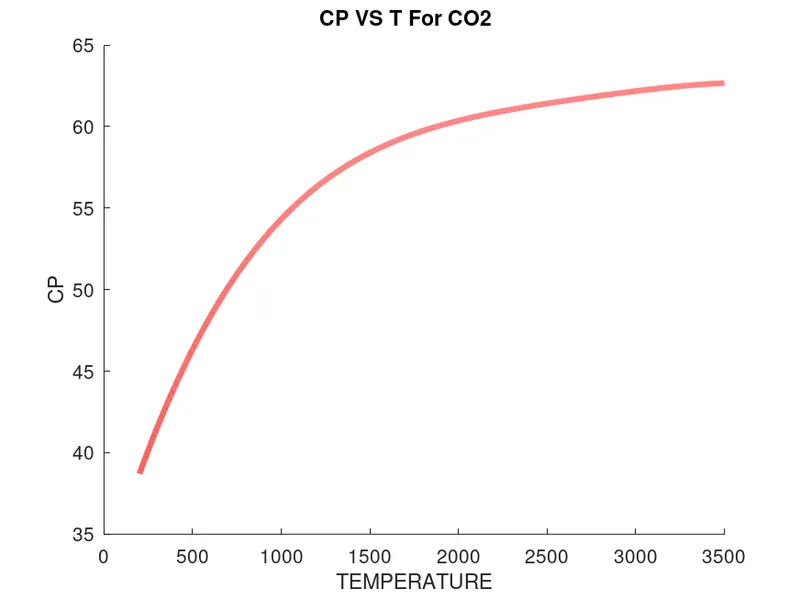
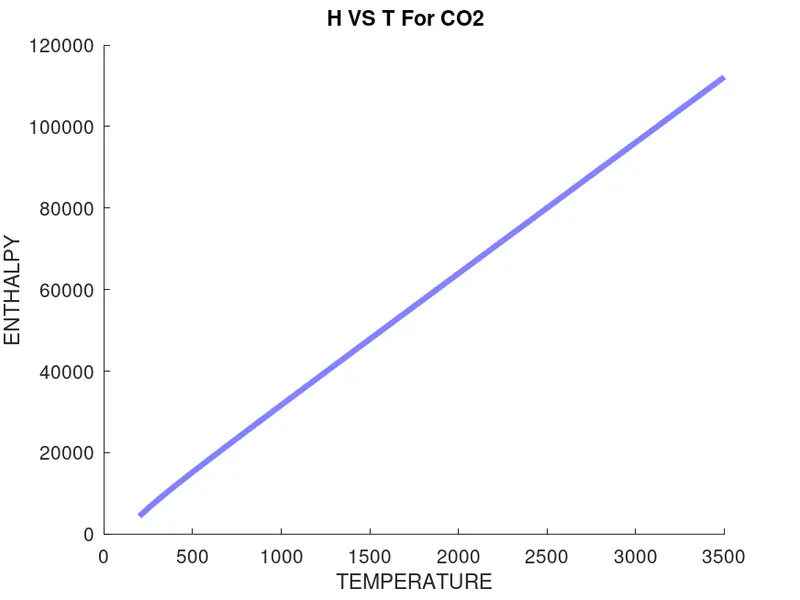
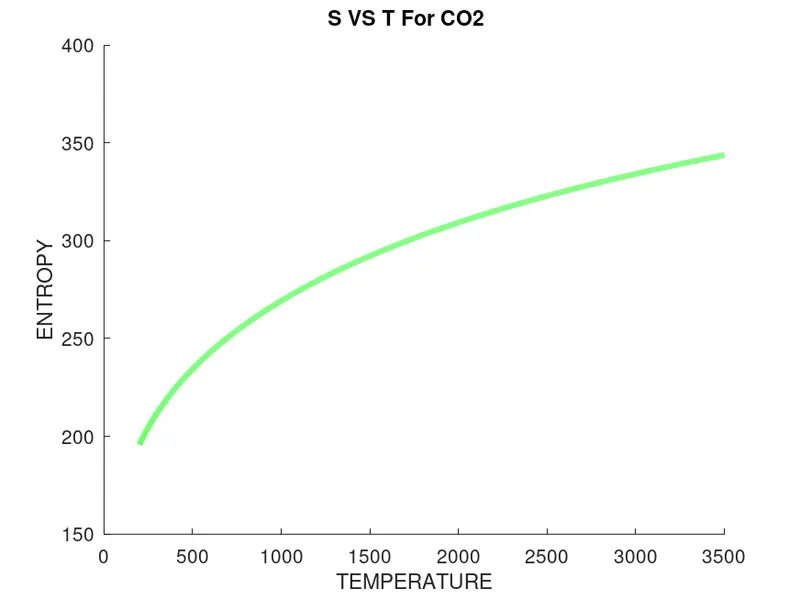
Part 5: PLOT for CO2 (CP vs T, H vs T, S Vs T)
Result:
- Calculated molecular weight of a species from NASA Thermo file.
- Successfully extracted species name, temperatures, coefficients for each of the elements.
Conclusion:
- Understanding the basic concept behind file parsing helps in creating variables to run a calculation for plotting Cp, H, S graphs. for different species.
- Achieved a modular form of reading a file and parsing them into parts of variables understandable by Matlab/octave and calculate the required parameters.