Project 1 - Parsing NASA thermodynamic data
AIM: To develop a code to parse the NASA thermodynamic data file
OBJECTIVES:
- To write a code to extract the data from the file(THERMO.dat)
- Plotting the specific heat, enthalpy and entropy graphs for selected gas species
- Calculating the molecular weight of the species
Parsing a file
Parsing a file means reading in a data stream and building a memory model of the content of that data. Parsing a file splits the file or other input data into pieces of data that can be easily stored or manipulated.
File selected:
NASA Thermodynamic data file. The file contains coefficients required to evaluate polynomials that can be used to evaluate thermodynamic properties such as Specific heat(cp), Enthalpy (h) and Entropy (s).
Formulae used
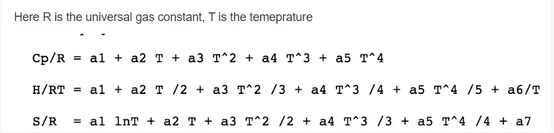
First 7 coefficients are high temperature coefficients and second 7 co-efficients are low temperature coefficients.
MATLAB CODE
Main Code to extract the data and plot the graph
clear all
close all
clc

%Reading the data from the file
thermo=fopen('THERMO.dat','r');
fgetl(thermo);
tempdat=fgetl(thermo);
A=strsplit(tempdat,' ');

%extracting the global temperature range
LowGt=str2double(A{2});
MidGt=str2double(A{3});
HighGt=str2double(A{4});

%defining variable to store the input from end-user
get=input('Enter Species Name','s')
while ~feof(thermo)
    data=fgetl(thermo)
    a=strsplit(data,' ');
    b=a(1);
    %comparing input and data of molecule
    match=strcmpi(b,get);
    if match==1
        disp('species data available')
        %Extracting coefficients of desired molecule
        Line1=fgetl(thermo);
        SL1=strfind(Line1,'E');
        coef1=Line1(1:SL1(1)+3);
        coef2=Line1(SL1(1)+4:SL1(2)+3);
        coef3=Line1(SL1(2)+4:SL1(3)+3);
        coef4=Line1(SL1(3)+4:SL1(4)+3);
        coef5=Line1(SL1(4)+4:SL1(5)+3);
        a1=str2double(coef1);
        a2=str2double(coef2);
        a3=str2double(coef3);
        a4=str2double(coef4);
        a5=str2double(coef5);
        Line2=fgetl(thermo);
        SL2=strfind(Line2,'E');
        coef6=Line2(1:SL2(1)+3);
        coef7=Line2(SL2(1)+4:SL2(2)+3);
        coef8=Line2(SL2(2)+4:SL2(3)+3);
        coef9=Line2(SL2(3)+4:SL2(4)+3);
        coef10=Line2(SL2(4)+4:SL2(5)+3)
        a6=str2double(coef6);
        a7=str2double(coef7);
        a8=str2double(coef8);
        a9=str2double(coef9);
        a10=str2double(coef10);
        Line3=fgetl(thermo);
        SL3=strfind(Line3,'E');
        coef11=Line3(1:SL3(1)+3);
        coef12=Line3(SL3(1)+4:SL3(2)+3);
        coef13=Line3(SL3(2)+4:SL3(3)+3);
        coef14=Line3(SL3(3)+4:SL3(4)+3);
        a11=str2double(coef11);
        a12=str2double(coef12);
        a13=str2double(coef13);
        a14=str2double(coef14);
        %Extracting the local temperature range of the input molecule
        mlt=a(end-1);
        midlt=str2double(mlt);
        hlt=a(end-2);
        highlt=str2double(hlt);
        llt=a(end-3);
        lowlt=str2double(llt);
        break
    elseif match==0
        disp('Species data not available')
    else
        continue
    end
end
f=upper(get);
%Displaying molecula weight of the input molecule
moleweight=MW(get);
disp('molecule entered')
disp(f)
disp('molecular weight')
disp(moleweight)

TRange=linspace(100,10000,9000);
R=8.314;

%obtaining the value of specific heat
cp=specific_heat(a1,a2,a3,a4,a5,a8,a9,a10,a11,a12,midlt,TRange,R);

%obtaining the value of entropy
s=entropy(a1,a2,a3,a4,a5,a7,a8,a9,a10,a11,a12,a14,midlt,TRange,R);

%obtaining the value of enthalpy
h=enthalpy(a1,a2,a3,a4,a5,a6,a8,a9,a10,a11,a12,a13,midlt,TRange,R);

%creating directory to store plots
mkdir(f)
%plotting cp v T
figure(1)
plot(TRange,cp,'linewidth',3,'color','r')
grid on
xlabel('Temperature')
ylabel('Specific heat (J/K)')
title(f)
%plotting s v T
figure(2)
plot(TRange,s,'linewidth',3,'color','b')
grid on
xlabel('Temperature')
ylabel('Entropy (J/K)')
title(f)
%plotting h v T
figure(3)
plot(TRange,h,'linewidth',3,'color','g')
grid on
xlabel('Temperature')
ylabel('Enthalpy (J/Kg)')
title(f)

%defining the current folder
cd(f)

%saving the images to current folde in specified formats
saveas(figure(1),'cp vs T.jpg')
saveas(figure(2),'s vs T.jpg')
saveas(figure(3),'h vs T.jpg')

%defining current folder back as parent folder
cd('E:')

%closing the open files
fclose('all')
Code Explanation
- The given data file is read with the help of ‘fopen’ command.
- fgetl command is used to extract global temperature ranges.
- Input from the user is stored as a string which is then compared with the molecule available using strcmp command.
- If match is obtained respective coefficients are extracted from the data file
- To get molecular weight and to plot thermodynamic property graphs respective functions are called.
- mkdir command is used to store the graphs
Code to get Molecular weight function
%Function for Molecular weight
function Mol_weight=MW(get)
weight=0;
%input as molecule name
%atoms dealt are H C N O Ar
%atomic mass 1 12 14 16 40 respectively
%to find molecular weight we have to compare the atoms from input
atoms=['H','C','N','O','A'];
mass=[1,12,14,16,40];
%we have to compare each characters for mass using 2 for loops
for i=1:length(get)
    for j=1:length(atoms)
    if strcmpi(get(i),atoms(j))
        weight=weight+mass(j);
        y=j;
    end
    end
    %for more number of same atoms in the molecule
    number=str2num(get(i));
    if (number>1)
        %for c2 we have to add mass of c 2 times
        %initially since for c, mass is added to mol_weight
        %for extra molecule we use (number-1) so adding one more weight
        weight=weight+(mass(y)*(number-1));
    end
end
Mol_weight=weight
end
Matlab code to get enthlpy function
%Function for enthalpy
function h_val=enthalpy(a1,a2,a3,a4,a5,a6,a8,a9,a10,a11,a12,a13,midlt,TRange,R)
if(TRange>midlt)
    h_val=(a1+((a2.*TRange)./2)+((a3.*(TRange.^2))./3)+((a4.*(TRange.^3))./4)+((a5.*(TRange.^4))./5)+(a6./TRange)).*(R.*TRange);
else
    h_val=(a8+((a9.*TRange)./2)+((a10.*(TRange.^2))./3)+((a11.*(TRange.^3))./4)+((a12.*(TRange.^4))./5)+(a13./TRange)).*(R.*TRange);
end
end
Matlab code to get entropy function
%function for entropy
function s_val=entropy(a1,a2,a3,a4,a5,a7,a8,a9,a10,a11,a12,a14,midlt,TRange,R)
if (TRange>midlt)
    s_val=((a1*log(TRange))+(a2*TRange)+((a3*(TRange.^2))/2)+((a4*(TRange.^3))/3)+((a5*(TRange.^4))/4)+(a7))*R;
else
    s_val=((a8*log(TRange))+(a9*TRange)+((a10*(TRange.^2))/2)+((a11*(TRange.^3))/3)+((a12*(TRange.^4))/4)+(a14)).*R;
end
end
Matlab code to get specific heat function
%Function for specific heat
Function cp_val=specific_heat(a1,a2,a3,a4,a5,a8,a9,a10,a11,a12,midlt,TRange,R)
if(TRange>midlt)
    cp_val=(a1+(a2*TRange)+(a3*(TRange.^2))+(a4*(TRange.^3))+(a5*(TRange.^4)))*R;
else
    cp_val=(a8+(a9*TRange)+(a10*(TRange.^2))+(a11*(TRange.^3))+(a12*(TRange.^4)))*R
end
end
OUTPUT PLOTS
Enthalpy plot for 02
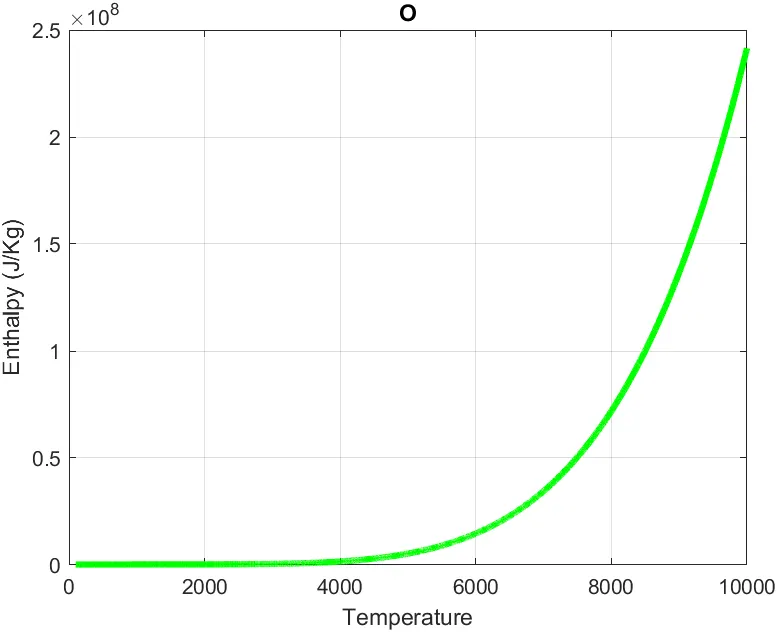
Entropy plot for O2
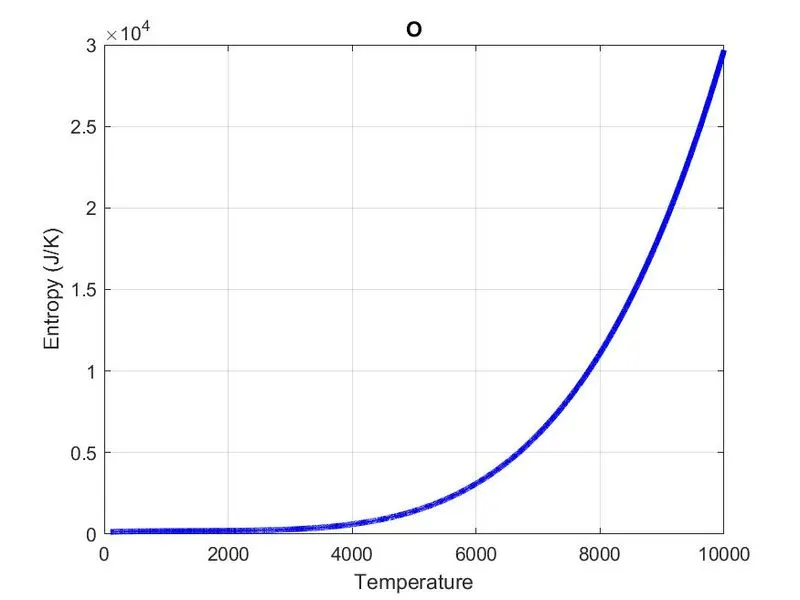
Specific heat plot for O2
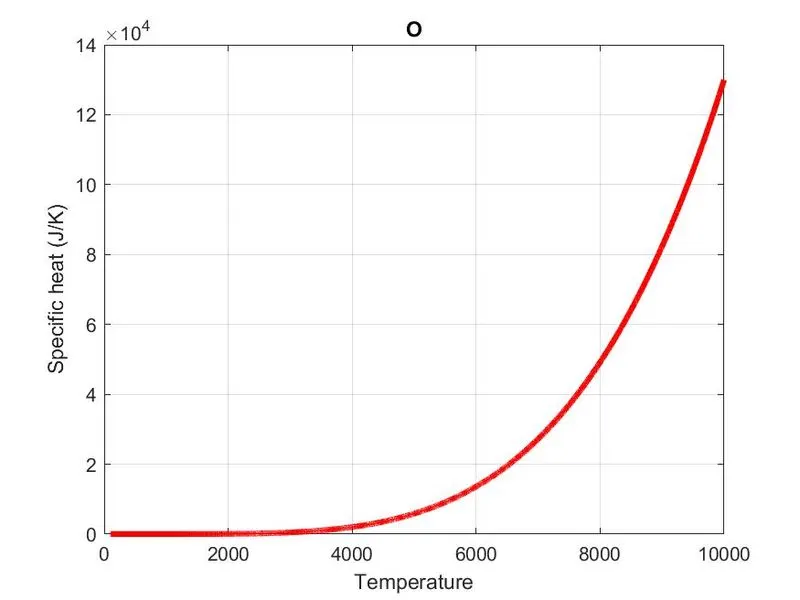
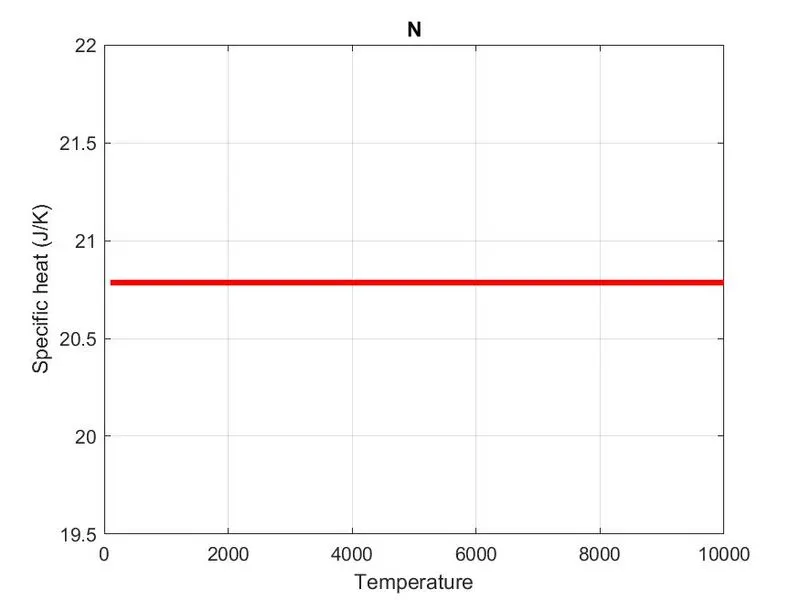
Enthalpy plot for N2
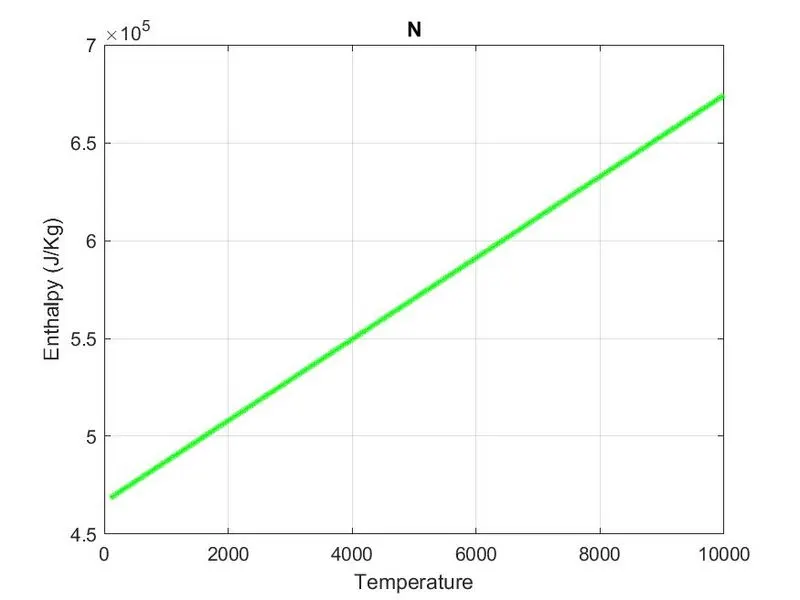
Entropy plot for N2
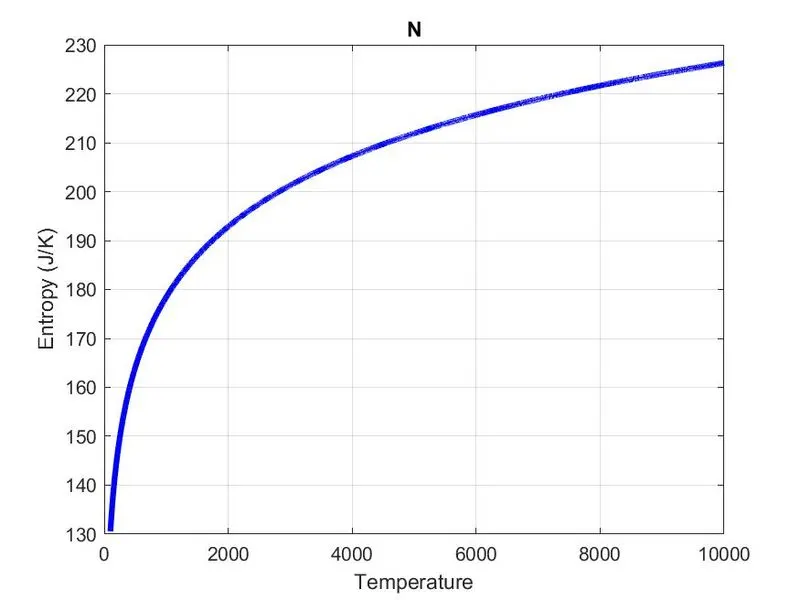
Specific heat plot for N2