Project 1 - Parsing NASA thermodynamic data
AIM :-
To parse the NASA thermodynamic data to calculate the specific heat, entropy, enthalpy and molecular weight using MATLAB.
OBJECTIVE :-
- To parse the data file of the co-efficients of different species.
- To calculate the specific heat, entropy, enthalpy and molecular weights of the species.
- To plot the specific heat, entropy and enthalpy for the local temperature of each species.
THEORY :-
Parsing is the process of analysing a string of symbols in computer language or data structure conforming to the rules of formal grammar. Parsing is used to read information from any file type and to break the data down in a systematic way. To parse is to break up a sentence or group of words into separate components, including the definition of each part's function or form. The technical definition implies the same concept.
Thermodynamic properties,
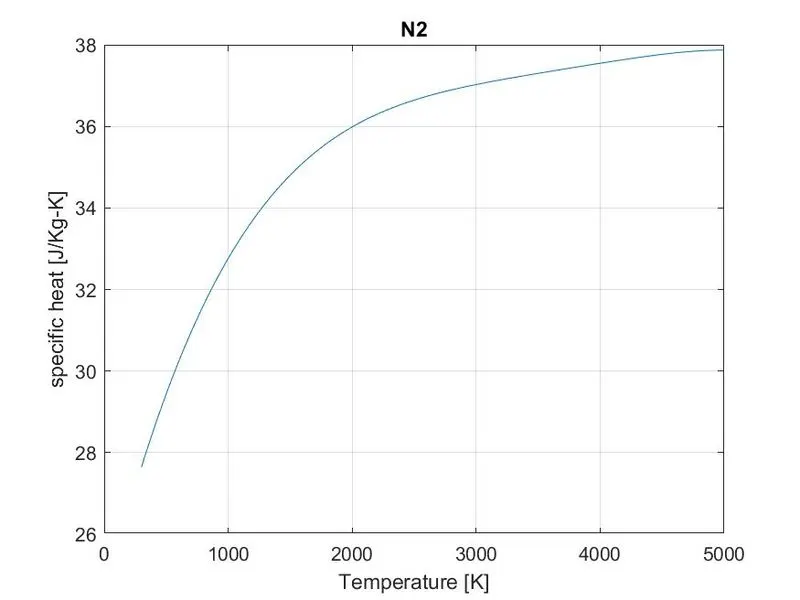
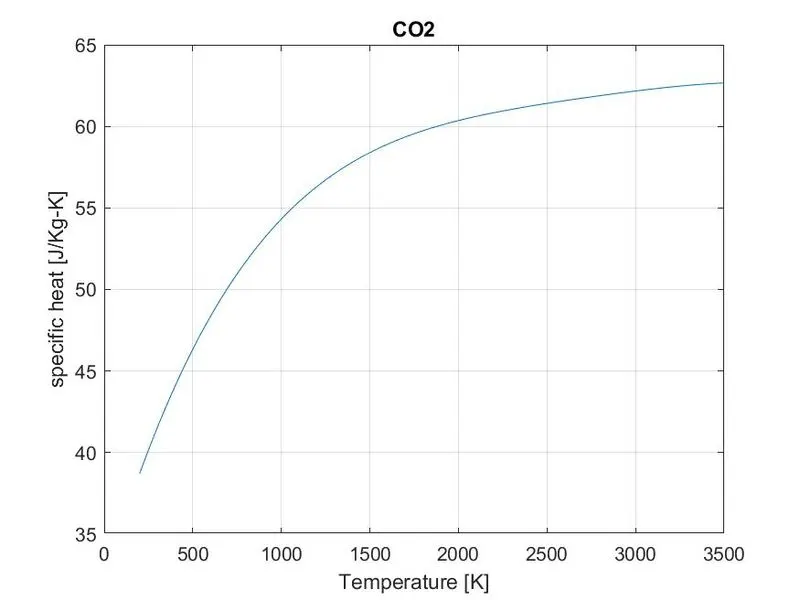
Specific Heat: It is the quantity of heat per unit mass required to temparature of a body by one degree celcius. It is denoted as Joules/Kilogram-Kelvin (J/Kg-K).
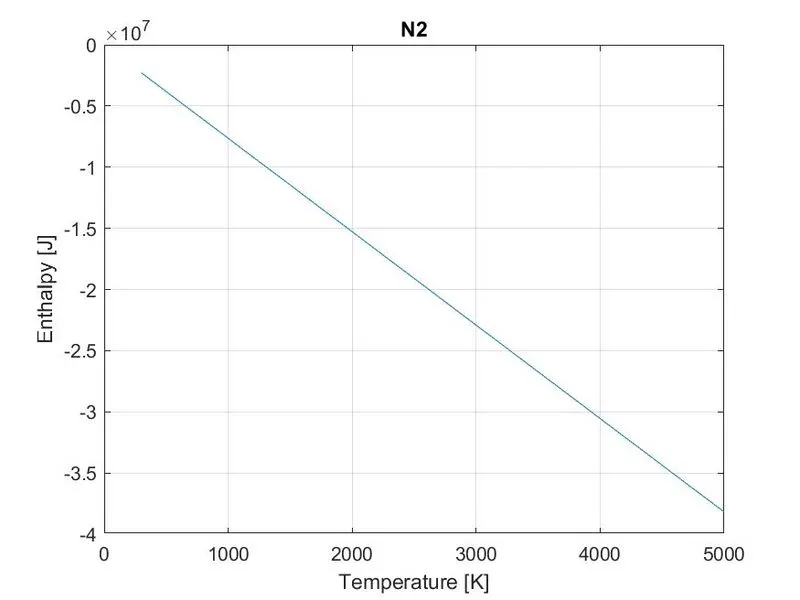
Enthalpy: Enthalpy is the sum of the internal energy and the product of pressure and volume in a thermodynamic system. It is denoted as Joules (J).
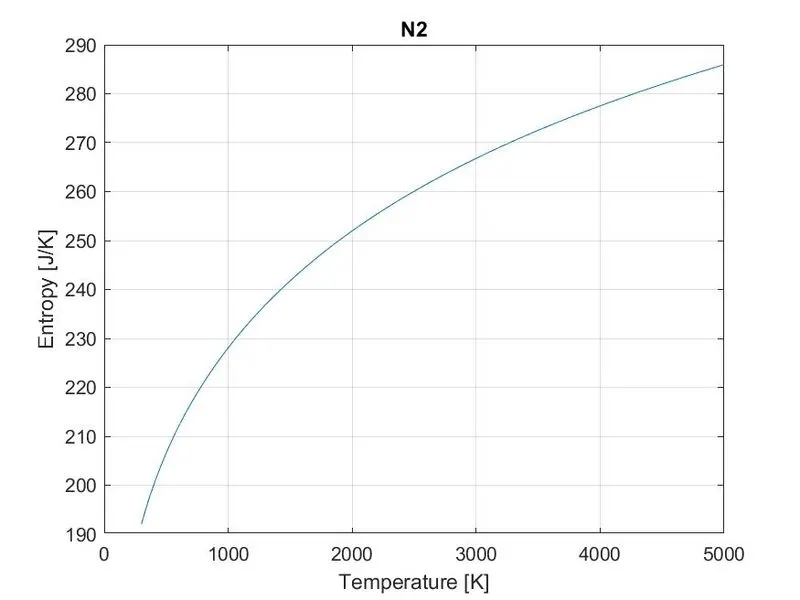
Entropy: It is the measure of a system's thermal energy per unit temperature that is unavailable for doing useful work. It is denoted as Joules/Kelvin (J/K).
Molecular weight: It is the sum off the atomic masses of all the atoms in a molecule.
FORMULA :-
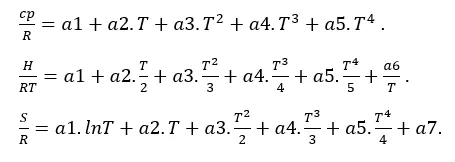
Where,
cp = specific heat in (J/K-Kg).
H = enthalpy (J).
S = entropy (J/K).
R = gas constant = 8.314.
T = local temperature ranges in (K).
a1 to a7 = co-efficients at local temperature range.
PROGRAM :-
% NASA file parsing
clear all
close all
clc

% Reading the file
f1 = fopen('THERMO.dat','r');

% Reading the header information
fgetl(f1);

% To read the global temperatures
A = fgetl(f1);
temp = strsplit(A,' ');

% Converting the string to a number
global_low_temp = str2num(temp{2});
global_mid_temp = str2num(temp{3});
global_high_temp = str2num(temp{4});

% To skip the next lines in the header
for i = 1:3
    skiplines = fgetl(f1);
end

% To read the first line which contains the species
for j = 1:53
    tline1 = fgetl(f1);
    x = strsplit(tline1,' ');
    species = (x{1});
    y = length(x);

    % To obtain the local temperatures
    local_low_temp = str2double(x{y-3});
    local_mid_temp = str2double(x{y-1});
    local_high_temp = str2double(x{y-2});

    % To read the coefficients in the second line
    tline2 = fgetl(f1);
    a = strfind(tline2,'E');
    a1 = str2double(tline2(1:a(1)+3));
    a2 = str2double(tline2(a(1)+4:a(2)+3));
    a3 = str2double(tline2(a(2)+4:a(3)+3));
    a4 = str2double(tline2(a(3)+4:a(4)+3));
    a5 = str2double(tline2(a(4)+4:a(5)+3));

    % To read the coefficients in the third line
    tline3 = fgetl(f1);
    b = strfind(tline3,'E');
    a6 = str2double(tline3(1:b(1)+3));
    a7 = str2double(tline3(b(1)+4:b(2)+3));
    a8 = str2double(tline3(b(2)+4:b(3)+3));
    a9 = str2double(tline3(b(3)+4:b(4)+3));
    a10 = str2double(tline3(b(4)+4:b(5)+3));

    % TO read the coefficients in the fourth line
    tline4 = fgetl(f1);
    c = strfind(tline4,'E');
    a11 = str2double(tline4(1:c(1)+3));
    a12 = str2double(tline4(c(1)+4:c(2)+3));
    a13 = str2double(tline4(c(2)+4:c(3)+3));
    a14 = str2double(tline4(c(3)+4:c(4)+3));

    % Inputs to calculate the thermodynamic properties
    T = linspace(local_low_temp,local_high_temp,1000);
    R = 8.314;

    % Calculating the specific heat, enthalpy and entropy
    for k = 1:length(T)
        if T(k)>local_mid_temp
            cp = (a1+(a2.*T)+(a3.*T.^2)+(a4.*T.^3)+(a5.*T.^4)).*R;
            H = (a1+(a2.*T/2)+(a3.*(T.^2)/3)+(a4.*(T.^3)/4)+(a5.*(T.^4)/5)+a6).*(R.*T);
            S = (a1.*log(T)+(a2.*T)+(a3.*(T.^2)/2)+(a4.*(T.^3)/3)+(a5.*(T.^4)/4)+a7).*R;
        else
            cp = (a8+(a9.*T)+(a10.*T.^2)+(a11.*T.^3)+(a12.*T.^4)).*R;
            H = (a8+(a9.*T/2)+(a10.*(T.^2)/3)+(a11.*(T.^3)/4)+(a12.*(T.^4)/5)+a13).*(R.*T);
            S = (a8.*log(T)+(a9.*T)+(a10.*(T.^2)/2)+(a11.*(T.^3)/3)+(a12.*(T.^4)/4)+a14).*R;
        end
    end

    % To create a folder containing the species calculations
      mkdir(['C:\Users\Sahil Devaiah\Documents\MATLAB\File Parsing\',species]);


    % Plotting the graphs
    figure(1);
    plot(T,cp);
    grid on
    xlabel('Temperature [K]');
    ylabel('specific heat [J/Kg-K]');
    title(species);

    figure(2);
    plot(T,H);
    grid on
    xlabel('Temperature [K]');
    ylabel('Enthalpy [J]');
    title(species);

    figure(3);
    plot(T,S);
    grid on
    xlabel('Temperature [K]');
    ylabel('Entropy [J/K]');
    title(species);

    % Saving the graphs in the new directory
    save_as = (['C:\Users\Sahil Devaiah\Documents\MATLAB\File Parsing\',species]);
    cd(save_as);
    saveas(1,'Specific heat','jpg');
    saveas(2,'Enthalpy','jpg');
    saveas(3,'Entropy','jpg');

    % To calculate the molecular mass
    elements = ['O','N','C','H','A'];
    atomic_weight = [15.999 14.0067 12.0107 1.0079 39.948];
    molar_mass = 0;
    for l = 1:length(species)
        for m = 1:length(elements)
            if strcmp(species(l),elements(m))
                molar_mass = molar_mass+atomic_weight(m);
                z = m;
            end
        end
        n = str2double(species(l));
        if n>1
            molar_mass = molar_mass+atomic_weight(z)*(n-1);
        end
    end

    sprintf('Molecular weight %s %f',species,molar_mass)
end
EXPLANATION OF THE PROGRAM :-
First to open the data file we use the command f1 = fopen('THERMO.dat','r'); .Here the fopen command is used to open the file and it assigned a file ID called f1. THERMO.dat is the file name and r is the file permission which stands for read file.
To read a line we use the fgetl command. This command lets us read the data in the file line by line. We start with reading the header of the data. We read the first line using the fgetl command and assign it an ID A. In order to read the global temperatures in the first line we use the strsplit command which splits the string at specified delimiters. The delimiter used in this program is defined as (' '), to indicate the space between each string.
The strsplit command stores the data of a given line as a cell array. We then convert the temperature values into a number, which is done using the str2num command. But the data in a cell stores it as a string, in order to extract it as a number we specify the cell number enclosed in curly braces for example, globla_low_temp = str2num(temp{2}); where we specify that the global low temperature is located in the 2nd cell or the array.
The next three lines in the header information contain comments, so we use a for loop and specify the number of times the loop must run along with the fgetl command to skip these comments.
To read the species data,
- The data for each species is standard. It contains 4 lines where the first line is the header information with the species name and the local temperature ranges, and the next 3 lines contain the co-efficients to calculate thermodynamic properties.
- Since all 53 species have the same structure, we use a for loop to read all 53 species.
- We use the fgetl command to read the first line and define it as tline1. We then split the contents of the first line using the strsplit command. The cell array of the first line is stored as x. We specify the location of the species name using the curly braces.
- To read the local temperature ranges we first define the length of the cell array. After that we use the command str2double to convert the string value in the cell to a number. We then specify the local temperature ranges location using curly braces.
- To read a line which contains the contain the coefficients, we use the strfind command to locate the letter E which stand for exponent of the co-efficient. This is used to locate and split the co-eficients to better read the data. After we get the location of every E in that particular, we use the str2double to convert each co-efficient into a number.
- Once we read and extract the data of all 14 coe-efficients we then start to calculate the thermodynamic properties.
First we define the temperature ranges as a linear spaced array from the local low temperature to the local high temperature and split evenly into a 1000 values and store it as a variable T. We then define the gas constant R.
To calculate specific heat, enthalpy and entropy we use a for loop to specify the length of T. We then use an if-else loop to say this if the value of T is the greater than the local mid temperature, then the first seven co-efficients are to be used to calculate specific heat, enthalpy and entropy or else if the value of T is less than the local mid temperature then the last seven coefficients must be used for the calculations.
Once the specific heat, enthalpy and entropy are calculated, we stored them in a seperate directory using the mkdir command to create a new directory.
Once the graphs are plotted they are saved in the new directory with the species name and the title of the graph.
To calculate the molecular weight of the elements we first define the mono atomic elements as an array and also define their respective atomic weight. The molar mass is defined as 0. We use for loops to define the length of the species and the elements. We then use the strcmp which is the compare string command to compare the species and the elements.
RESULTS :-
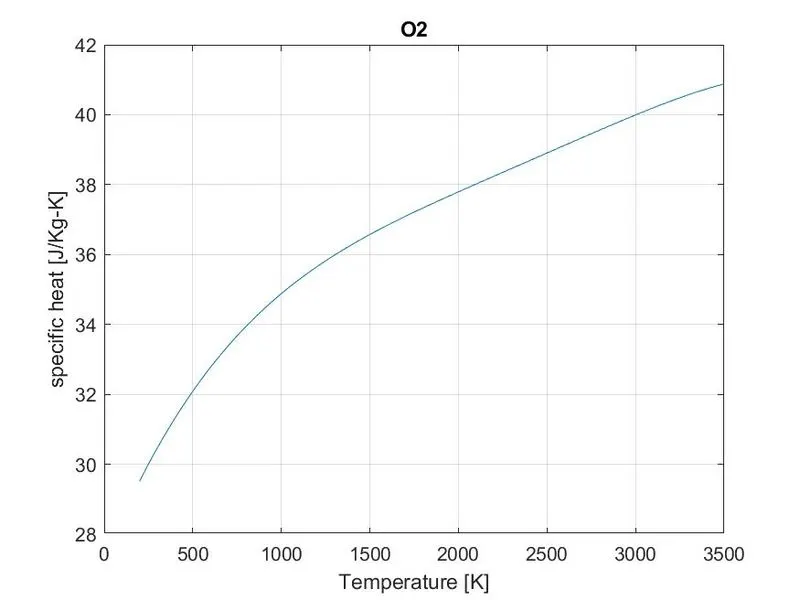
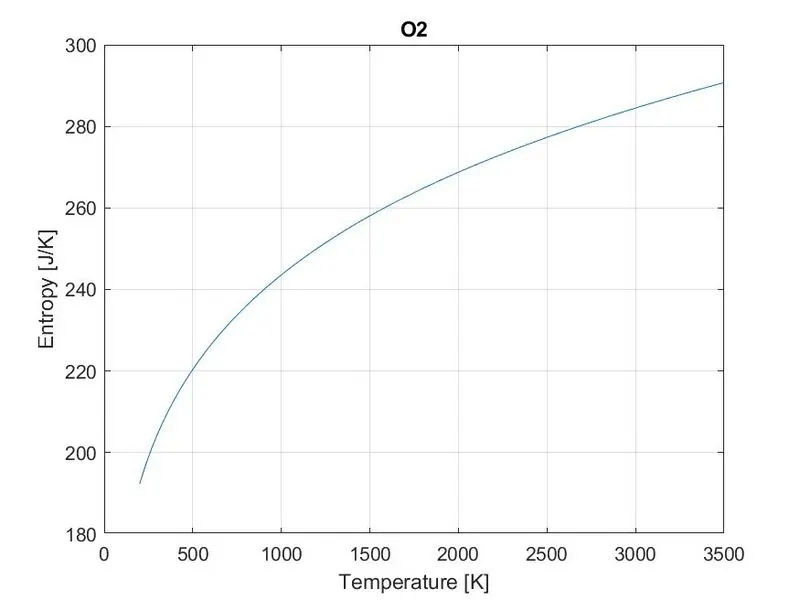
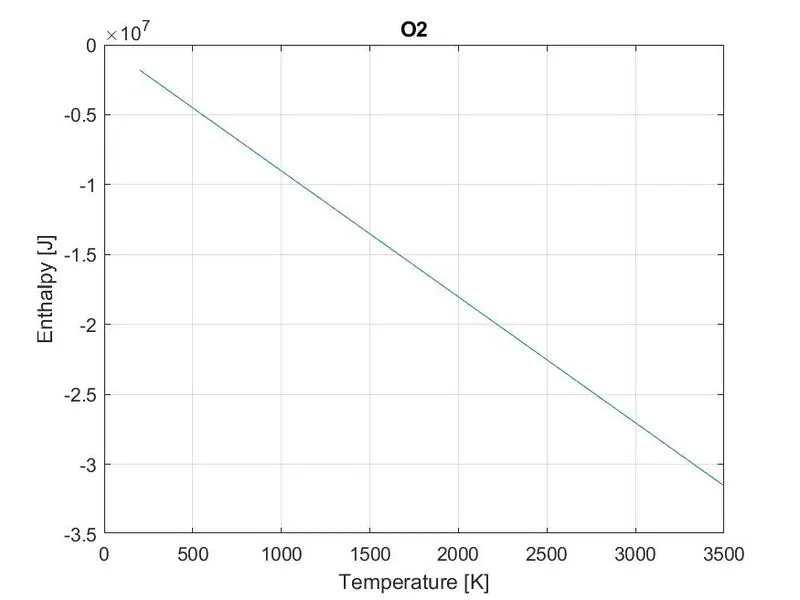
The plots for Oxygen (O2) are given below,
The plots for Nitrogen (N2) are given below,
The plot for Carbon dioxide (CO2) are given below,
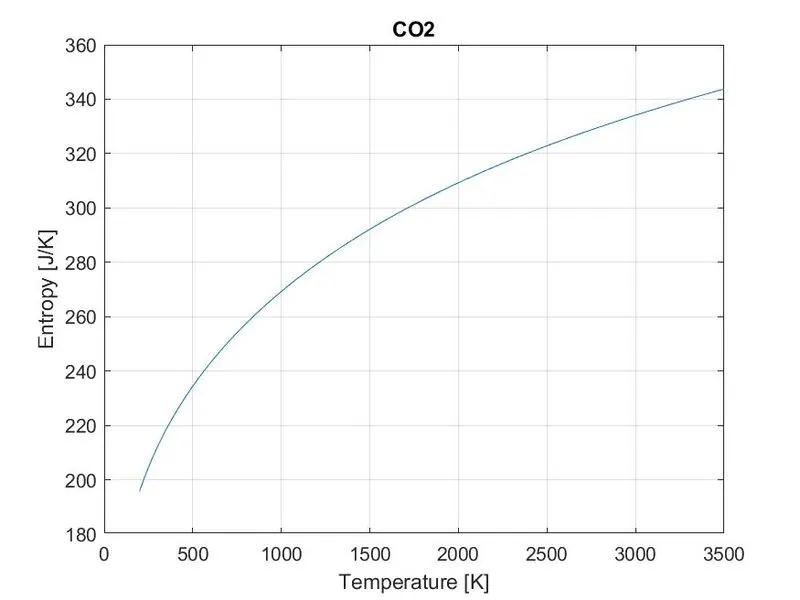
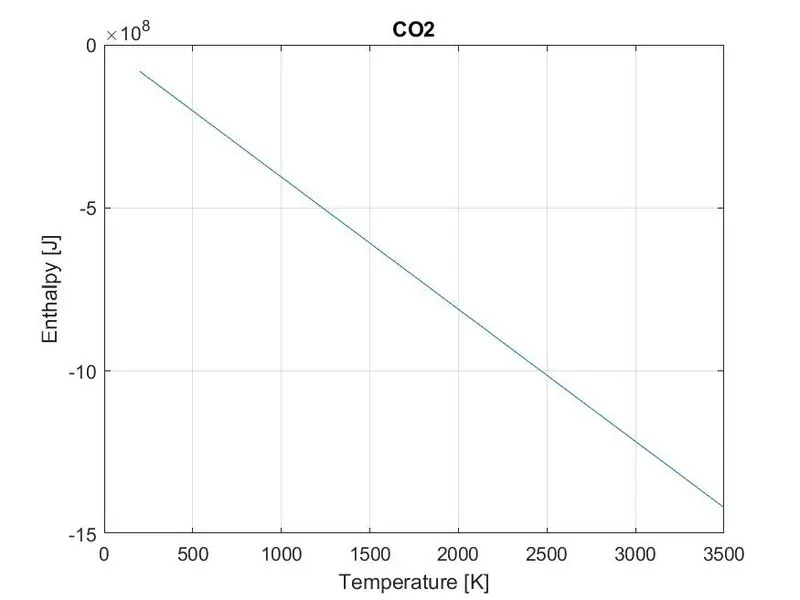
The data of all the species are parsed, their thermodynamic properties are calculated and the graphs are stored in a separate directory as shown below.

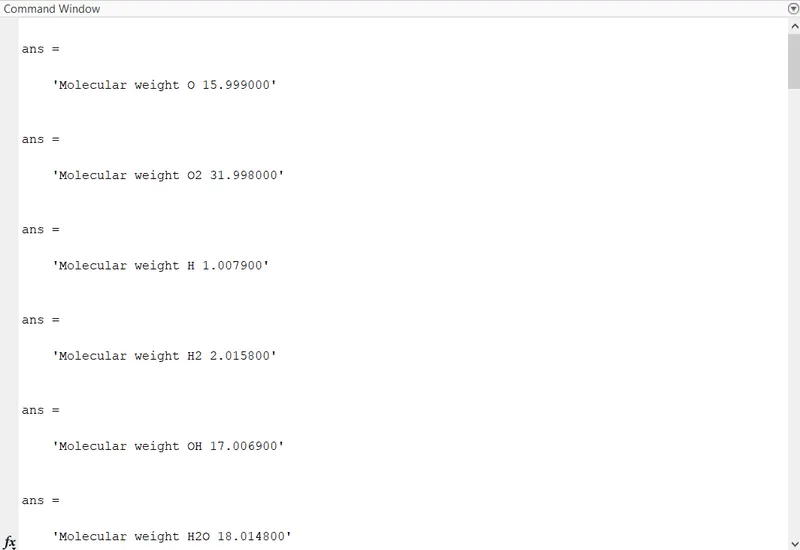
The molecular weights have been calculated,
CONCLUSION :-
- We were able to parse the thermodynamic data and calculate the specific heat, enthalpy and entropy.
- We were able to plot the graphs for the three properties for the species.
- We were able to calculate the molecular weight of the species from the parsed data.