Parsing and calculating NASA Thermodynamic data using MATLAB.
Project1 Report.
- Aim: To write a code that reads the given file and then extracts the necessary data for the calculation and Plotting of the various thermodynamic Properties accordingly.
- Introduction:
Parsing, syntax analysis, or syntactic analysis is the process of analyzing a string of symbols, either in natural language, computer languages or data structures, conforming to the rules of a formal grammar. The term parsing comes from Latin pars (orationis), meaning part (of speech).
The term has slightly different meanings in different branches of linguistics and computer science. Traditional sentence parsing is often performed as a method of understanding the exact meaning of a sentence or word, sometimes with the aid of devices such as sentence diagrams. It usually emphasizes the importance of grammatical divisions such as subject and predicate.
Within computational linguistics the term is used to refer to the formal analysis by a computer of a sentence or other string of words into its constituents, resulting in a parse tree showing their syntactic relation to each other, which may also contain semantic and other information (p-values). Some parsing algorithms may generate a parse forest or list of parse trees for a syntactically ambiguous input.
Types of Parsers: The task of the parser is essentially to determine if and how the input can be derived from the start symbol of the grammar. This can be done in essentially two ways:- Top-down parsing - Top-down parsing can be viewed as an attempt to find left-most derivations of an input-stream by searching for parse trees using a top-down expansion of the given formal grammar rules. Tokens are consumed from left to right. Inclusive choice is used to accommodate ambiguity by expanding all alternative right-hand-sides of grammar rules. This is known as the primordial soup approach. Very similar to sentence diagramming, primordial soup breaks down the constituencies of sentences.
- Bottom-up parsing - A parser can start with the input and attempt to rewrite it to the start symbol. Intuitively, the parser attempts to locate the most basic elements, then the elements containing these, and so on. LR parsers are examples of bottom-up parsers. Another term used for this type of parser is Shift-Reduce parsing.
- Top-down parsing - Top-down parsing can be viewed as an attempt to find left-most derivations of an input-stream by searching for parse trees using a top-down expansion of the given formal grammar rules. Tokens are consumed from left to right. Inclusive choice is used to accommodate ambiguity by expanding all alternative right-hand-sides of grammar rules. This is known as the primordial soup approach. Very similar to sentence diagramming, primordial soup breaks down the constituencies of sentences.
- Code/Logic:
1. We firstly need to clear and close all the previously entered codes and the present values of the already used variables, hence we use the following commands:
clear all
close all
clc
2. We start the logic by opening the given Thermo file. To open this file, we can use the command of fopen. This command will open the Thermo file and then put it into the read format. We then proceed to write a logic that will read the lines in this file. We also, need to calculate the molecular weight of all the species in the file as well.
The syntax for fopen is as follows:
fileID = fopen(filename) fileID = fopen(filename,permission) fileID = fopen(filename,permission,machinefmt,encodingIn) [fileID,errmsg] = fopen(___) fIDs = fopen('all') filename = fopen(fileID) [filename,permission,machinefmt,encodingOut] = fopen(fileID)
3. In the next line, we will get and request the code to read the next line in the file. We then assign all the letters and number in this line to a variable, in our case is f1.
We can then proceed to extract data from this variable. Before we can extract the Global Low, mid and high temperature for the experiment. We then split this string and assign another variable to this split string. Then, from this second varibale that we just set, we can go ahead to extract the required data, i.e. the Global Temperatures.
4. So, when we give the code to read these lines, we will again create new variables to assign in this code accordingly. So, we will assign the global high temperature according to the place where the values are present.
5. In the next line of the code, we have read and skip these lines as these lines begin with an exclamation mark and are general comments made in the file just like how we make comments in MATLAB for our own reference.
6. So, to proceed with the code, we will start a for loop that will perform all the commands that we give inside of it. We must read the line and then assign a variable to split the string that we create in that line. We then read the species name from the file. To read the name of the file, we must again create another variable and then split that string and then use the first set of letters till we get a blank space in the file. We need to use the strsplit command to split all the string different set of words. Then the first set of letters will represent the Species name in the file.
Syntax for strsplit is as follows:C = strsplit(str) C = strsplit(str,delimiter) C = strsplit(str,delimiter,Name,Value) [C,matches] = strsplit(___)
7. After this, we need to make a directory to store all the graphs that we will be plotting. To make a directory, we can use the command of mkdir and then create a directory of the species name that will be read in the previous lines.
8. So, every species has its own local High, Mid and Low temperatures. We need to read it seperately for every species and then assign a variable for it. So, for every species, the Local Temperatures will be noted for further calculations.
9. Then in the next line, we will try to get the co-efficients as well. We already know that Coefficients 1 to 7 are for High Temperatures and that Co-efficients from 8-14 are low temperature co-efficients as well.
So, in every line of the code, we will read all the coefficients and then store them in their respective variables as well. For this, in general, we have to store the string in one variable and then split this string and store this in another variable.
We have to use the findstr command to locate the string. This command searches the longer of the two input arguments for any occurrences of the shorter argument, returning the starting index of each such occurrence in the double arrayk. If no occurrences are found, thenfindstrreturns the empty array.
Then from this second variable, we will extract the coefficients that are present in that line. This is how we can read all the co-efficients present in that line.
%syntax for findstr k = findstr(str1, str2)
10. Now, to calculate the Thermodynamic Properties from the coefficients, we have defined an if and else condition. In this condition, we have defined that if the input temperature is below the local mid temperature, then the low temperature coefficients are to be considered, else, if the temperature is above the local mid temperature, and below the local high temperature, then the high Temperature coefficients are to be considered. We have defined a common variable and then changed the co-efficients according to the temperature set. The code is given below in the main code tab.
The formulae to calculate the thermodynamic properties are given below:
Here:
Cp = Specific Heat
H = Enthalpy
S = Entropy
R = Universal Gas constant (8.314 `J . Mol^-1 . K^-1`)
a1,a2,a3,a4,a5,a6,a7 = Thermal Co-efficients according to the temperature at which it is being recorded.
11. In the next step, we will plot the graphs for the calculated properties and the temperature accordingly. To plot these graphs, we simply use the plot command and then, label them with their title and the x and y label accordingly. To save these graphs in the respective folders, we can use the directory in which we are writing the code and then use the Species name as the Folder name.
The syntax of the plot command is as follows:
plot(X,Y) plot(X,Y,LineSpec) plot(X1,Y1,...,Xn,Yn) plot(X1,Y1,LineSpec1,...,Xn,Yn,LineSpecn) plot(Y) plot(Y,LineSpec) plot(___,Name,Value) plot(ax,___) h = plot(___)
All these syntax can be used as per their own use and need.
12. In the next step, we will write a code to calculate the molecular weight of the Species. In this code, we have use the If and else condition again.
So, we start by stating the Elements that were used in the entire file. And then we create an array out of them.
Next, we create an array of the Atomic Mass of all the elements. The Atomic Mass and the element array should have exactly identical indices as shown below:
Atoms = ['H', 'C', 'N', 'O', 'A', 'R', '(', ')', 'S']; Atomic_mass = [1, 12, 14, 16, 40, 0, 0, 0, 0]; %The Atomic Mass and the Atoms have the exact indices.
13. In the last step, I have printed the results of the molecular weight into the command Window using the fprintf command as shown below:
Next, we will define a for loop that runs for the variable k as follows:
k = 1 : length(Species_name)
So the variable will run from 1 to the entire length of the Species name for which the properties are being calculated. Next, we define an if else loop for the Species name.
After this, we will define another variable z that will compare the Species name Letter and the Atoms array and then will apply the condition that is being set in the if else loop. So, the variable z is a logical array, and when compared with the Atoms array, we get a 1 at the index where the system has found a match between the species name letter and the Atoms array. So, I have stored the index where we get the 1 and then used this to then pick up the corresponding Atomic Mass for the calculation of the Molecular Weight.
So, if we have a digit in the Species name, for example in the species:CH2CHO, we have the digit 2. So in this case, we have to multiply the digit to the atomic mass of the previous species. This condition has been set up in the else loop. The code for this has been shown below.
fprintf('Molecular Weight of %s = %f u n', Species_name, Molecular_weight(i))
The Main Code is as follows:
close all clear all clc Thermo = fopen('THERMO.dat','r') %Opening the file that is stored in the file. fgetl(Thermo); %Getting the first line from the opened file. f1 = fgetl(Thermo); A = strsplit(f1, ' '); %Assigning a variable to the entire line. Global_low_temperature = str2num(A{2}); Global_mid_temperature = str2num(A{3}); Global_high_temperature = str2num(A{4}); fgetl(Thermo); fgetl(Thermo); fgetl(Thermo); for i= 1:53 f2 = fgetl(Thermo); B = strsplit(f2, ' '); Species_name = (B{1}); mkdir(Species_name); %Making the directory of the Species name Local_low_temperature = str2num(B{end-3}); Local_high_temperature = str2num(B{end-2}); Local_mid_temperature = str2num(B{end-1}); f3= fgetl(Thermo); C = findstr(f3, 'E'); Coeff1 = f3(1:12+3); Coeff2 = f3(16:30); Coeff3 = f3(31:45); Coeff4 = f3(46:60); Coeff5 = f3(61:75); f4 = fgetl(Thermo); D= findstr(f4,'E'); Coeff6 = f4(1:15); Coeff7 = f4(16:30); Coeff8 = f4(31:45); Coeff9 = f4(46:60); Coeff10 = f4(61:75); f5 = fgetl(Thermo); E= findstr(f5,'E'); Coeff11= f5(1:15); Coeff12= f5(16:30); Coeff13= f5(31:45); Coeff14= f5(46:60); %To calculate the various Thermodynamic Properties: T = [Local_low_temperature : Local_high_temperature]; j=1; Specific_Heat = 0; Enthalpy = 0; Entropy = 0; %High_temp_coeffs = Coeff1, Coeff2, Coeff3, Coeff4, Coeff5, Coeff6, Coeff7 %Low_temp_coeffs = Coeff8, Coeff9, Coeff10, Coeff11, Coeff12, Coeff13, Coeff14 for t = T R = 8.314; %Universal Gas Constant if t <= Local_mid_temperature a1= str2num(Coeff8); a2= str2num(Coeff9); a3= str2num(Coeff10); a4= str2num(Coeff11); a5= str2num(Coeff12); a6= str2num(Coeff13); a7= str2num(Coeff14); else a1= str2num(Coeff1); a2= str2num(Coeff2); a3= str2num(Coeff3); a4= str2num(Coeff4); a5= str2num(Coeff5); a6= str2num(Coeff6); a7= str2num(Coeff7); end %Thermodynamic Property Formulae: Specific_Heat(j) = (a1 + (a2* t) + (a3* t^2) + (a4* t^3) + (a5* t^4))* R; Enthalpy(j) = (a1 + (a2 * t) / 2 + (a3 * t^2) / 3 + (a4 *t^3) / 4 + (a5* t^4) / 5 + (a6 / t)) * R * t; Entropy(j) = (a1 * log(t) + (a2 * t) + (a3 * t^2) / 2 + (a4 * t^3) / 3 + (a5 * t^4) / 4 + (a7)) * R; j = j+1; end %Plotting the results: plot(T, Specific_Heat, 'linewidth', 3, 'color', 'r') xlabel('Temperature (K)') ylabel('Specific Heat (J kg−1 K−1)') title(char(Species_name)) url = sprintf('E:/Rohit_SkillLync/MATLAB/Codes/Project1/%s/Specific Heat Plot.jpg',Species_name); saveas(gcf,url) plot (T, Enthalpy, 'linewidth', 3, 'color', 'b' ) xlabel('Temperature (K)') ylabel('Enthalpy (J)') title(char(Species_name)) url1 = sprintf('E:/Rohit_SkillLync/MATLAB/Codes/Project1/%s/Enthalpy Plot.jpg',Species_name); saveas(gcf,url1) plot(T, Entropy, 'Linewidth', 3, 'color', 'g') xlabel('Temperature (K)') ylabel('Entropy (J/K)') title(char(Species_name)) url2 = sprintf('E:/Rohit_SkillLync/MATLAB/Codes/Project1/%s/Entropy Plot.jpg',Species_name); saveas(gcf,url2) %To calculate the Molecular weight of the Species: Q = 0; Atoms = ['H', 'C', 'N', 'O', 'A', 'R', '(', ')', 'S']; %All the atoms that are used in all the Species are mentioned here. %A is representing the AR Species. But since the software is comparing %Letter by letter, hence that change is made. Atomic_mass = [1, 12, 14, 16, 40, 0, 0, 0, 0]; %Corresponding Atomic masses are stated here for k= 1:length(Species_name) z = Species_name(k) == Atoms; %Creating a Logical Array under the variable of z. ind = find(z==1); %Finding the index where we can get z = z*z'; %z' = Z_transpose if z Q(k) = Atomic_mass(ind); %We take the Atomic Mass at the index where we get a 1 in the logical array. else Atomic_mass_index = find(Atoms==Species_name(k-1)); Q(k-1) = str2num(Species_name(k)) * Atomic_mass(Atomic_mass_index); end end Molecular_weight(i) = sum(Q); %Species_Name = Species_name(i) fprintf('Molecular Weight of %s = %f u n', Species_name, Molecular_weight(i)) end %end
Results:
a. All the Files of the Species are created properly as shown below: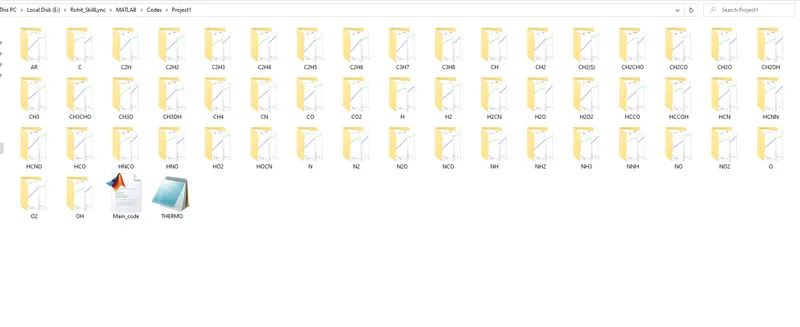
b. Plots for O2:
b1. Enthalpy Plot: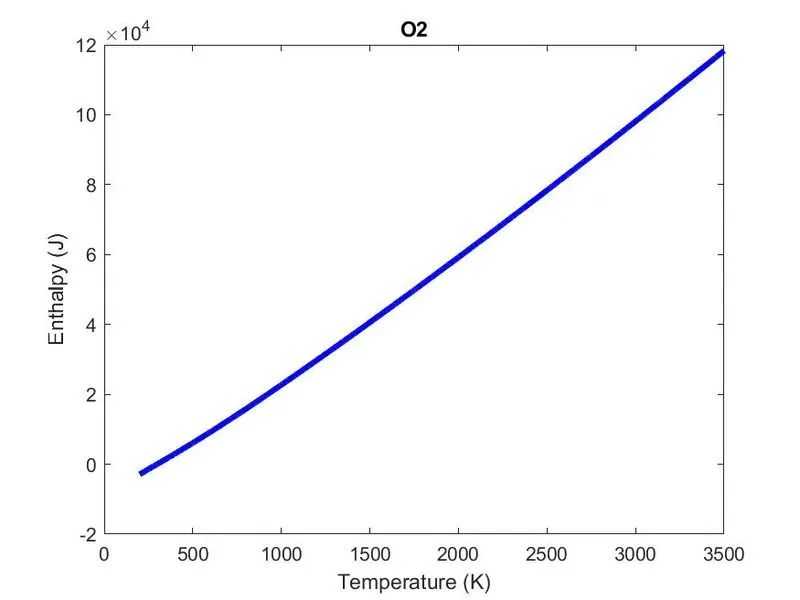
b2: Entropy Plot:
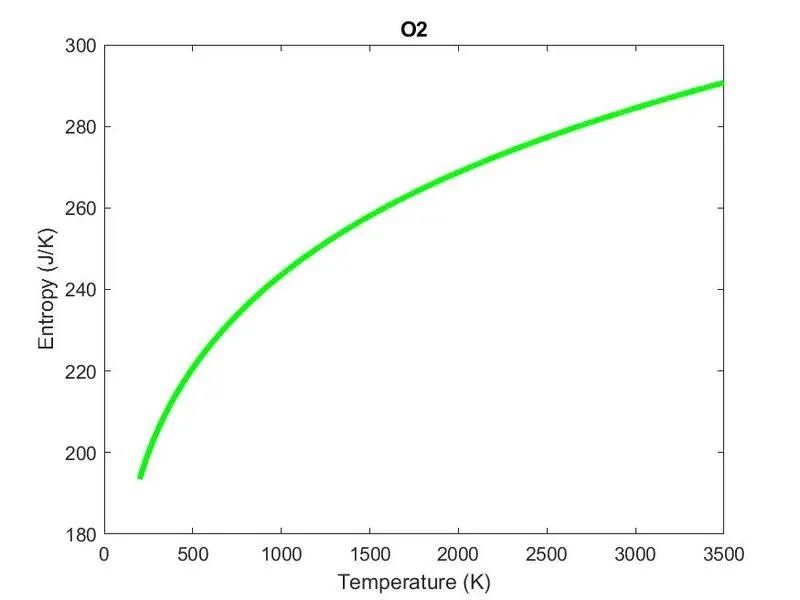
b3: Specific Heat Plot: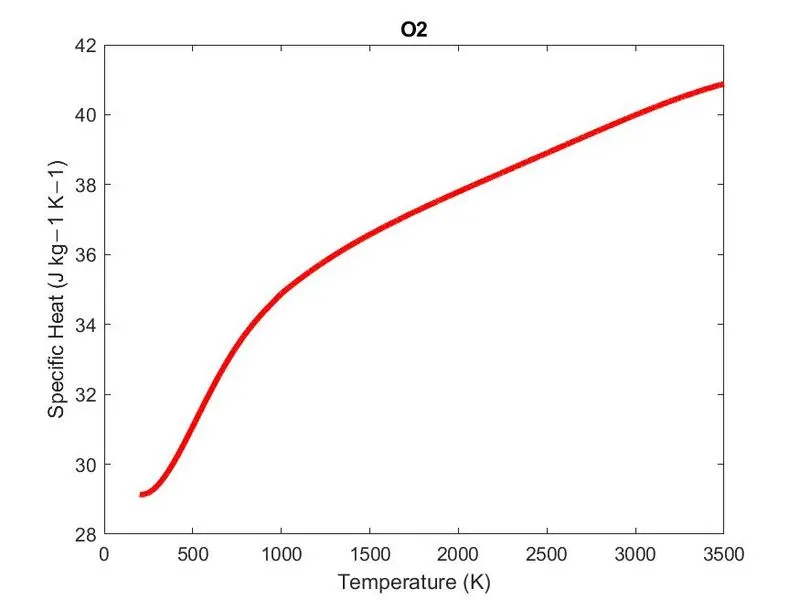
c. Plots for N2:
c1. Enthaply Plot: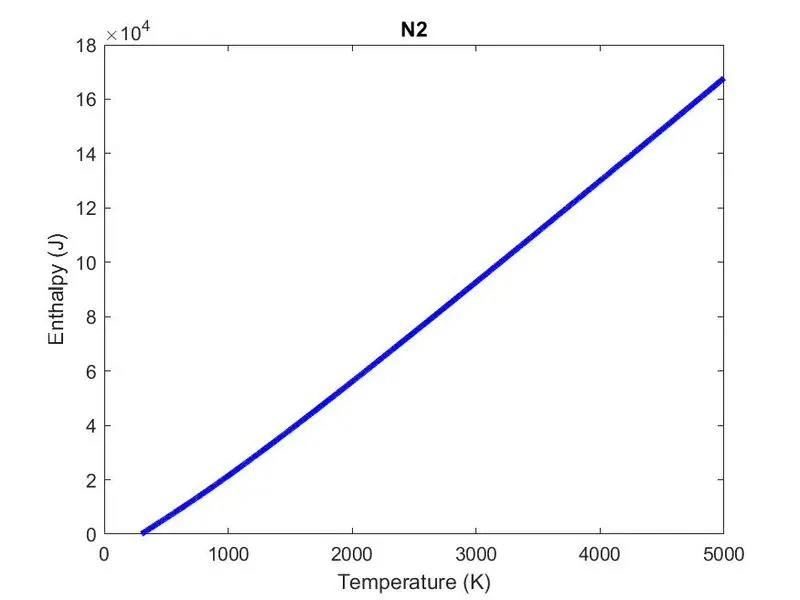
c2. Entropy Plot: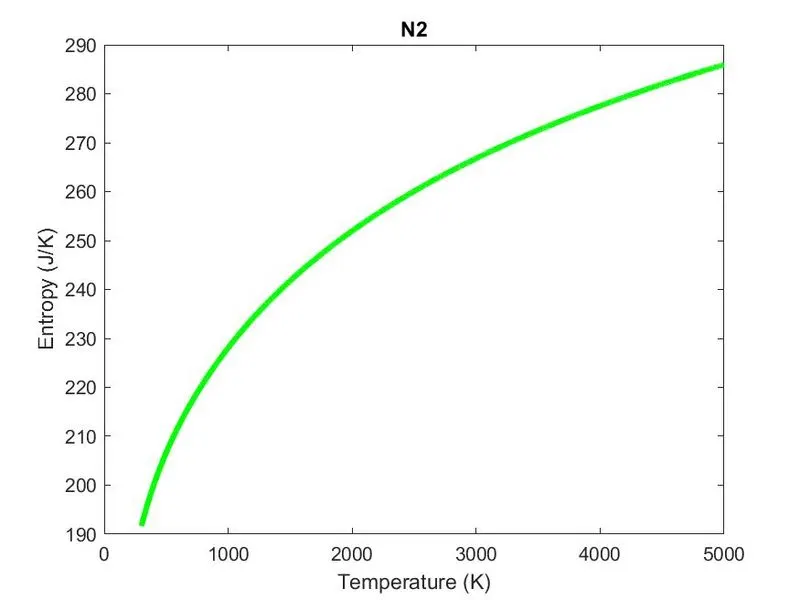
c3. Specific Heat Plot: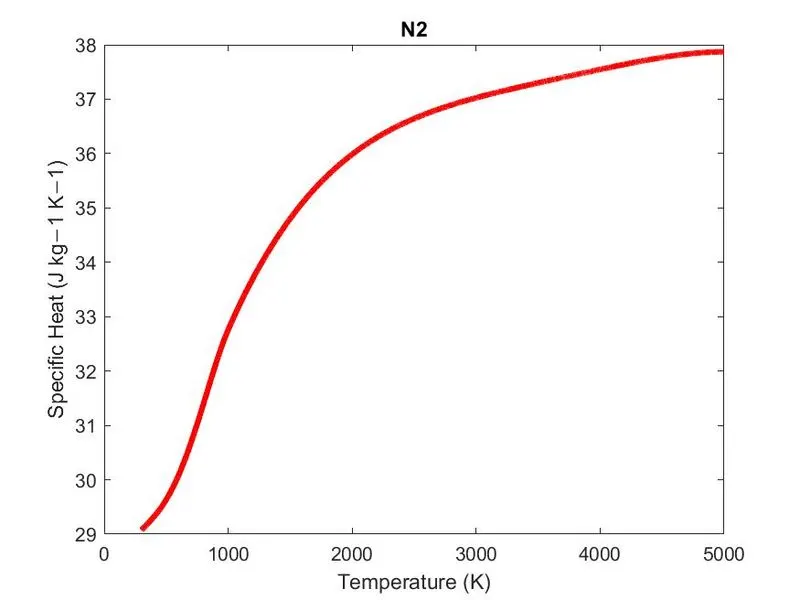
d. Plots for Co2:
d1. Enthlpy Plot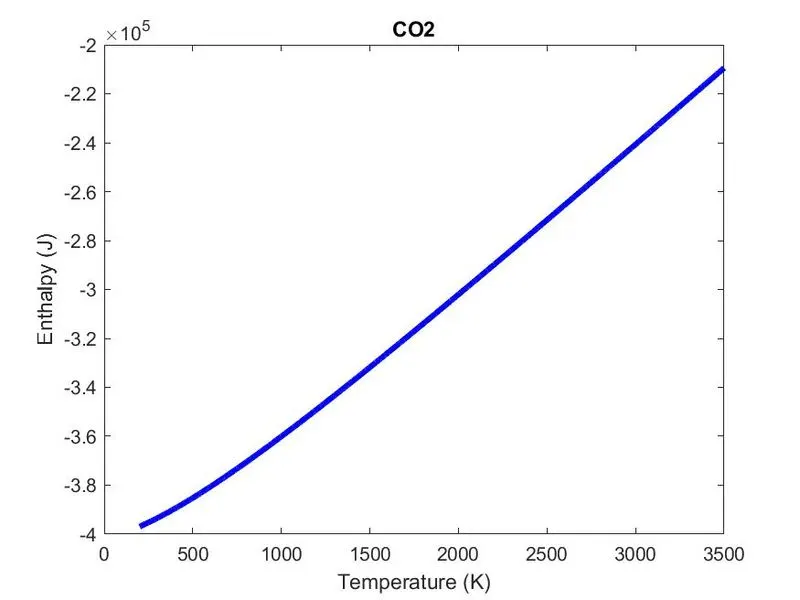
d2. Entropy Plot: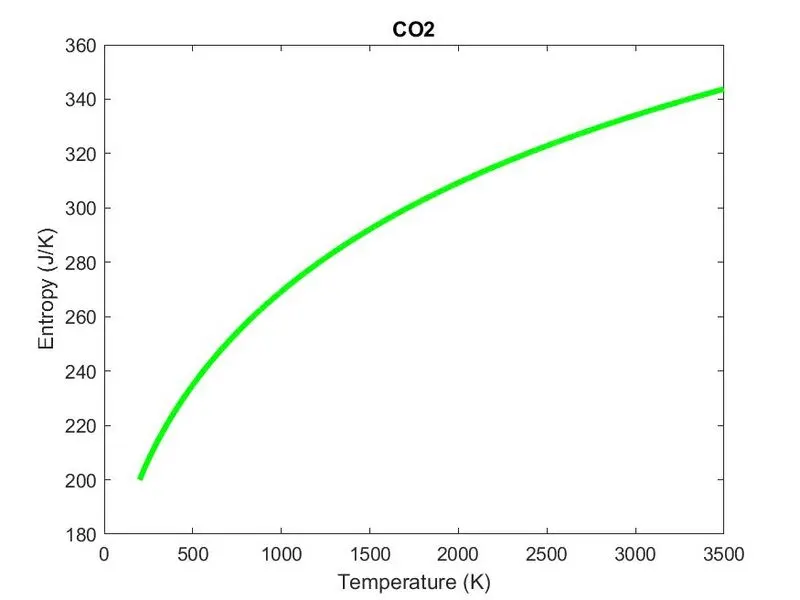
d3. Specific Heat Plot: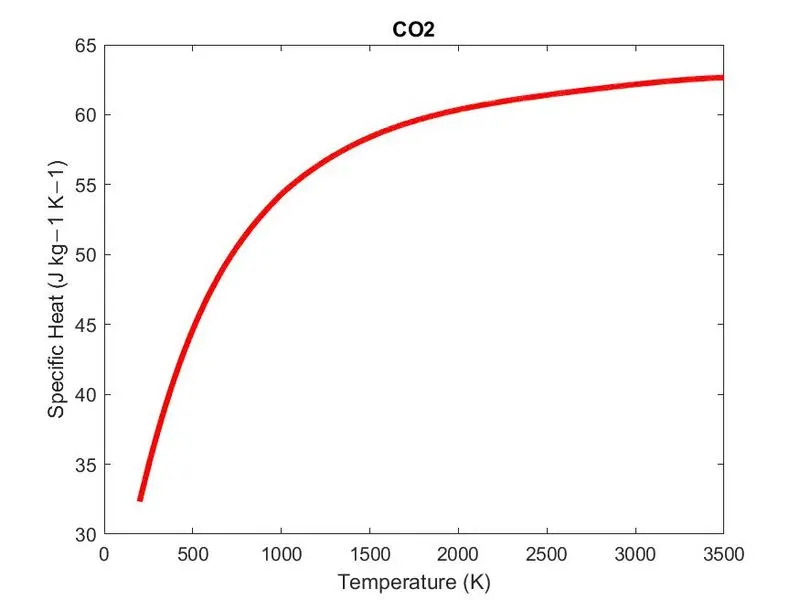
e. Molecular Weights in the Command Tab: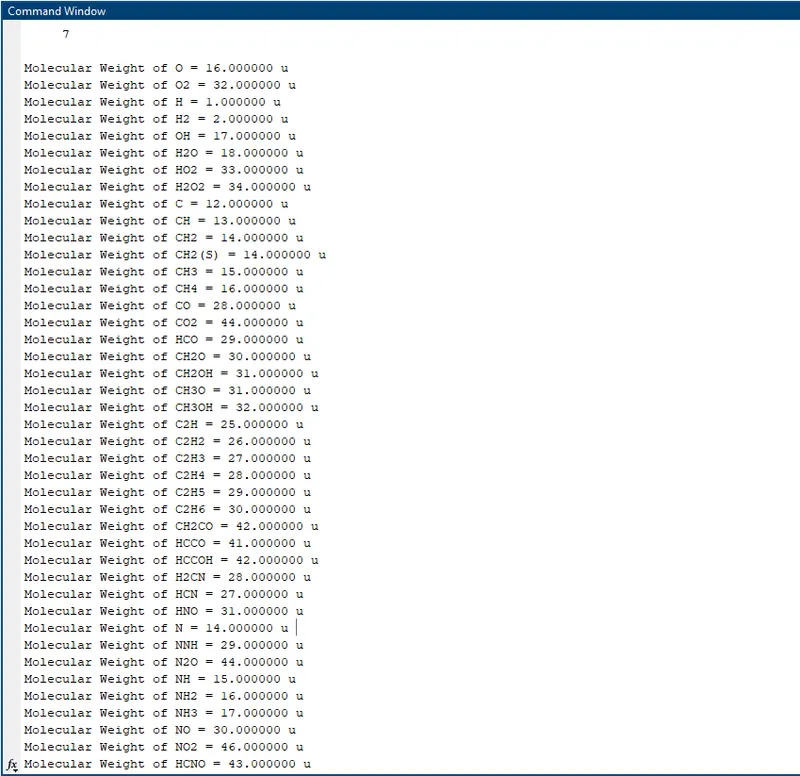
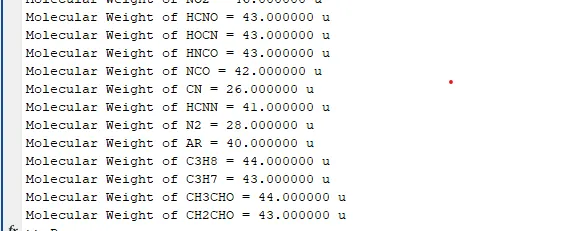
All the Molecular Weights have been calculated appropriately.
- Errors: The errors that I faced were majorly the typos and the parantheses while using specific commands. So, when MATLAB pointed out an error, I checked for the line number and then checked for any typos and corrected them right away.
- Conclusions: In conclusion, I would like to state that this Project helped me understand how to write a code that can read a file and then calculate and plot between certain properties as well. It gave me a better understanding on how to use the for and the if else loop as well.