Parsing NASA thermodynamic data using MATLAB
Aim:
To write a code to calculate the Specific Heat, Enthalpy and Entropy of different speceis by reading the data from a file using Matlab.
Objectives:
1) Read the coefficients from the NASA Thermodynamic data file in the correct order and substitute them in the appropriate formula to find the values of the Specific heat, Enthalpy and Entropy.
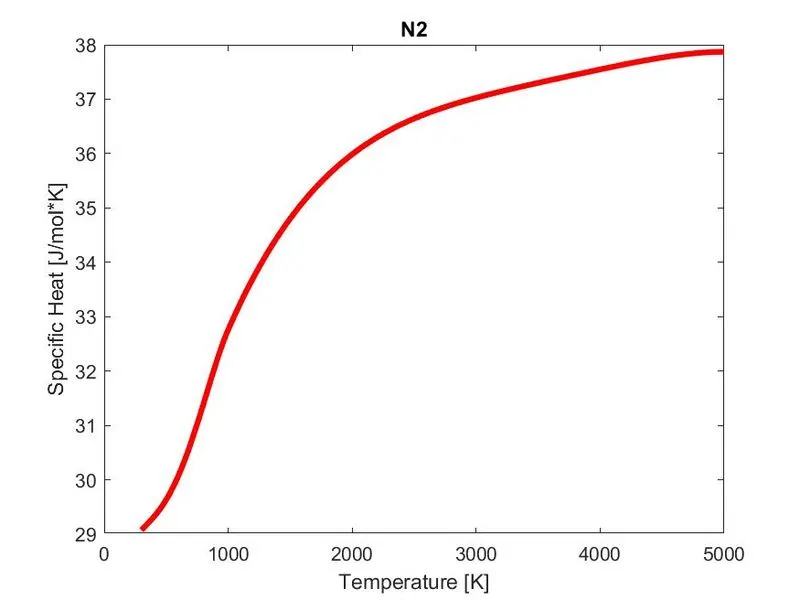
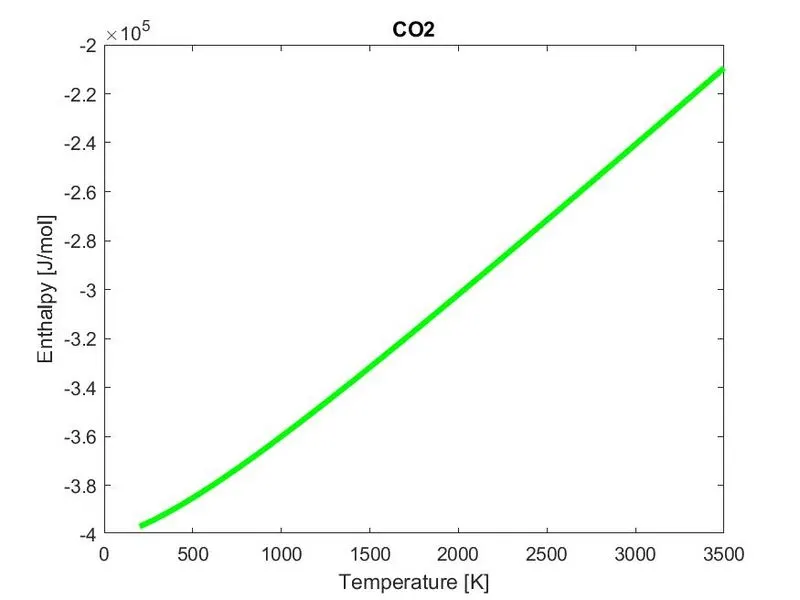
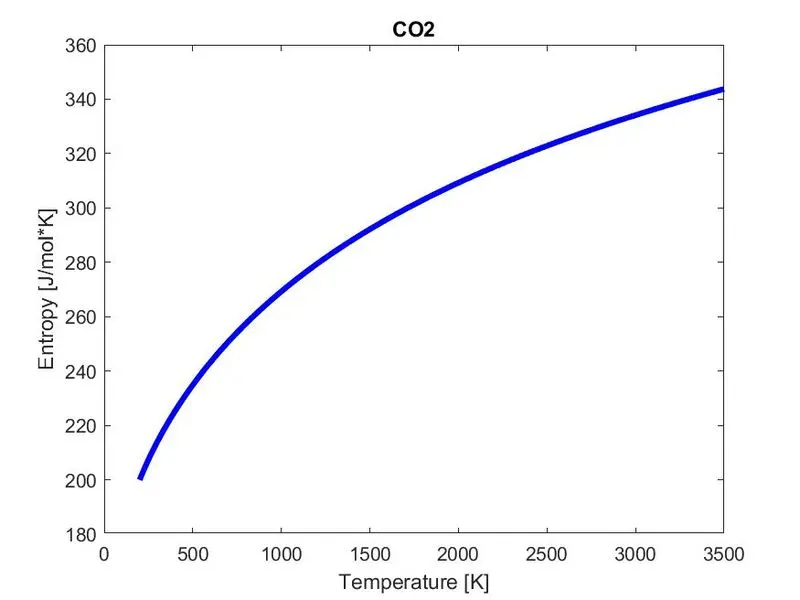
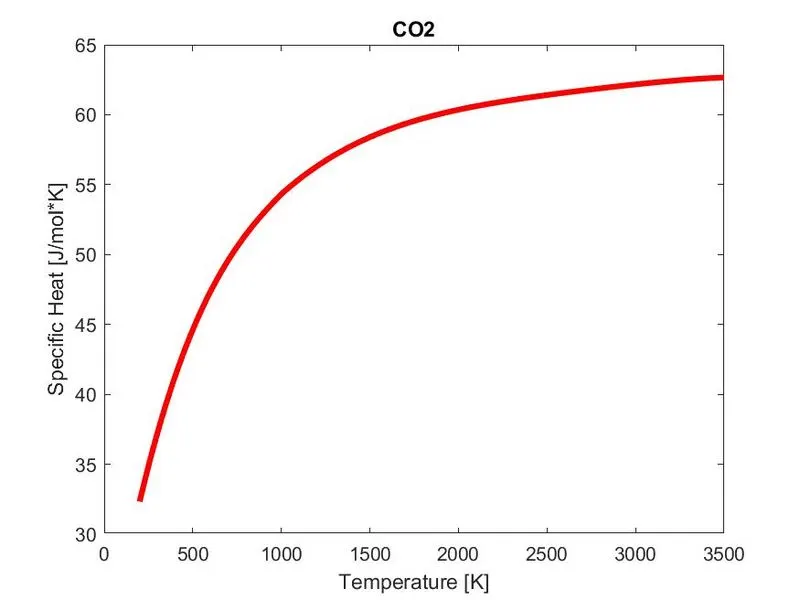
2) Bring up the plots for Temperature vs i) Specific heat ii) Enthalpy and iii) Entropy for each species and store them in a seperate folder.
Theroy:
File Parsing is a technique used to read through a file and extract the necessary data in the right manner. In order to perform a meaningful task, one must be able to understand the pattern followed in the given file and to extract only the necessary data. It is not a good practise to genearlise the code, rather one must take into account of every exceptionalities in the given file and write a code which works properly under all circumstances.
Parsing, syntax analysis, or syntactic analysis is the process of analyzing a string of symbols, either in natural language, computer languages or data structures, conforming to the rules of a formal grammar.The term has slightly different meanings in different branches of linguistics and computer science. Traditional sentence parsing is often performed as a method of understanding the exact meaning of a sentence or word, sometimes with the aid of devices such as sentence diagrams. It usually emphasizes the importance of grammatical divisions such as subject and predicate.
Within computer science, the term is used in the analysis of computer languages, referring to the syntactic analysis of the input code into its component parts in order to facilitate the writing of compilers and interpreters. The term may also be used to describe a split or separation.
Formula:
`(Cp)/R = a_1 +a_2T+a_3T^2+a_4T^3+a_5T^4`
`H/(RT)=a_1+(a_2T)/2+(a_3T^2)/3+(a_4T^3)/4+(a_5T^4)/5+(a_6)/T`
`S/R=a_1ln(T)+a_2T+(a_3T^2)/2+(a_4T^3)/3+(a_5T^4)/4+a_7`
Cp - Specific Heat
H - Enthalpy
S - Entropy
T - Temperature
R - Universal gas constant
Matlab code:
1) Function to calculate molecular weight of each species
function [m_weight] = molecular_weight(species)

% Elements which are present in the file
elements = ['H','C','N','O','R','S'];
% Atomic mass of each element
at_mass = [1,12,14,16,40,32];

m_weight = 0;
for i=1:length(species)
     for j=1:length(elements)
         if strcmpi(species(i),elements(j))
             m_weight = m_weight+at_mass(j);
             pos = j;
         end
     end
     n = str2num(species(i));
     if n>1
         % Species which consist of multiple atoms of same element
         m_weight = m_weight+(at_mass(pos)*(n-1));
     end
end
end
Explanation:
i) This function is used to calculate the molecular weight of every species.
ii) It takes the species name in the string format as input argument.
iii) Standard values of atomic mass for every element present in the file is stored in a character array (elements) and vector (at_mass).
iv) Each element from the species is compared with every elements of the 'elements' array. If they match, it's atomic mass is added to the molecular weight of the species.
v) Incase the element consists of more than multiple number of same elements, that number, which is initially in the string form is converted to number and then multiplied with the atomic mass of the respective element and added to the molecular weight of the species.
vi) The final value of molecular weight is stored in 'm_weight' which is sent back to the main program.
2) Function to calculate Specific Heat, Enthalpy and Entropy
function [Cp,H,S] = property_calculate(low_Temp,High_Temp,mid_Temp,a)
% Universal gas constant J / mol K
R = 8.314;

T = linspace(low_Temp,High_Temp,1000);
for j=1:length(T)
    if (T(j) > mid_Temp)
        % Using coeffiients 1-7 for temperature > mid temperature
        Cp(j) = R * ( a(1) + a(2)*T(j) + a(3)*(T(j).^2) + a(4)*(T(j).^3) + a(5)*(T(j).^4) );
        H(j) = R * ( a(1)*T(j) + a(2)*(T(j).^2)/2 + a(3)*(T(j).^3)/3 + a(4)*(T(j).^4)/4 + a(5)*(T(j).^5)/5 + a(6));
        S(j) = R * ( a(1)*log(T(j)) + a(2)*T(j) + a(3)*(T(j).^2)/2 + a(4)*(T(j).^3)/3 + a(5)*(T(j).^4)/4 + a(7));
    else
        % Using coeffiients 8-14 for temperature < mid temperature
        Cp(j) = R * ( a(8) + a(9)*T(j) + a(10)*(T(j).^2) + a(11)*(T(j).^3) + a(12)*(T(j).^4) );
        H(j) = R * ( a(8)*T(j) + a(9)*(T(j).^2)/2 + a(10)*(T(j).^3)/3 + a(11)*(T(j).^4)/4 + a(12)*(T(j).^5)/5 + a(13));
        S(j) = R * ( a(8)*log(T(j)) + a(9)*T(j) + a(10)*(T(j).^2)/2 + a(11)*(T(j).^3)/3 + a(12)*(T(j).^4)/4 + a(14));
    end
end
end
Explanation:
i) The aforementioned formula is used to calculate the Specific heat, Enthalpy and Entropy of each species, by taking the values of local temperature range and the corresponding coefficients as arguments of the function.
ii) For temperature values which are greater than the mid local temperature, the first 7 coefficients are used in the formula. Whereas the next 7 coefficients are used for temperature values lower than the mid temperature.
iii) The final values are stored in vectors Cp , H , S which are passed back to the main program.
3) Main program
clear all
close all
clc

f1 = fopen('Thermo.dat','r');
for i=1:5
    % Neglecting the initial 5 comments in the file
    fgetl(f1);
end

% species counter
element_count = 0;
% Reads the first line form the data file
tline = fgetl(f1);
A = strsplit(tline,' ');
n=length(A);
species = A{1};

while(~strcmpi(species,'end'))                % while loop terminates when the file encounters the end string

% Extracting the Local Temperature range
for j= 3:-1:1
temp_range(4-j) = str2num(A{n-j});
end

T_low = temp_range(1);
T_high = temp_range(2);
T_mid = temp_range(3);


count=1;    % coefficient counter
for j=1:3
    c=1;    % line counter
    tline = fgetl(f1);
    temp1 = findstr(tline,'E');
    if c==1
        a(count) = str2double(tline(1:temp1(1)+3));
        count = count+1;
        c=2;
    end
    n2 = length(temp1);
    for k=2:n2
        a(count) = str2double(tline(temp1(k-1)+4:temp1(k)+3));
        count = count+1;
    end
end

% Using property_calculate user defined function to calculate properties
[Cp,H,S] = property_calculate(temp_range(1),temp_range(2),temp_range(3),a);
% Temperature
T = linspace(T_low,T_high,1000);
% Calling the user defined molecular_weight function
m_weight = molecular_weight(species);
disp(['Molecular weight of ' species ' = ' num2str(m_weight)])

if ~exist('C:StudiesSkill Lync CFD MastersIntroduction to MatlabSpecies','dir')
    mkdir('C:StudiesSkill Lync CFD MastersIntroduction to MatlabSpecies');
end

if ~exist(fullfile('C:StudiesSkill Lync CFD MastersIntroduction to MatlabSpecies',species))
    mkdir('C:StudiesSkill Lync CFD MastersIntroduction to MatlabSpecies',species);
end

% Plotting graphs
figure(1)
plot(T,Cp,'Linewidth',3,'color','r')
xlabel('Temperature [K]')
ylabel('Specific Heat [J/mol*K]')
title(species)
% Storing the plots in the desired directory
cd(fullfile('C:StudiesSkill Lync CFD MastersIntroduction to MatlabSpecies',species));
saveas(gcf,'Specific Heat.jpg')


figure(2)
plot(T,H,'Linewidth',3,'color','g')
xlabel('Temperature [K]')
ylabel('Enthalpy [J/mol]')
title(species)
saveas(gcf,'Enthalpy.jpg')

figure(3)
plot(T,S,'Linewidth',3,'color','b')
xlabel('Temperature [K]')
ylabel('Entropy [J/mol*K]')
title(species)
saveas(gcf,'Entropy.jpg');
% Reverting back to the original directory where to program is saved
cd('C:StudiesSkill Lync CFD MastersIntroduction to Matlab');

% Rreads the next line of the file
tline = fgetl(f1);
A = strsplit(tline,' ');
n=length(A);
species = A{1};
element_count = element_count+1;

end

fclose(f1)
% Displays the total number of species present in the file
disp(['Total number of elements in the file = ' num2str(element_count)]);
Explanation:
i) The NASA Thermodynamic data file is initially stored in the same directory as that of the main program.
ii) The file is then opened in read format and the first 5 comments are read using the fgetl command.
iii) The first line of the file which contains the species name and local temeprature is extracted and stored in as a string tline.
iv) Species name is alone seperated from the string using strsplit command and stored in a variable species.
v) The local temperature values are found by selecting the last 3 strings from tline and converting them to integer using str2num command.
vi) Knowing that the next three lines of the file consists of the coefficient values for the species, these are retrieved by using a for loop.
vii) Simple line operations are performed to extract the coefficient values which are stored in a vector a.
viii) The coefficients values, the local temperature range and the species is passed as arguments to the functions property_calculate (Calculates the Cp,H,S values) and molecular_weight (Calculates the molecular weight) functions. Since the coefficients are not segregated seperately, it is difficult to use strsplit command. Although this is done by keeping 'E' as the reference point in every line as each coefficient consist of an exponential term. Every coefficient is starting from positio of 'E' + 4th term of the previous coefficient and position of 'E' + 3rd term of current coefficient, and this pattern is followed all along the file, simple string array element pointers are used to locate each coefficient and store them in variable a in its corresponding nth postion (The psoition of 'E' is found by using strfind command and storing the psotions of 'E' in an integer array namely temp1). Instead of defining seperate variables for each coefficients, all the coefficients are stored in a single array to make the code more efficient.
ix) A folder named 'Species' is created which is used to store the property plots of every every species.
x) A folder by the name of the respective species is created within the 'Species' folder to segregate the plots.
xi) cd command is used to change the directory of the control to the desired place. fullfile command is used to combine the inital directory name with the species name which is newly created.
xii) After plotting the graphs, they are inividually stored in their respective folders using the saveas command.
xiii) When the file finally encounters the 'End' string, it jumps out of the while loop as it no longer satisfies the condition.
xiv) The molecular weight of each species is displayed in the command window.
Output:
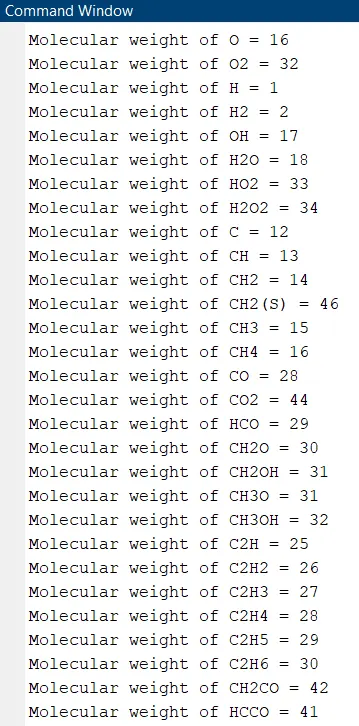
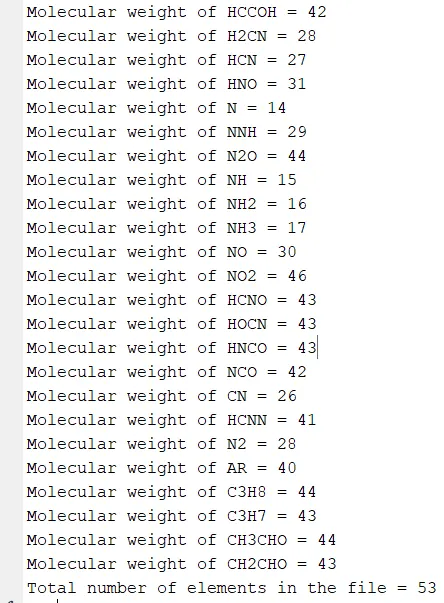
Fig 1: Molecular weights of each species
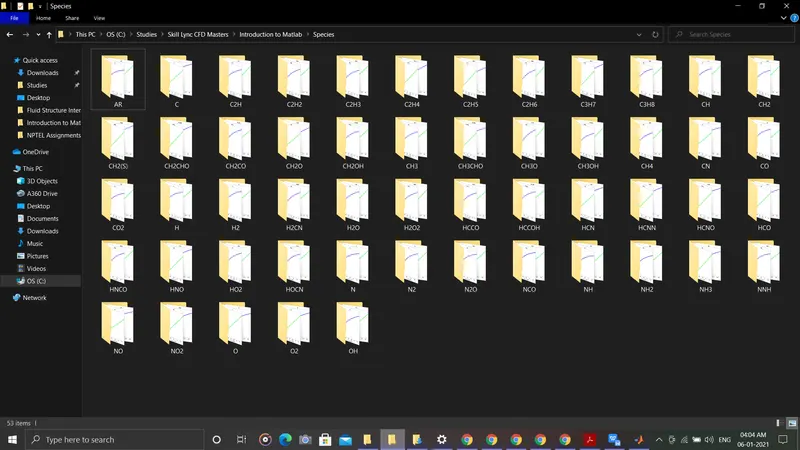
Fig 2: Folder where all the plots for every individual species is stored seperately.
Plots:
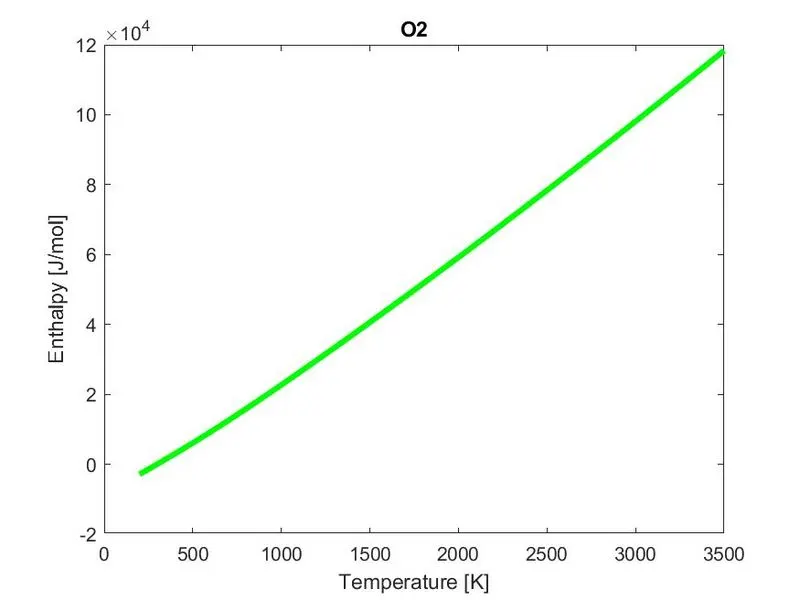
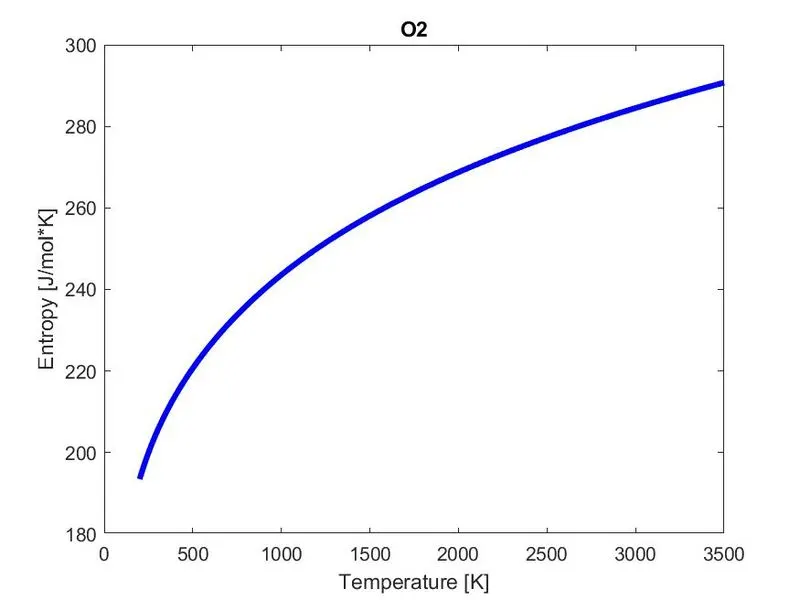
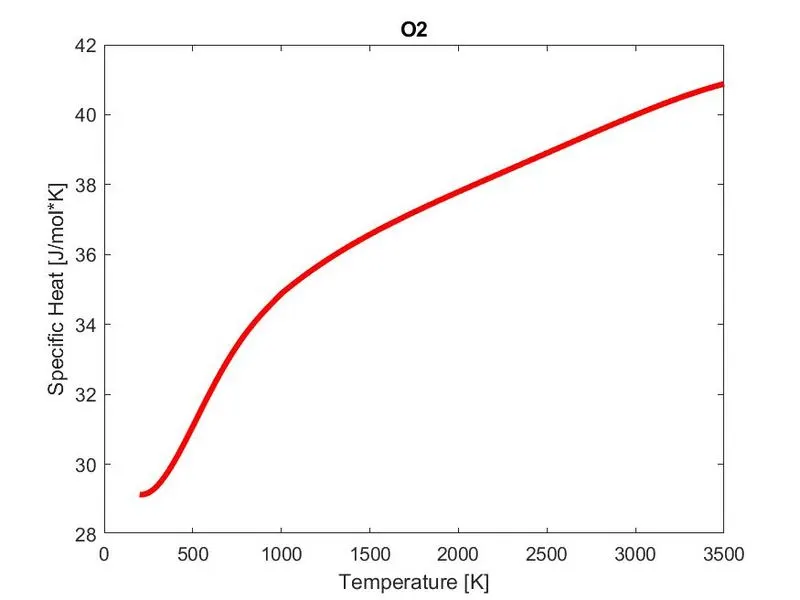
1) Property plots of O2
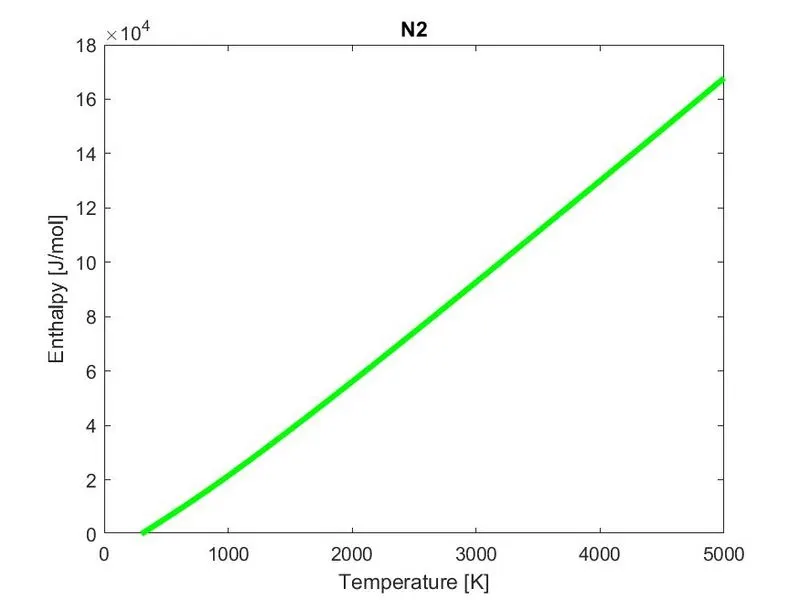
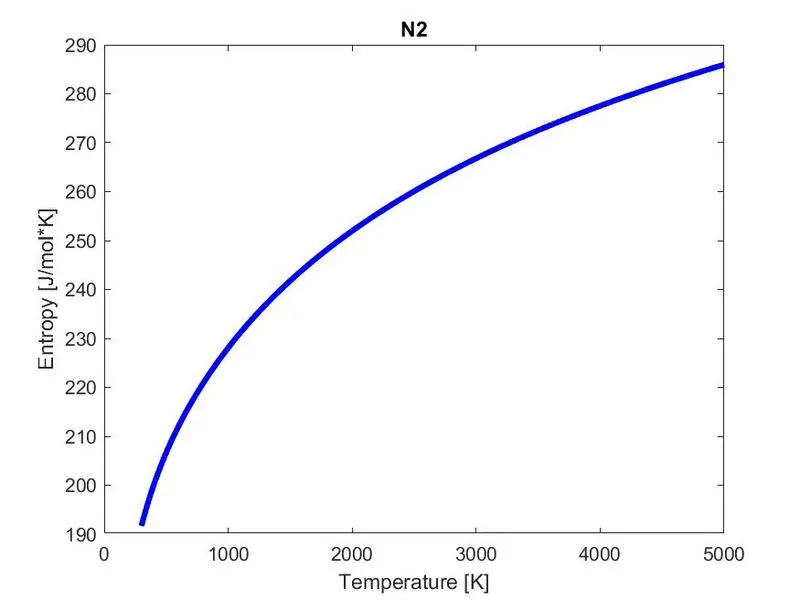
2) Property plots of N2
3) Property plots of CO2
References:
1) https://en.wikipedia.org/wiki/Parsing