Project 1 - Parsing NASA thermodynamic data
INTRODUCTION:
NASA came up with polynomials that can be used to evaluate thermodynamic properties such as Cp, H and S. They have also documented the co-efficients that are required to evaluate these polynomials for species.
The NASA polynomials have the form:
    Cp/R = a1 + a2 T + a3 T^2 + a4 T^3 + a5 T^4

    H/RT = a1 + a2 T /2 + a3 T^2 /3 + a4 T^3 /4 + a5 T^4 /5 + a6/T

    S/R  = a1 lnT + a2 T + a3 T^2 /2 + a4 T^3 /3 + a5 T^4 /4 + a7
where a1, a2, a3, a4, a5, a6, and a7 are the numerical coefficients supplied in NASA thermodynamic files. The first 7 numbers starting on the second line of each species entry (five of the second line and the first two of the third line) are the seven coefficients (a1 through a7, respectively) for the high-temperature range (above 1000 K, the upper boundary is specified on the first line of the species entry). The following seven numbers are the coefficients (a1 through a7, respectively) for the low-temperature range (below 1000 K, the lower boundary is specified on the first line of the species entry).
1. Writing a function file that extracts the 14 co-efficients by reading NASA thermodynamic data file and calculates the enthalpy, entropy and specific heats for any species using the following formula
function [species_name, temp, Enthalpy, Entropy, Specific_Heat]=thermo_properties(f1,value)

% R = Universal Gas Constant
R=8.31446261815324; %[J/K-mol]

fgetl(f1); % Reading the first line
global_temp=fscanf(f1,'%f'); % Extracting values from second line
% As such there is no use of these global temp. values

% Reading the next three lines
for i=1:3
fgetl(f1);
end

% Skipping the lines to the required species
for i=1:4*(value-1)
fgetl(f1);
end


line=fgetl(f1); %storing the first line of species
line_split=strsplit(line,' '); % splitting the line using delimeter space
species_name=line_split(1); % The first word is the name of species
species_name=species_name{1}; % Converting from cell to character

%Now the last three numbers are local temperature values
local_temp=line_split(end-3:end-1); % storing the last three values
local_low_temp=str2num(local_temp{1}); % Converting from string to number
local_high_temp=str2num(local_temp{2}); % Also storing to individual variables
local_medium_temp=str2num(local_temp{3});


% Now extracting the co-efficients
array_temp=fscanf(f1,'%f',[6 3]); %Extracting all three lines and six data points
array_temp=array_temp'; %Transposing

for i=1:5 % Neglecting the last data which is line number
    row1(i)=array_temp(1,i); %storing first line to a variable
    row1(5+i)=array_temp(2,i); %storing second line to same varible
    row1(10+i)=array_temp(3,i); %storing third line to same variable
end
% Now differentiating high temp co-eff & low temp coeff
            for i=1:7
                a_high_temp(i)=row1(i); %storing to new variable
                a_low_temp(i)=row1(7+i); %neglecting last data 15 as it is line number
            end
temp=linspace(local_low_temp,local_high_temp,1000); %creating data for temperaure for plotting


% Creating logic for using coefficients for different temperature
for m=1:length(temp)

    T=temp(m); %
if T>=local_low_temp && T<=local_medium_temp
    a=a_low_temp;
elseif T>local_medium_temp && T<=local_high_temp
    a=a_high_temp;
end
 %Calculating Specific Heat
            Cp=a(1)*R;
            for i=1:4
                Cp = Cp+a(i+1)*T^(i)*R;
            end
%Calculating Enthalpy
            H=a(6)*R;
            for i=1:5
                H=H+a(i)*R*T^(i)/i;
            end
%Calculating Entropy
                S=a(1)*R*log(T)+a(7)*R;
            for i=1:4
                S=S+a(i+1)*R*T^(i)/i;
            end
%Storing the property values at respective temperature
    Enthalpy(m)=H;
    Entropy(m)=S;
    Specific_Heat(m)=Cp;


end
2. Writing main program that will take the "THERMO.dat" file as an input and calculate the molecular weight of each species and displaying it in the command window.
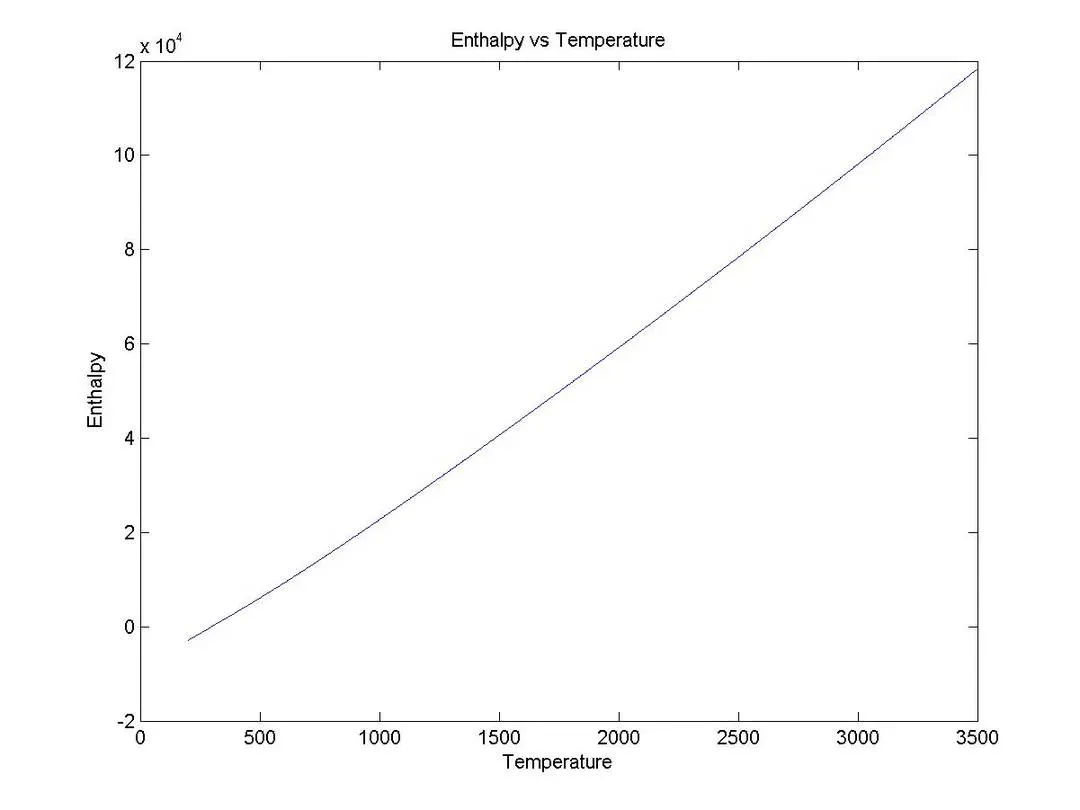
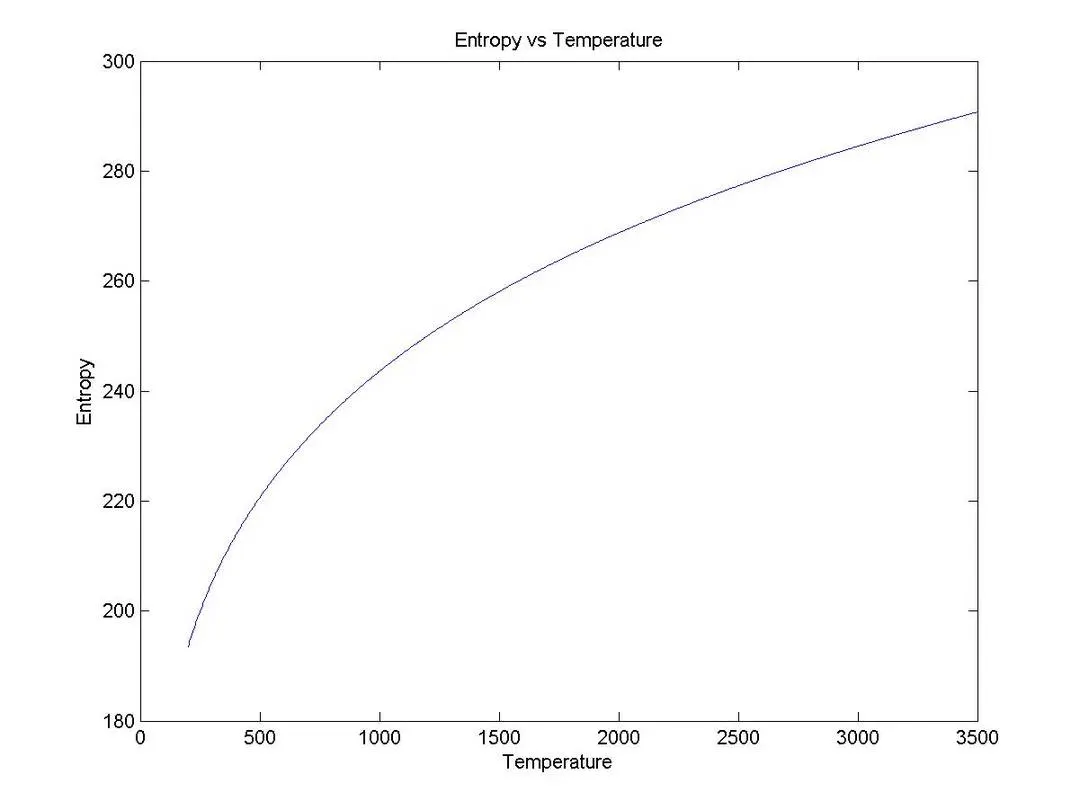
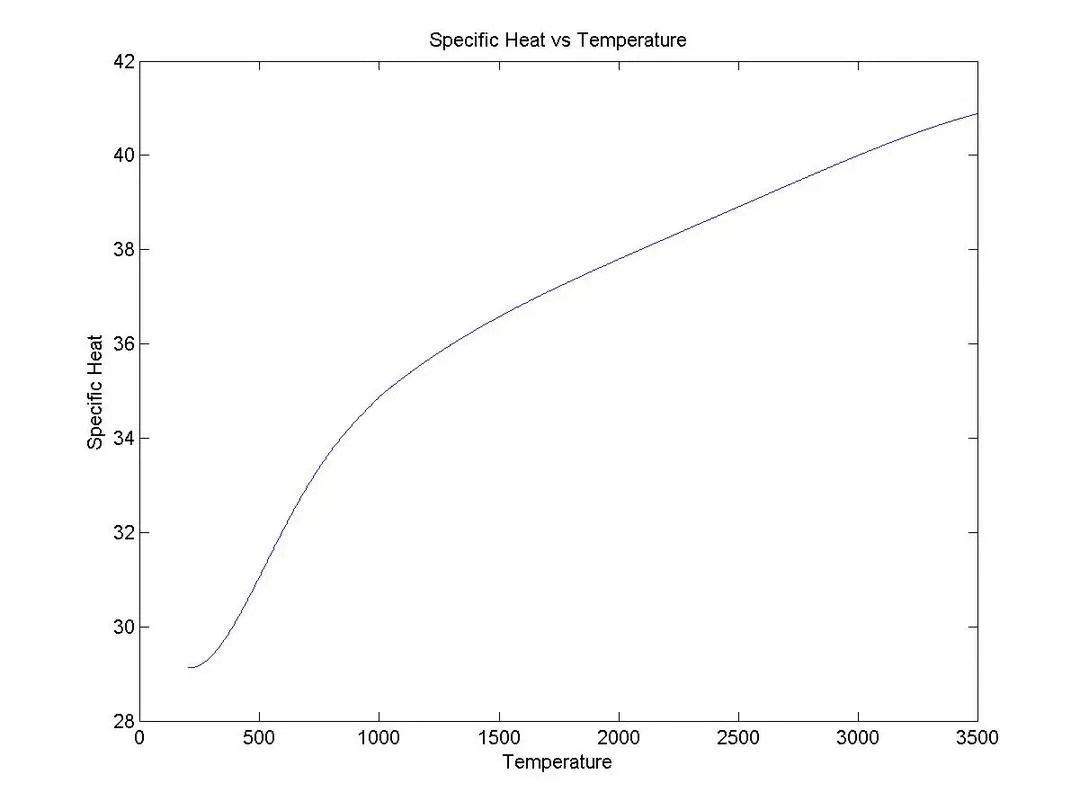
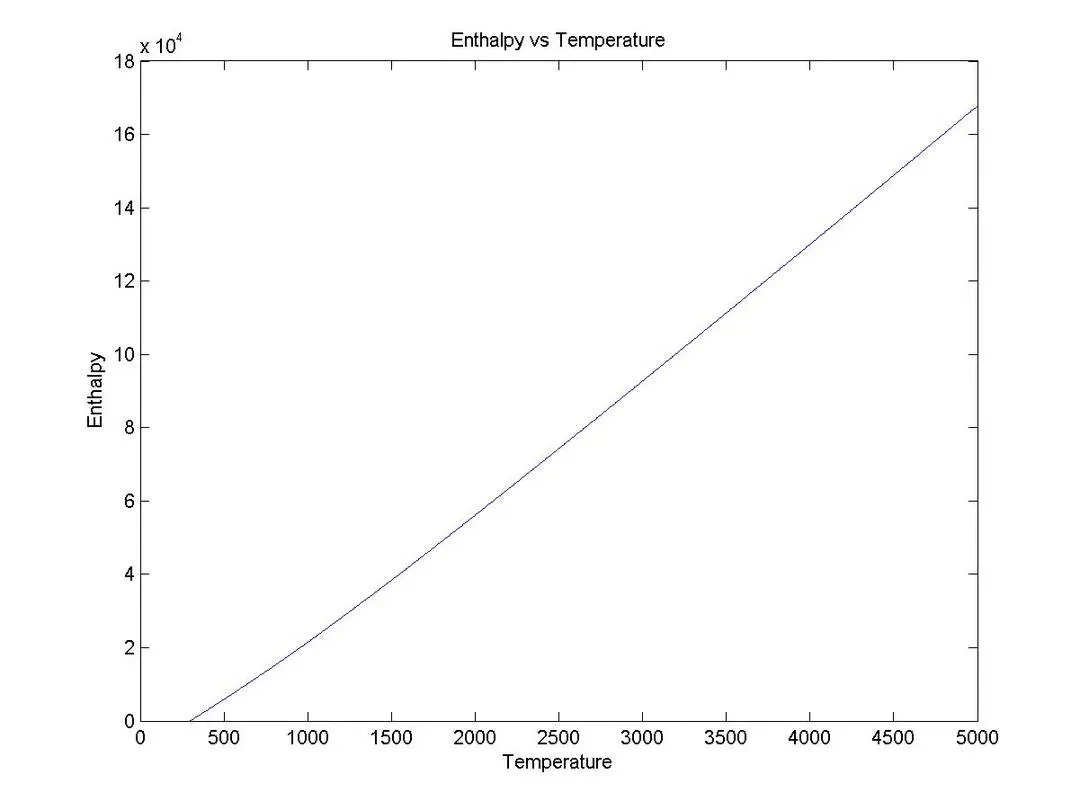
After that it Plot the Cp, Enthalpy and Entropy for the local temperature range (low temperature : high temperature) specific for each species & saving the plots as images with species names and saving them in separate folders.
% File Parsing

clc %clears the command window
clear %clears the workspace
close all % closes all windows

f1 = fopen('THERMO.dat','r'); %Opening the file and giving read permission
%Getting Input from user that which species property is needed
store=input('ENTER THE SPECIES NAME : ','s');

species={'O'    'O2'    'H'    'H2'    'OH'    'H2O'    'HO2'    'H2O2'    'C'    'CH'    'CH2'    'CH2(S)'    'CH3'    'CH4'    'CO'    'CO2'    'HCO'    'CH2O'    'CH2OH'    'CH3O'    'CH3OH'    'C2H' 'C2H2'    'C2H3'    'C2H4'    'C2H5'    'C2H6'    'CH2CO'    'HCCO'    'HCCOH'    'H2CN'    'HCN' 'HNO'    'N'    'NNH'    'N2O'    'NH'    'NH2'    'NH3'    'NO'    'NO2'    'HCNO'    'HOCN' 'HNCO'    'NCO'    'CN'    'HCNN'    'N2'    'AR'    'C3H8'    'C3H7'    'CH3CHO'    'CH2CHO'};
% Name of all the species

%Comparing input with the species data set to find what user has input

for k=1:53
    if strcmpi(species(k),store)
      value=k;
    end
end

%Now sending this value to function file to skip directly to required species
% In output we are getting properties & In input we are giving file and species value

[species_name, temp, Enthalpy, Entropy, Specific_Heat]=thermo_properties(f1,value);

% Now finding molecular weight of the species
atomic_mass=[16,1,12,14]; %storing the atomic weight of the known element
elements=['O','H','C','N']; %storing the element symbol of the element
mol_wt=0; % Intializing the variable
for i=1:length(species_name) %
    for j=1:length(elements)
        if strcmpi(species_name(i),elements(j)) %If first alphabet is same
            mol_wt=mol_wt+atomic_mass(j); %storing its value
            z=j; %If number comes it will be taken out of the loop
        end
    end
    t=str2double(species_name(i)); %converting string number type to number type
    if(t>1)
        mol_wt=mol_wt+(atomic_mass(z)*(t-1)); %subtracting one because once the element has been added
    end
end
mol_wt %displaying the output


current_folder=pwd; %storing the current folder path to return back to current folder
mkdir(species_name) %creating new folder with species name
cd(species_name); %changing the diretory to new folder

figure(1) %plotting first figure
plot(temp,Enthalpy) %temperature vs enthalpy
xlabel('Temperature') %giving the x-axis label
ylabel('Enthalpy') %giving the y-axis label
title('Enthalpy vs Temperature') %giving the title
saveas(figure(1),'Enthalpy vs Temperature.jpeg') %saving the plot

figure(2)
plot(temp,Entropy)
xlabel('Temperature')
ylabel('Entropy')
title('Entropy vs Temperature')
saveas(figure(2),'Entropy vs Temperature.jpeg')

figure(3)
plot(temp,Specific_Heat)
xlabel('Temperature')
ylabel('Specific Heat')
title('Specific Heat vs Temperature')
saveas(figure(3),'Specific Heat vs Temperature.jpeg')

cd(current_folder);%changing the directory to current folder
3. Explanation of coding logic and logic behind choosing aspects to parse out of the file
Here we are dividing the program into two matlab files
First File is function file where all the coefficients are read and output properties are used in main file
- Here we are first reading(skipping) the lines which are not useful with fgetl
- Then storing the name of species and local temperature values by saving the first line then splitting with the help of delimeter space and storing first cell value as species name and last three cell values as local tempertures.
- After that extracting next three values where co-efficients are stored by fscanf function, but here the line number is also scanned with it.
- So again neglecting the last line number storing co-efficients in two seperate variable first for high temperature and second for low temperature.
- Then by using linspace command creating local temperature range
- Now calculating enthalpy, entropy and specific heat using formulas shown above and using co-efficients accordingly with the help of if else statement.
- Storing the variables and giving it as output
Second Main file here we calculate molecular weight, plot graphs and save the graphs.
- Opening the of THERMO.dat file with read permission
- Asking Input from user that which species properties user wants
- Using this two above input calling the function file and taking the output proerties
- To find molecular weight the string of element is called seperately as each alphabet using for loop comparing alphabet with the stored element set and on matching adding the atomic weight of that element to the molecular weight. If the alphabet does not match with the element set it means it is a number so multiplying that number minus one with the prevoious element atomic mass and adding that to the molecular weight.
- Now for creating folders for each and every species and saving the plots in the same folder first of all we need to save the current directory path into variable by using pwd command to come back to current directory
- Then using mkdir function we will create new folder and the using change directory cd function we will move into new folder then plotting the graphs and giving title and labels saving it in the same directory and then again using cd coming back to original folder.
4. Attachments:
- Screenshot of the window where all the folders are saved.

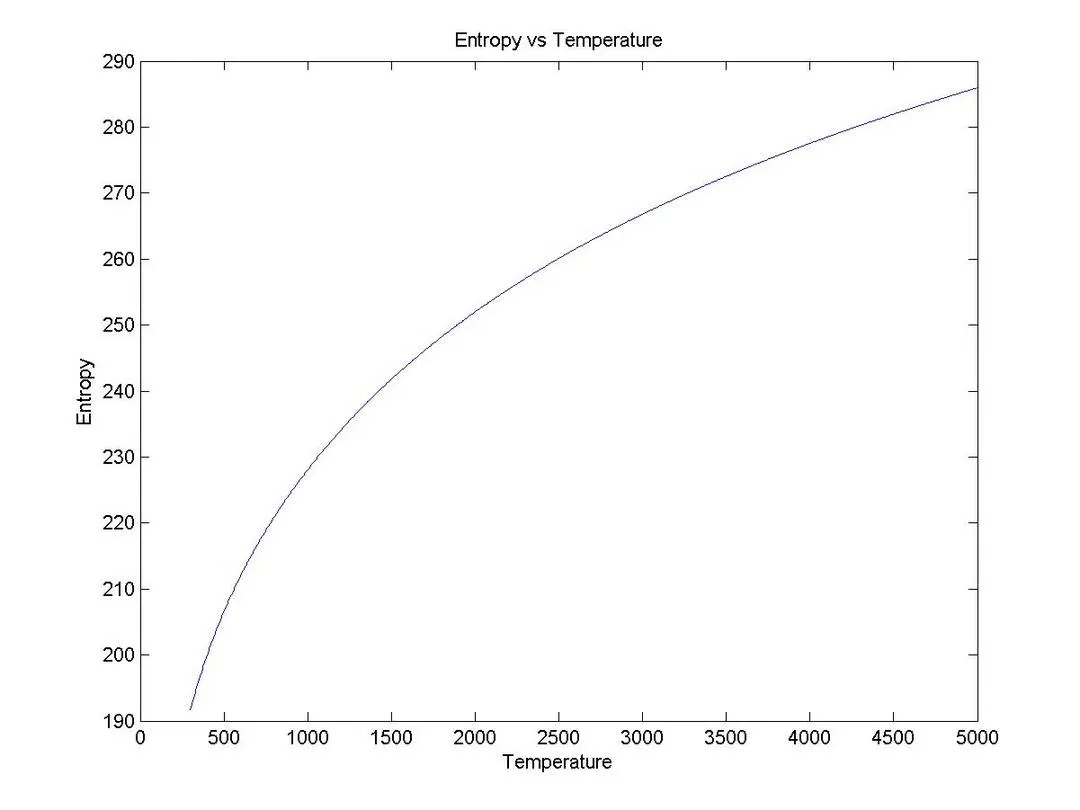
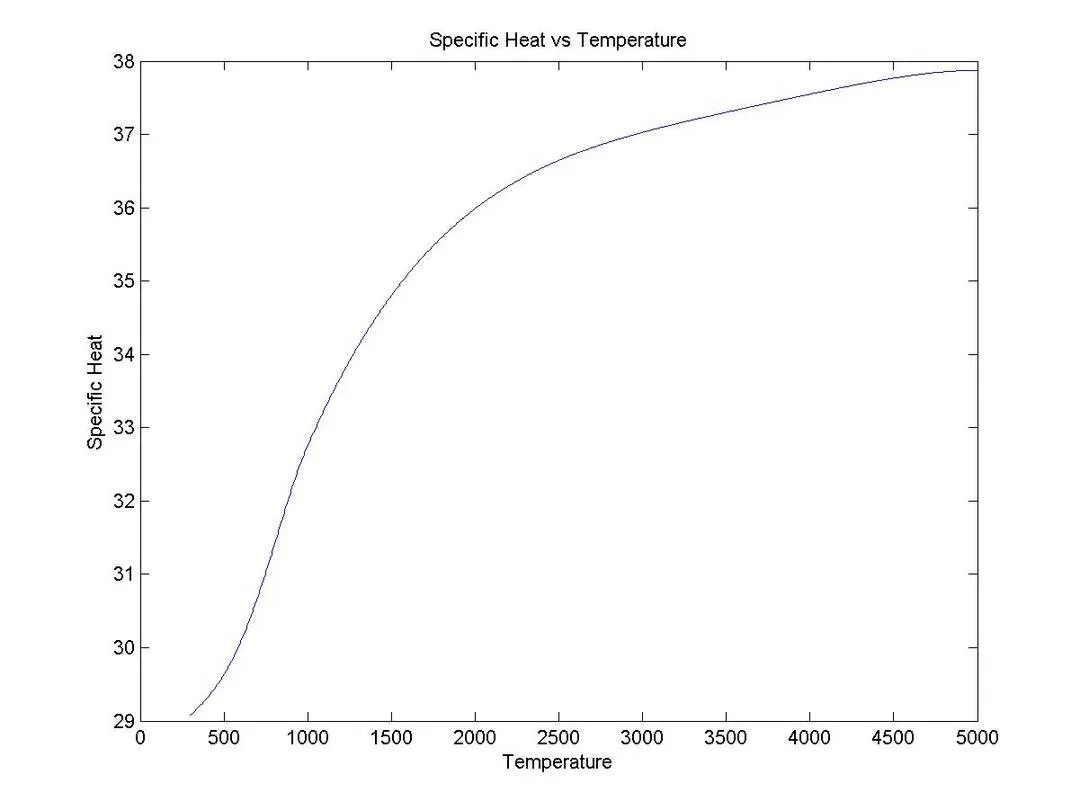
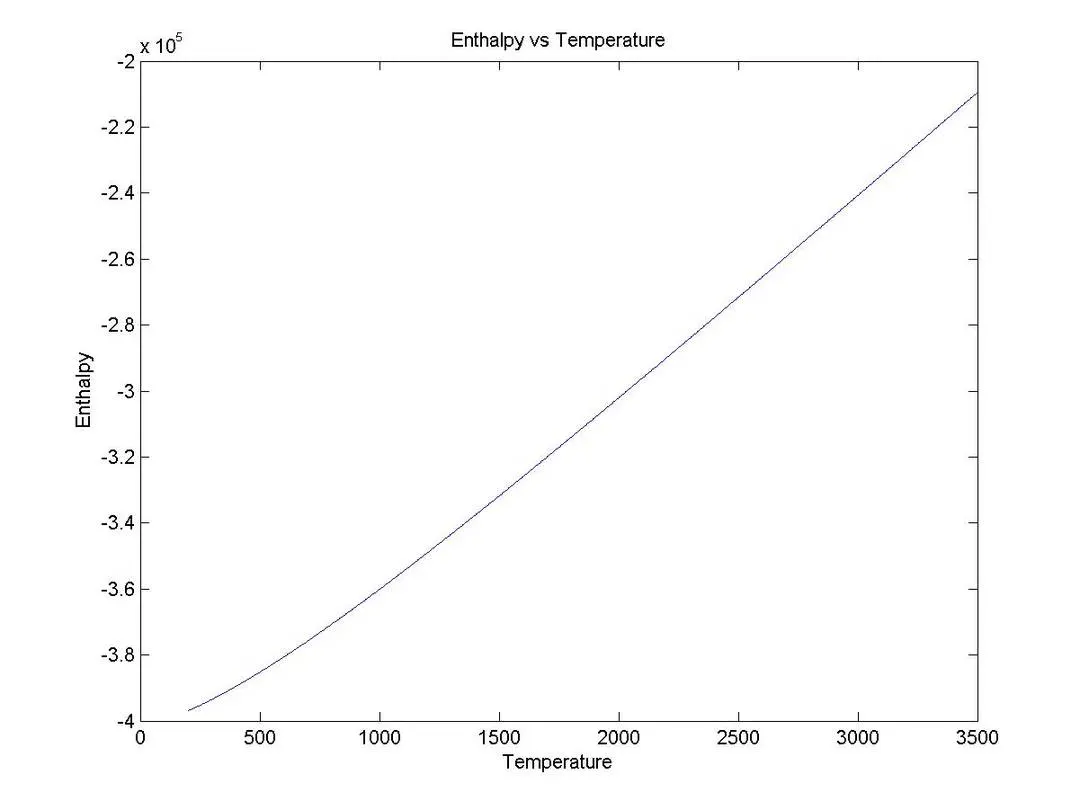
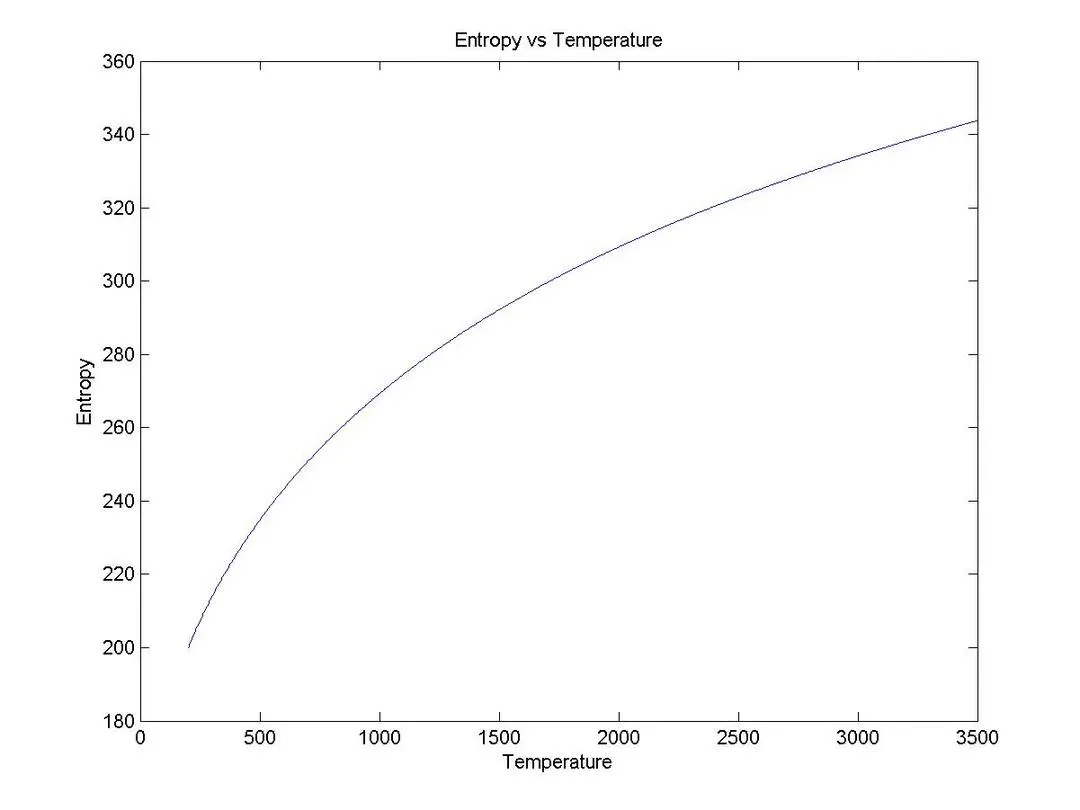
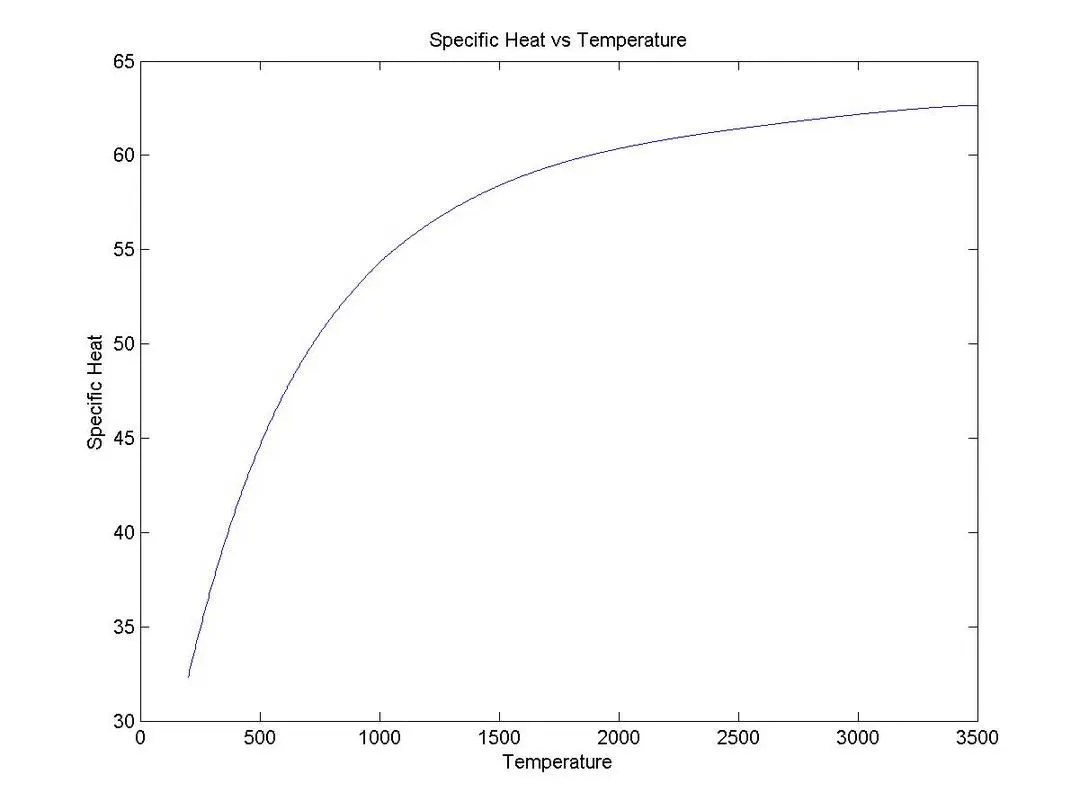
- Plots for o2, N2 and Co2 species
DIATOMIC OXYGEN (O2):
DIATOMIC NITROGEN (N2)
CARBON DIOXIDE (Co2) :
References
[1] combustion.berkeley.edu/gri_mech/version30/files30/thermo30.dat
[2] NASA Polynomials (berkeley.edu)
[3] This Document Supercedes Sandia National Laboratories Report SAND93-0478
[4] Compare strings (case insensitive) - MATLAB strcmpi - MathWorks India
[5] Make new folder - MATLAB mkdir - MathWorks India
[6] Identify current folder - MATLAB pwd - MathWorks India
[7] Read line of text from instrument and discard terminator - MATLAB fgetl - MathWorks India
[8] Read data from text file - MATLAB fscanf - MathWorks India