Project 1 - Parsing NASA thermodynamic data
Aim: File parsing NASA's themodynamic data using MATLAB.
Objective :
1. Write a function that extracts the 14 co-efficients and calculates the enthalpy, entropy and specific heats for all the species in the data file.
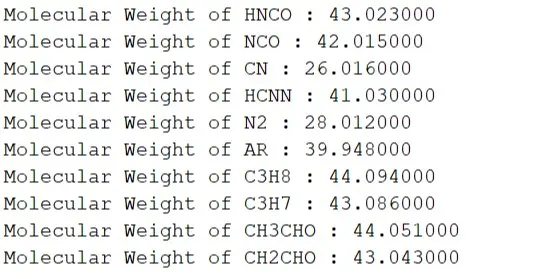
2. Calculate the molecular weight of each species and display it in the command window
3. Plot the Cp, Enthalpy and Entropy for the local temperature range (low temperature : high temperature) specific for each species.
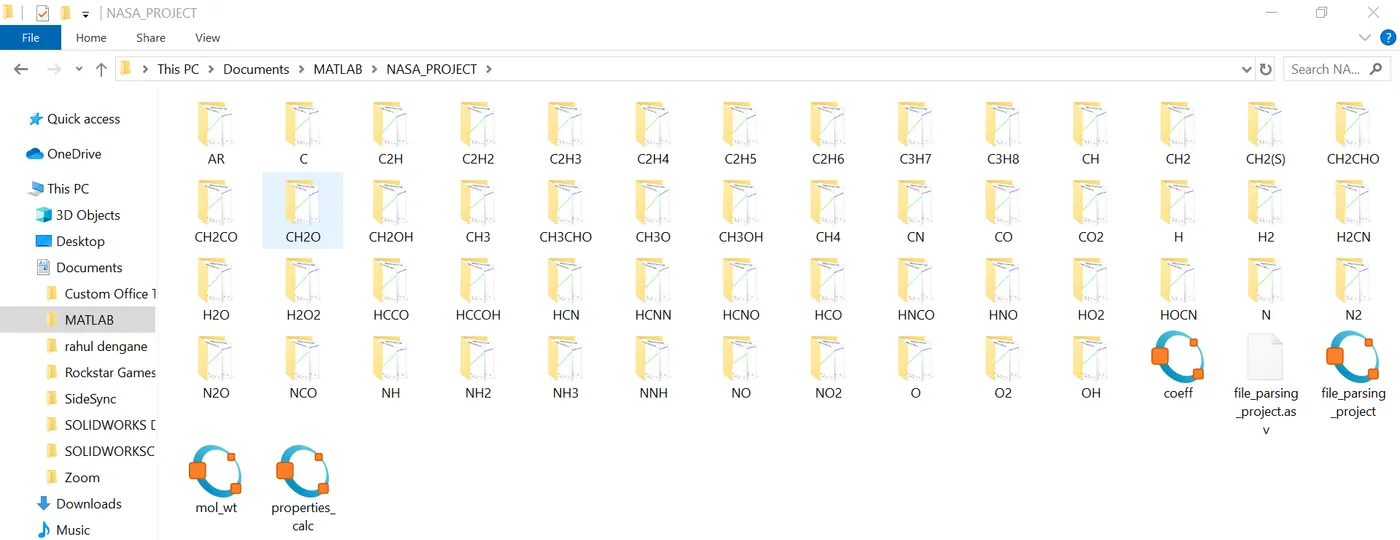
4. Save the plots as images with appropriate names and dump them in separate folders for each species with suitable name. All these should be generated automatically
Theory :
1.What is File Parsing ?
The term parsing comes from Latin pars, meaning part.The literal meaning of parsing is to resolve a sentence into its component parts and describe their syntactic roles.
In computing language parsing is to analyse (a string or text) into logical syntactic components.
2.What is specific heat ?
Specific Heat Capacity (Cp) is the amount of heat required to change the temperature of a mass unit of a substance by one degree at constant pressure.
3.What is enthalpy ?
The enthalpy (H) of a thermodynamic system is defined as the sum of its internal energy U and the work required to achieve its pressure and volume
4.What is entropy ?
Entropy is a (S) measure of the degree of spreading and sharing of thermal energy within a system.Entropy is also a measure of the molecular disorder, or randomness, of a system.
Data File :
We load the file Thermo.dat in our code.The data file contains information about 53 species.To understand how the information is laid in the file we can see the attached screenshot.

Here the start of the file has header which contains the global temperature data.Next three lines are comments which we need to ignore.First line of each species has the species name and local temperature range.Second line has coefficients a1 to a5.Third line contains coefficients a6 to a10 and the third line has coefficients has a11 to a14.The FIRST 7 coefficients are HIGH-temperature coefficients and the SECOND 7 coefficients are LOW-temperature coefficients.
Link to download the thermodynamic data file : https://drive.google.com/file/d/1AikCHDlz9s_fu8whE81qee_GD4AyYpCP/view
Formulae :
Specific Heat `Cp=(a1+a2*T+a3*T^2+a4*T^3+a5*T^4)*R`
Enthalpy `H=(a1 + (a2.*T)/2 + (a3.*T^2)/3 + (a4.*T.^3)/4 +(a5.*T.^4)/5 + (a6)/T)*R*T`
Entropy `S=(a1*log(T) + a2*T + (a3*T^2)/2 + (a4*T^3)/3 + (a5*T^4)/4+ a7 )*R`
Commands Used :
fopen() : opens file or gives information about open files.
fgetl() : read line from file.
str2num() : converts string array to number array.
str2double() : converts string to double precision value.
strsplit() : splits string with delimeters.
strfind() : finds string.
linspace() : generates linearly spaced vector.
mkdir() : make new folder.
cd() : change current folder.
saveas() : save figure with specific file format.
fprintf() : writes data.
questdlg() : creates a question dailouge box.
msgbox() : create message dailouge box.
inputdlg() : creates dailouge box to input user data.
strcat() : concatinates string.
upper() : changes string to upper case.
imread() : reads image from file.
imshow() : display image.
strcmpi() : compare strings(case insensitive).
figure() : create figure window.
Main Code :
clear all
close all
clc

%loading file
f1=fopen('THERMO.dat','r');

%getting header information
fgetl(f1);
temp_temperature=fgetl(f1);
temperature= strsplit(temp_temperature,' ');
min_globaltemperature=str2num(temperature{2});
mid_globaltemperature=str2num(temperature{3});
max_globaltemperature=str2num(temperature{4});

%to avoid headerline comment
for x=1:3
    fgetl(f1);
end

%we have 53 species
for y=1:53

%calling our function for extracting coefficients
[coefficients species_name]= coeff(f1);

molecule_name=species_name(1);

%calling function for Cp H S calculations
[Cp H S T]= properties_calc(coefficients);

%creating folders to save graphs
species=molecule_name;
mkdir(species)
cd(species)

%plotting specific heat data
figure(1)
plot(T,Cp,'linewidth',3,'color','r');
xlabel('Temperature in K');
ylabel('Specific Heat in KJ');
title(sprintf('Spefific Heat Cp vs Temperature T for %s',molecule_name));
grid on
saveas(figure(1),'Specific_Heat.jpg');

%plotting enthalpy data
figure(2)
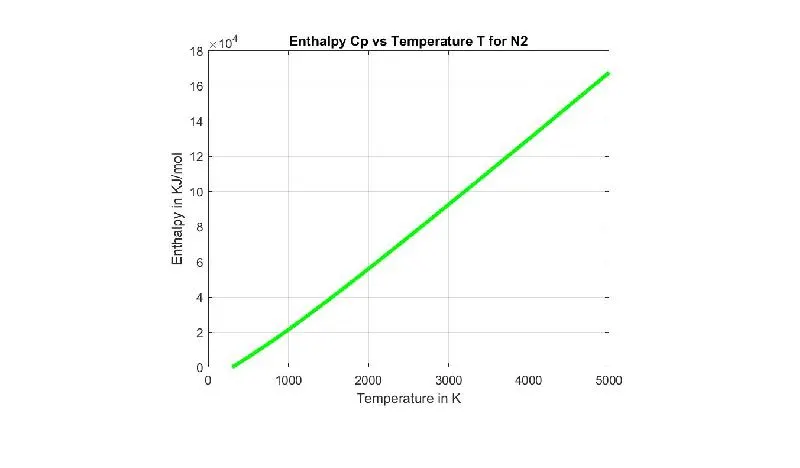
plot(T,H,'linewidth',3,'color','g');
xlabel('Temperature in K');
ylabel('Enthalpy in KJ/mol');
title(sprintf('Enthalpy Cp vs Temperature T for %s',molecule_name));
grid on
saveas(figure(2),'Enthalpy.jpg');

%plotting entropy heat data
figure(3)
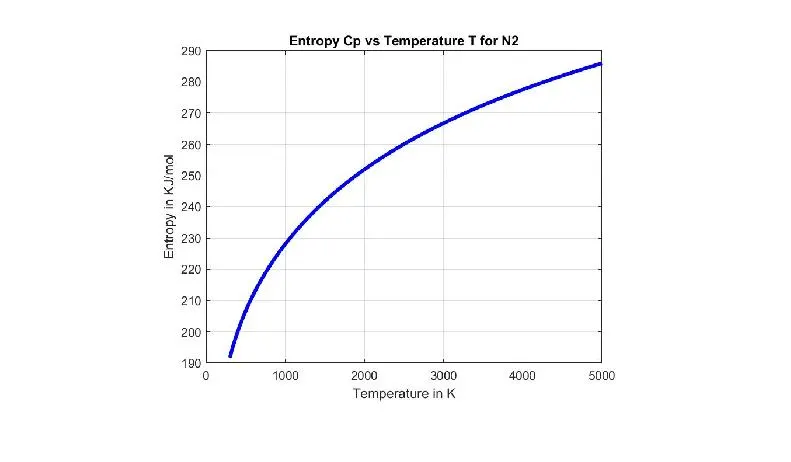
plot(T,S,'linewidth',3,'color','b');
xlabel('Temperature in K');
ylabel('Entropy in KJ/mol');
title(sprintf('Entropy Cp vs Temperature T for %s',molecule_name));
grid on
saveas(figure(3),'Entropy.jpg');

cd('../')           %moving up one directory

%calling function to calculate molecular weight
M=mol_wt(molecule_name);

%displaying Molecular weight in command window
fprintf('Molecular Weight of %s : %f \n',molecule_name,M)
end

%user input sequence for displaying plots from saved folder
count=1;
while count==1

user_input=questdlg('Do you want to plot graphs of any element?','user_input','Yes','No','No')

    switch user_input
        case 'Yes'
            msgbox('O OH O2 NO2 NO NNH NH3 NH2 NH NCO N20 N2 N HOCN HO2 HNO HNCO HCNN HCN HCCOH HCCO H2O2 H2O H2CN H2 H CO2 CO CN CH4 CH3OH CH3O CH3CHO CH3 CH2OH CH2O CH2CO CH2CHO CH2(S) CH2 CH C3H8 C3H7 C2H6 C2H5 C2H4 C2H3 C2H2 C2H C AR','Species Present')
            answer=inputdlg('Enter the species name','Species name');
            choice=answer{1};
            path=strcat(pwd,'\',upper(choice));

            figure(1);
            image_1=imread(strcat(path,'\','Specific_Heat.jpg'));
            imshow(image_1);

            figure(2);
            image_2=imread(strcat(path,'\','Entropy.jpg'));
            imshow(image_2);

            figure(3);
            image_3=imread(strcat(path,'\','Enthalpy.jpg'));
            imshow(image_3);

        case 'No'
            count=0;
    end

end
Main Code Explaination :
Since the code has many subparts we would analyse the code part by part for better understanding.
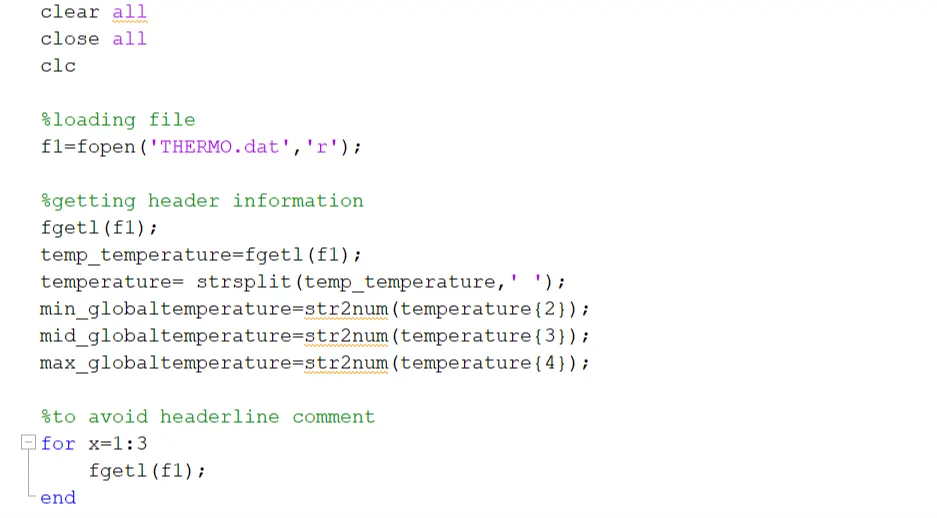
As a standard start we start by using clear all close all and clc to clear the memory.Then we load the data file in read mode by using fopen().Our first job is to extract the header information.To neglect the title we use fgetl().Then again we use the fgetl() to get the line containing global temperatures.This line has 3 temperature.To get them we need to seperate them first by using strsplit() and space ' ' as a delimeter.We can assign the three temperatures now.Make sure to use curly brackets {} as the string is in cell array.The next three lines are comments so to neglect them we use fgetl() in for loop.
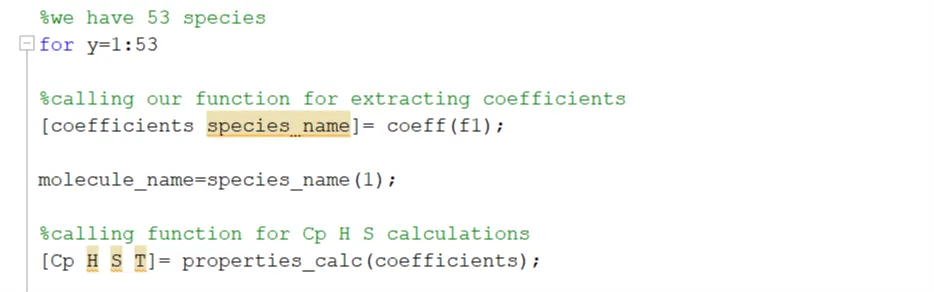
Since our thermo.dat file has 53 species block we use for loop with 53 iterations.We call function coeff() to extract all 14 coefficients , local temperature range and the species name.The molecule name is assigned.Once we have al our values we can now calculate the thermodynamic properties. For that we call another function properties_calc().We send the coefficients array as input and retrieve CP ,H, S ,T arrays.

As our requirement we need to create folders named by the species name.To do the same we use the mkdir() command.This will create folder for every iteration and name it by the species name.Secondly , we need we need to save 3 plots in each of the folder .To save in the folder made we change the current folder by using cd().
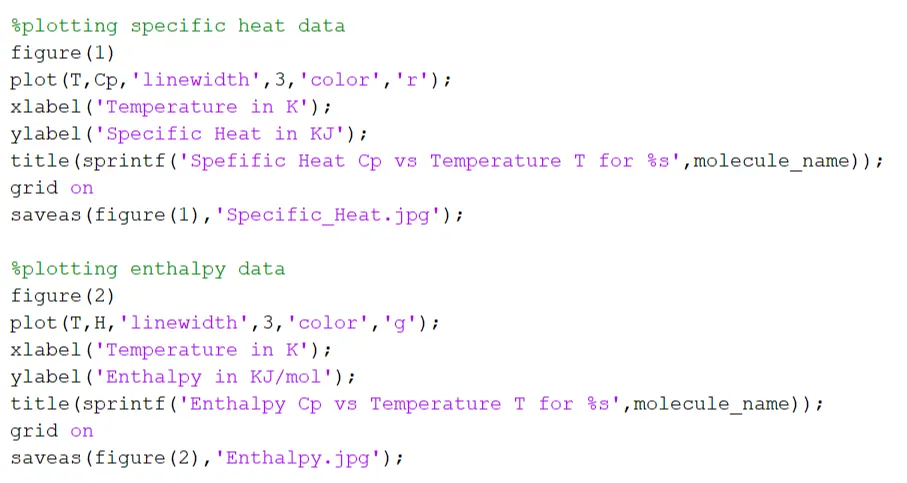
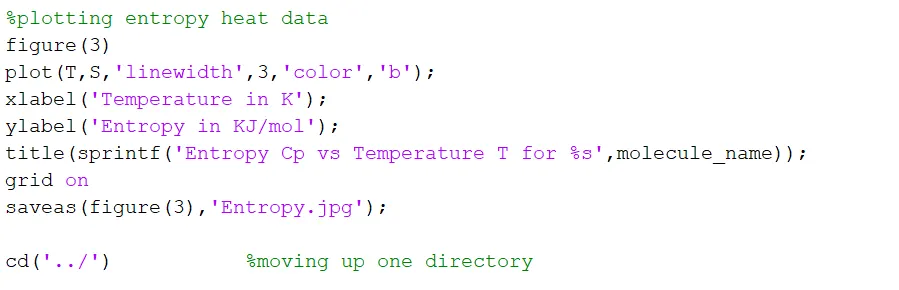
As said earlier we need to plot three different graphs for each species same is done now.We plot Cp vs T , S vs T and H vs T using plot(). Labels,Title are provided and the grid is switched on.We distinguish the three figures by using figure(). Once we have our graph plotted we can save them by using saveas() also we can save the format we to save in.These three graphs are now stored in our folder but we need to exit the folder before the another loop begins for next species.Hence we use cd('..\'),this will move the path one directory up.

To calculate the molecular weight we simply call the user defined fucntion mol_wt() by passing molecule_name as input.The working of the function will be explained later in the functio part.Our objective is to display the molecular weight in th command window which we will be doing by using the fprintf() command. And we will be closing our for loop as well.
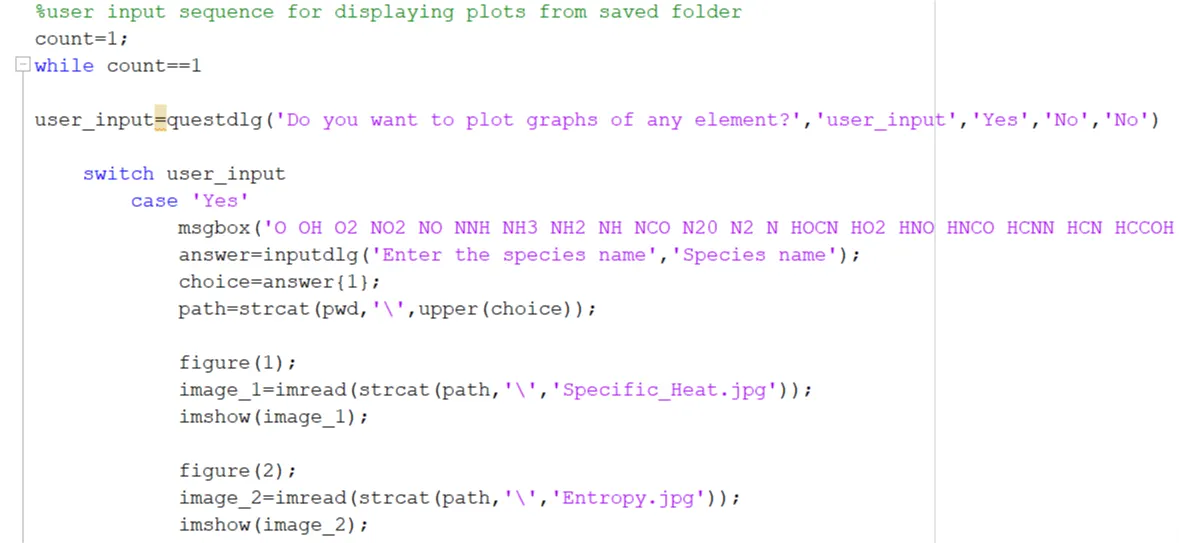
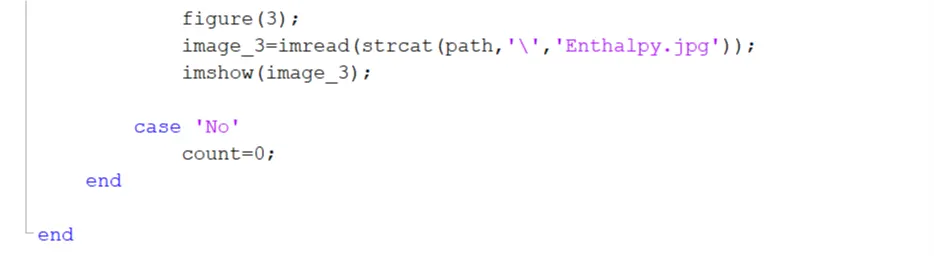
Our last part of the program is the user interface part.To kick things off we will be using a variable count set to 1.The idea being that the while loop will continue until the value of count changes to 0.We will be using a questdlg() to pop a question dailouge box which willl ask whether we want to plot to graphs or not.If we select 'No' then the switch case would change the count value to 0 and the loop would terminate.Contrary if we select 'Yes' then a message box pops up showing all the species name;this is done by using msgbox().An inputdlg() command is used to take input from the user i.e. which molecule's graph we want to plot.
To locate the path of the current direcory we used pwd.And to navigate to particular species folder we used strcat() to get the complete path.Our folder names are in capital letters hence we used the upper() command.We have successfully navigated to our folder.To read the images present we need to used the path and the image name in imread().Once image is read we can use imshow() to display the image.
Function Code 1 :
%Function for extracting coefficients
function [coefficients species_name]= coeff(f1)

    %getting line 1 data
    line_1=fgetl(f1);
        l1=strsplit(line_1,' ');
        species_name=l1{1};        %getting species name
        m1=length(l1);
            min_local=str2double(l1{m1-3});
            mid_local=str2double(l1{m1-1});
            max_local=str2double(l1{m1-2});

    %getting line 2 data
    line_2=fgetl(f1);
        l2=strfind(line_2,'E');
            a_1=str2double(line_2(1:(l2(1)+3)));
            a_2=str2double(line_2((l2(1)+4):(l2(2)+3)));
            a_3=str2double(line_2((l2(2)+4):(l2(3)+3)));
            a_4=str2double(line_2((l2(3)+4):(l2(4)+3)));
            a_5=str2double(line_2((l2(4)+4):(l2(5)+3)));

    %getting line 3 data
    line_3=fgetl(f1);
        l3=strfind(line_3,'E');
            a_6=str2double(line_3(1:(l3(1)+3)));
            a_7=str2double(line_3((l3(1)+4):(l3(2)+3)));
            a_8=str2double(line_3((l3(2)+4):(l3(3)+3)));
            a_9=str2double(line_3((l3(3)+4):(l3(4)+3)));
            a_10=str2double(line_3((l3(4)+4):(l3(5)+3)));

    %getting line 4 data
    line_4=fgetl(f1);
        l4=strfind(line_4,'E');
            a_11=str2double(line_4(1:(l4(1)+3)));
            a_12=str2double(line_4((l4(1)+4):(l4(2)+3)));
            a_13=str2double(line_4((l4(2)+4):(l4(3)+3)));
            a_14=str2double(line_4((l4(3)+4):(l4(4)+3)));


    coefficients=[a_1 a_2 a_3 a_4 a_5 a_6 a_7 a_8 a_9 a_10 a_11 a_12 a_13 a_14 min_local mid_local max_local];

end
Function Code 1 Explaination :
We have written the function for extracting coefficients a1 to a14,species name and local temperatures. Sinnce a1 to a14 and local temperatures are numbers we can get them as an output in coefficients array and the species name is a character we get that output in species_name.Those were the outputs and for input we give the loaded file f1.
Next we use the fgetl() for extracting the first line.Once we have it , we split the line using strsplit() with space' ' as a delimiter.now we can extract the local temperatures as show.The first element of the line 1 is species name.Since it is a type of cell array we use {} to extract it.
Next step is to get the coefficients.As seen in the thermo.dat file ,there are three lines having 14 coefficients in total.We get one line using fgetl() and to distinguish each value we use strfind() to locate the position of 'E'. After getting the position of E the code can be seen to extract values a_1 to a_5.Same process is repeated for next line to extract a_6 to a_10.Then similarly last line is parsed and a_11 to a_14 is extracted as well.
We store a1 to a14 and local temperatures in coefficients.
Function Code 2 :
function [Cp H S T] = properties_calc(coefficients)

%assigning extracted values
a1=coefficients(1);
a2=coefficients(2);
a3=coefficients(3);
a4=coefficients(4);
a5=coefficients(5);
a6=coefficients(6);
a7=coefficients(7);
a8=coefficients(8);
a9=coefficients(9);
a10=coefficients(10);
a11=coefficients(11);
a12=coefficients(12);
a13=coefficients(13);
a14=coefficients(14);

%local temperature
min_localtemperature=coefficients(15);
mid_localtemperature=coefficients(16);
max_localtemperature=coefficients(17);


T = linspace(min_localtemperature,max_localtemperature,1000);
R=8.314;        %universal gas constant

%calculating specific heat,enthalpy and entropy
    for j=1:length(T)

        if T(j)>mid_localtemperature
            Cp(j)=(a1 + a2.*T(j) + a3.*T(j).^2 + a4.*T(j).^3 + a5.*T(j).^4)*R;
            H(j)=(a1 + (a2.*T(j))/2 + (a3.*T(j).^2)/3 + (a4.*T(j).^3)/4 +(a5.*T(j).^4)/5 + (a6/T(j)))*R.*T(j);
            S(j)=(a1*log(T(j)) + a2.*T(j) + (a3.*T(j).^2)/2 + (a4.*T(j).^3)/3 + (a5.*T(j).^4)/4+ a7 )*R;

        else
            Cp(j)=(a8 + a9.*T(j) + a10.*T(j).^2 + a11.*T(j).^3 + a12.*T(j).^4)*R;
            H(j)=(a8+(a9.*T(j))/2 + (a10.*T(j).^2)/3 +(a11.*T(j).^3)/4 + (a12.*T(j).^4)/5 + (a13/T(j)))*R.*T(j);
            S(j)=(a8*log(T(j)) + a9.*T(j) +(a10.*T(j).^2)/2 + (a11.*T(j).^3)/3+(a12.*T(j).^4)/4+a14)*R;
        end

    end

end
Function Code 2 Explaination :
We have written this code for calculating thermodynamic properties of the species.In our previous function we got coefficients as our output.We send this coefficients array as input for this function.We assign each of the coefficients a1 to a14 and local temperatures.We define the temperature array from minimum local temperature to maximum temperature.Cp H S can be easily calculated from above mentioned formulae.But we have to decide which coefficients to use ad the first 7 are high temperature ones and later 7 are low temperature ones.We can make use of If loop i.e. if the temperature is above mid temperature than we use a1 to a7 and if the temperature is below mid temperature than we use a8 to a14. Finally we take Cp H S and T as the output from this function.
Function Code 3 :
%calculating molecular weight
function M=mol_wt(molecule_name)

atoms=['H','C','N','O','S','A'];
mass=[1.008 12.010 14.006 15.999 32.065 39.948];

M=0;
    for p=1:length(molecule_name)

        for q=1:length(atoms)
            if strcmpi(molecule_name(p),atoms(q))
                M=M+mass(q);
                position=q;
            end
        end

        n=str2double(molecule_name(p));

            if n>1
                M=M+(mass(position))*(n-1);
            end

    end
end
Function Code 3 Explaination :
Our last function is to calculate molar mass of individual species.We only need to send molecule name as the input.On inspection we can see all our species are made up of only 6 elements.We specify molar mass of each one.Before starting the loop we initiate the molar mass as 0.The basic idea of this program is that we compare each character of the species with the atoms mentioned above by using strcmpi().If they match then the specific molar mass is added up.This loops for the entire length of the species name.Suppose there is a number present then the strings wont match and the loop will end.We get this number using strdouble().Assuming the number is n then we multiply the molar mass by (n-1) as the mass is already added up one time in the above for loop.We get molar mass M as the output of this function.
Results :
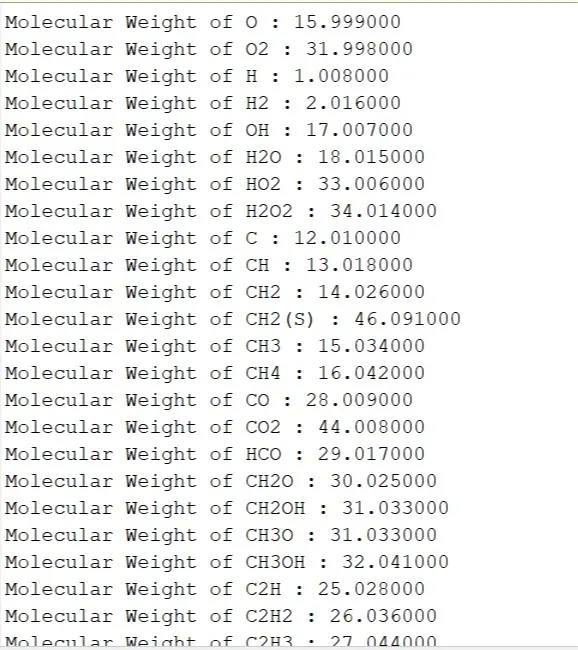
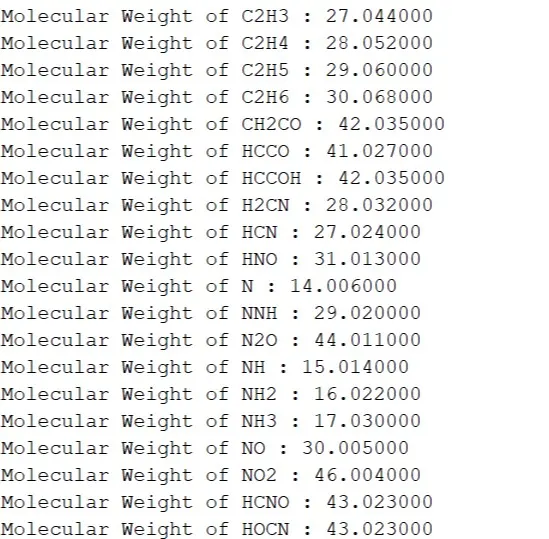
1.Following is the screenshot of command window showing molecular weight of all species.
2.We can see that seperate folders are made in the the project file and each folder has three images stored in them.A screenshot of the same is attached.]
3.After the code is complete the user input message boxes pop up whether we want to dsiplay the graphs or not.
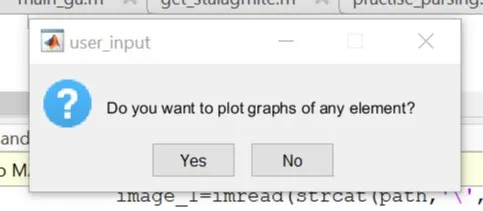
If we click on No than the loop ends and if we select Yes than furhter message box pops up to enter the species name.
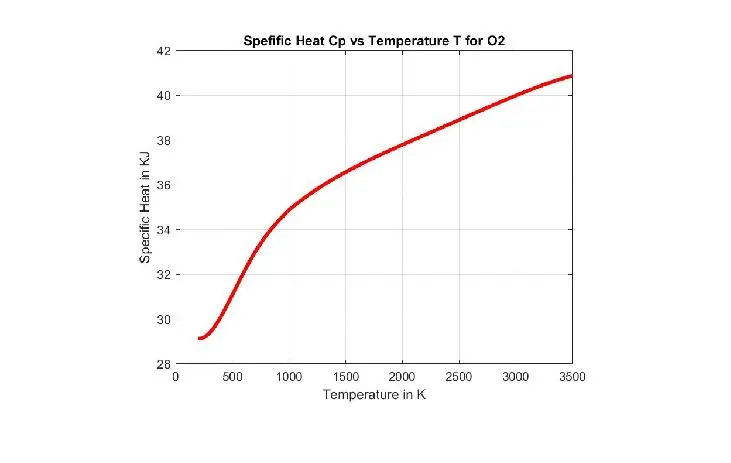
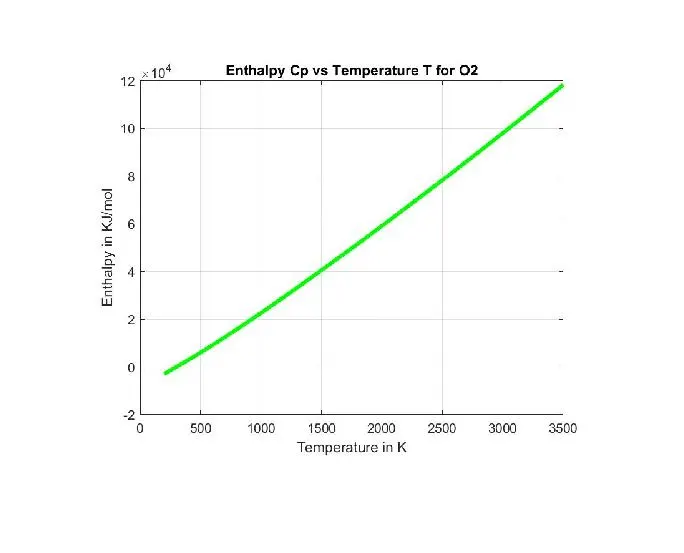
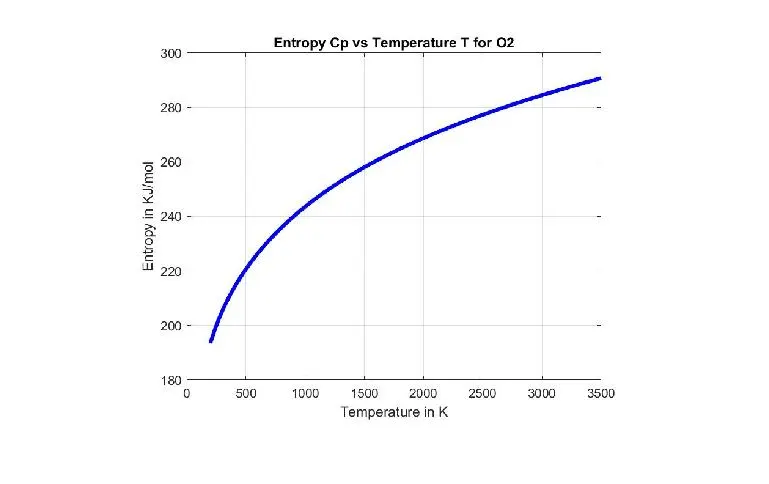
4.If we want to display for O2
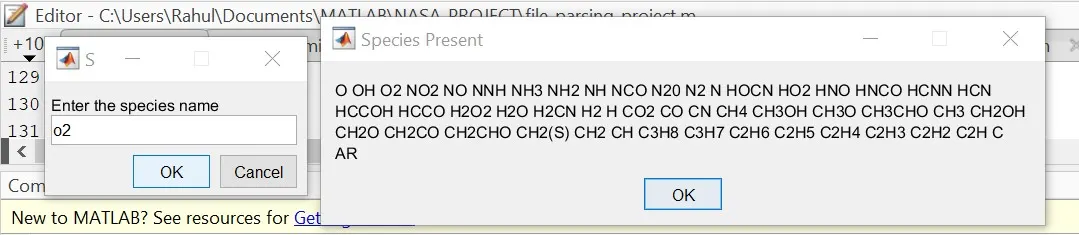
when we enter O2 and hit enter ; three figures pop up.
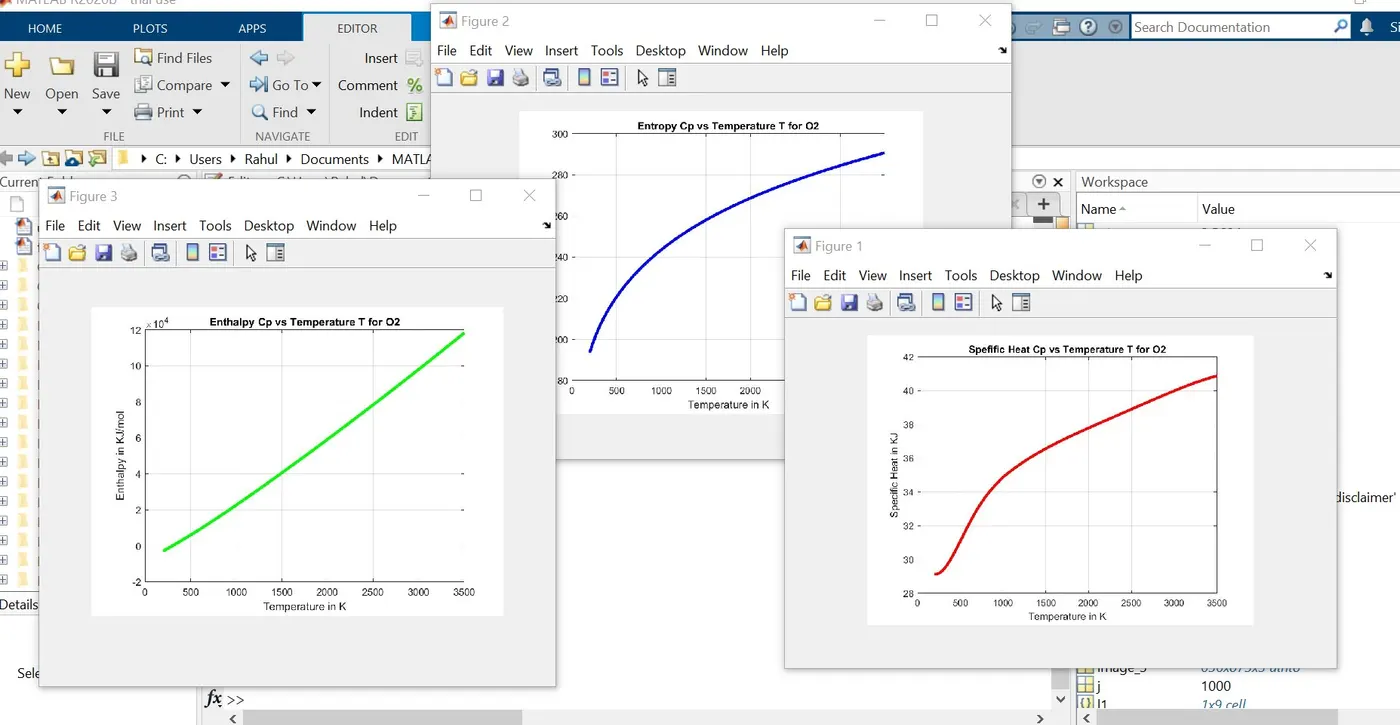
Three Graphs of O2 respectively.
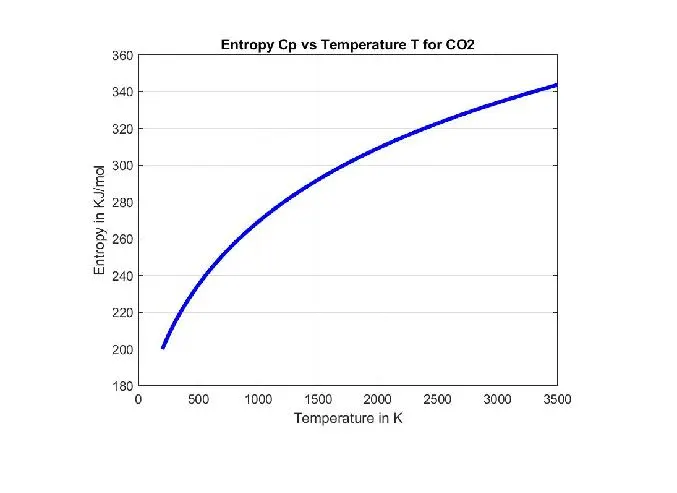
5.If we want to display for CO2
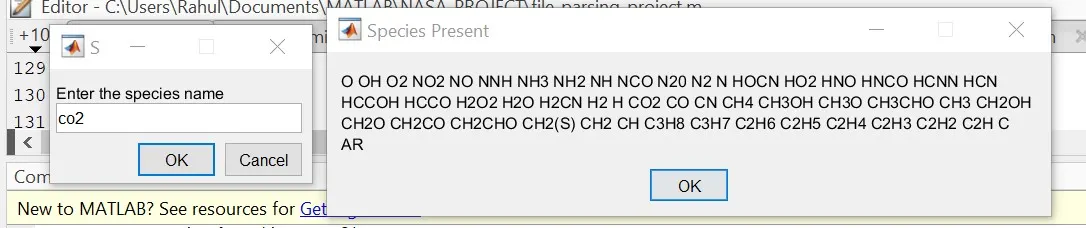
when we enter CO2 and hit enter ; three figures pop up.
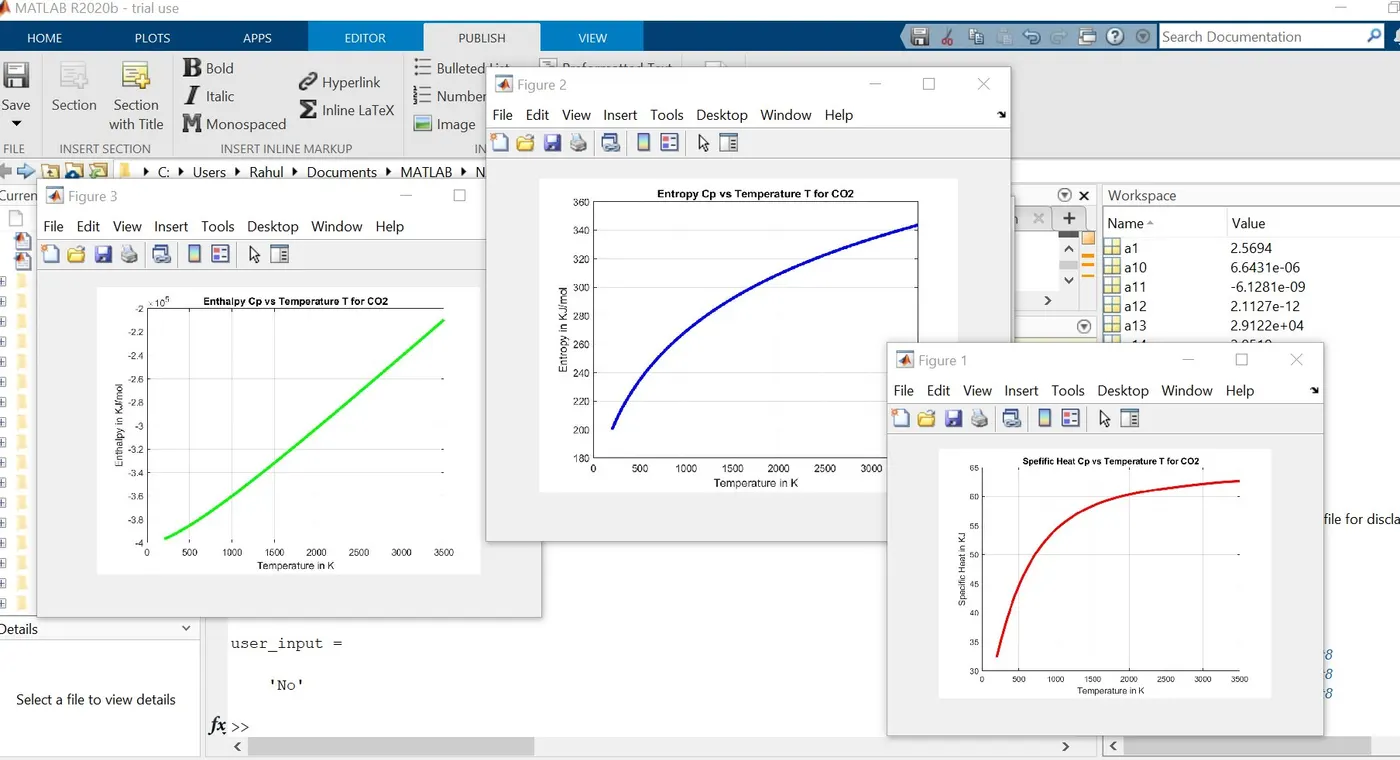
Three Graphs of CO2 respectively.
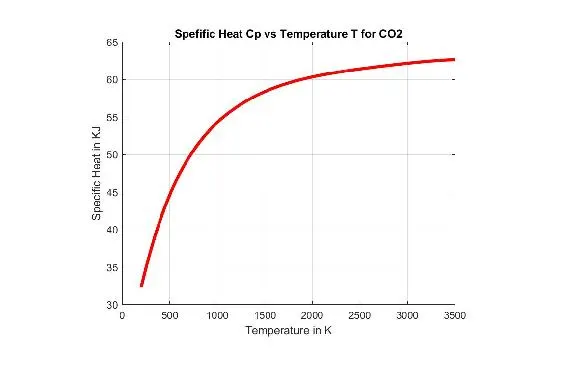
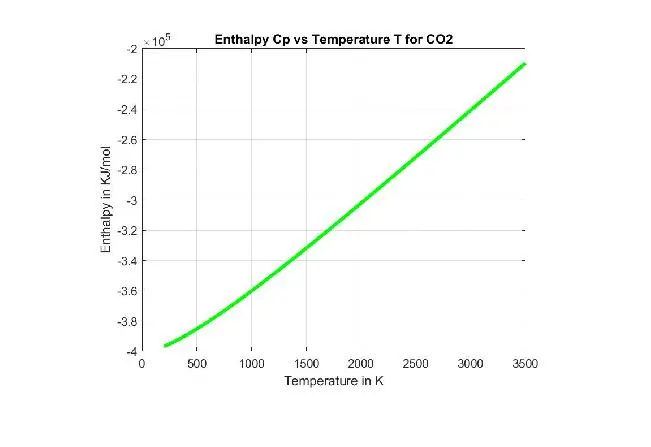
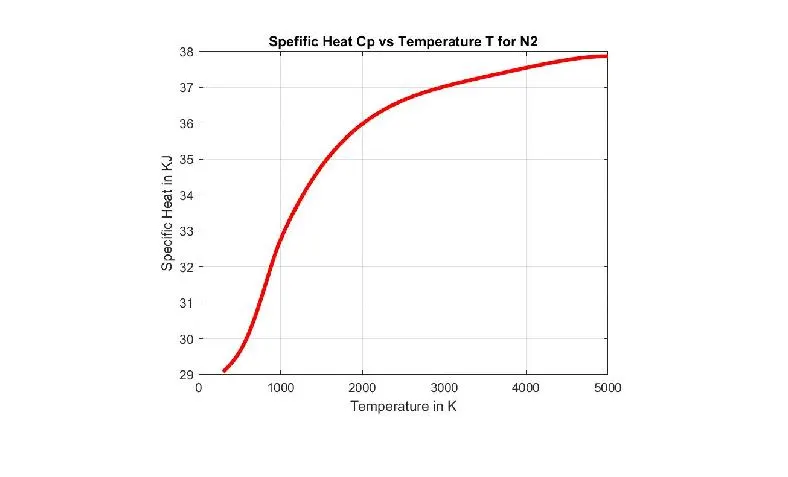
6.If we want to display for N2
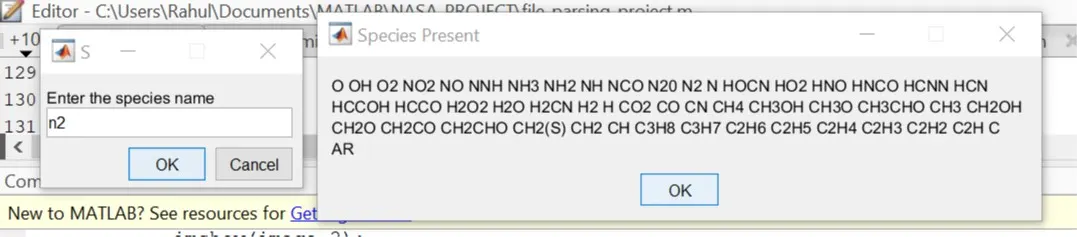
when we enter N2 and hit enter ; three figures pop up.
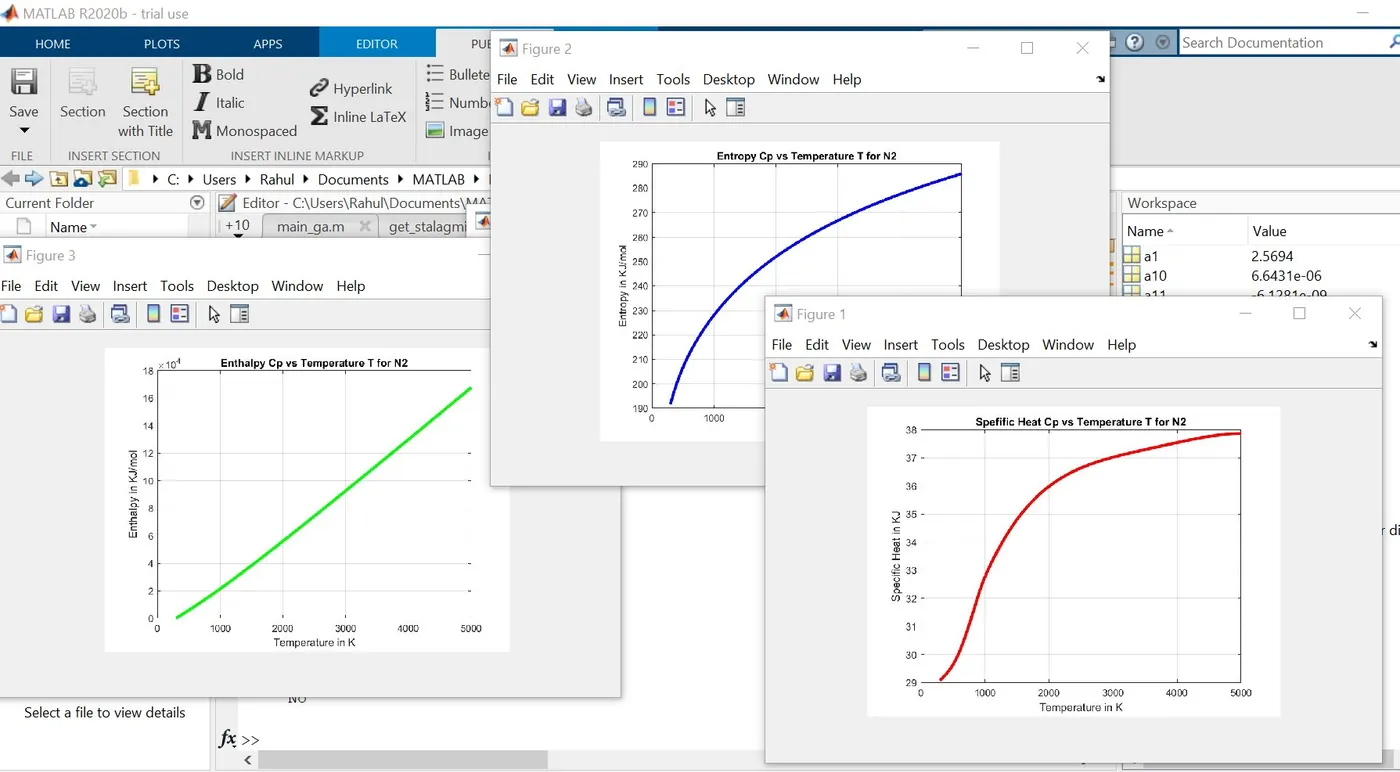
Three Graphs of N2 respectively.
Errors Faced :
1.


This error occured because the species name was an cell array and I used round parenthesis.The error was solved by using curly brackets instead of round.
2.
No error was displayed in the command window but the user input while loop got stuck in infinite iterations because of wrongly putting the counter value 1 after the loop end.To stop the loop the counter should be changed to 1.
Conclusion :
1.We were able to read the NASA data file and extract information for all the 53 species and use that information for calculating specific heat, enthalpy and entropy.
2.We plotted three graphs for each of them and created seperate folder for each one and dumped those graphs in the folder.
3.We calculated the molecular weight of each of the species and display in the command window.
4.We also were able to display graphs of O2 N2 and CO2 by taking user input.
Reference :
1.Youtube
How to read files, parse data and create plots using MATLAB.
https://www.youtube.com/watch?v=t0oNbYJn2Mw
Matlab Random file access
https://www.youtube.com/watch?v=RjJwtzKTi_w
2.Mathwork
All the above mentioned commands used were studied from Mathwork.com