MATLAB File Parsing Program For NASA thermodynamic data
AIM:- Write a MATLAB Program that extracts the 14 co-efficient and calculates the enthalpy, entropy and specific heats for all the species in the data file - NASA Thermodynamic Data
Introduction:-
File Parsing:- Parsing a file means reading in a data stream (or any text file), and further can be used in Programming or representation of the semantic content of that data, in order to facilitate performing some kind of transformation on the data.
Theory:-
Thermodynamic properties- [Specific heat, Enthalpy & Entropy]
Specific heat(Cp)- Specific heat capacity is defined as the amount of heat required to raise the temperature of 1 kilogram of a substance by 1 kelvin (SI unit of specific heat capacity J kg−1 K−1).
Enthalpy (H)- Enthalpy is a property of a thermodynamic system, defined as the sum of the system's internal energy and the product of its pressure and volume.
Entropy (s)- Entropy, the measure of a systems thermal energy per unit temperature that is unavailable for doing useful work. Because work is obtained from ordered molecular motion, the amount of entropy is also a measure of the molecular disorder, or randomness, of a system.
Objective:
- -MATLAB Program to calculates the enthalpy, entropy and specific heats.
- -Calculate the molecular weight of each species anddisplay it in the command window.
- -Plot the Cp, Enthalpy and Entropy for the local temperature range.
- -Create separate folders for each species & Save the plots as image.
MATLAB PROGRAM:-
- MATLAB code to calculates the enthalpy, entropy and specific heatsand plotting the Graph
% File Parsing To Read NASA Thermo Data File % By using Given Data Calculate Enthalpy, Entropy and Specific Heat % Calculate the Molecular Weight of Each Species clear all close all clc % Opening & Reading 'Thermo.dat' Thermo_file = fopen('Thermo.dat','r'); L = fgetl(Thermo_file); % To read next line count = 1; % Usinf While Loop to Compare Lines for 'END' while strcmp(L,'END')==0 count = count+1; L = fgetl(Thermo_file); end num_species = (count-6)/4; % Calculate & Save number of Species frewind(Thermo_file) % Rewind the process for Multiple Iteration H1 = fgetl(Thermo_file); H2 = fgetl(Thermo_file); % Spliting the line From SPACES Global_temp = strsplit(H2,' '); % Saving the Local Minimum/midium/high values in paricular variable Global_min_temp = str2num(Global_temp{2}); Global_mid_temp = str2num(Global_temp{3}); Global_high_temp = str2num(Global_temp{4}); % Using for loop to Skip Comment Lines for l=1:3 H1 = fgetl(Thermo_file); end % Main Program To Extract Coefficient of Species, % To Calculate Specific Heat | Enthaply | Entropy For Different Temperature Range % To Plot the Graph between Temperature|Specific Heat|Enthaply|Entropy % To Calculate the Molecular Mass of Each Species And Print it into Command Window % To Save The Grapgh Into Directory For Every Specdies in Particular Folder for s=1:num_species L1 = fgetl(Thermo_file); L1_split = strsplit(L1,' '); % Saving The Values fo Local Minimum,midium,High temperature in a Particular variable species = (L1_split{1}); local_min_temp = str2num(L1_split{end-3}); local_med_temp = str2num(L1_split{end-1}); local_high_temp = str2num(L1_split{end-2}); % Taking 1000 Values between Local Minimum Temperature and Local High Temperature T = linspace(local_min_temp,local_high_temp,1000); %Read line by line for Coefficient of Species L2 = fgetl(Thermo_file); L3 = fgetl(Thermo_file); L4 = fgetl(Thermo_file); %Locating the Exponential Character and Extracting All the 14 Coefficient % And Save The Coefficient Into A Particular Variable location_E_L2 = findstr(L2,'E'); % Locating the Exponential Character in 1st Line c1 = str2num(L2(1:location_E_L2(1)+3)); c2 = str2num(L2(location_E_L2(1)+4:location_E_L2(2)+3)); c3 = str2num(L2(location_E_L2(2)+4:location_E_L2(3)+3)); c4 = str2num(L2(location_E_L2(3)+4:location_E_L2(4)+3)); c5 = str2num(L2(location_E_L2(4)+4:location_E_L2(5)+3)); location_E_L3 = findstr(L3,'E'); % Locating the Exponential Character in 2nd Line c6 = str2num(L3(1:location_E_L3(1)+3)); c7 = str2num(L3(location_E_L3(1)+4:location_E_L3(2)+3)); c8 = str2num(L3(location_E_L3(2)+4:location_E_L3(3)+3)); c9 = str2num(L3(location_E_L3(3)+4:location_E_L3(4)+3)); c10 = str2num(L3(location_E_L3(4)+4:location_E_L3(5)+3)); location_E_L4 = findstr(L4,'E'); c11 = str2num(L4(1:location_E_L4(1)+3)); % Locating the Exponential Character in 3rd Line c12 = str2num(L4(location_E_L4(1)+4:location_E_L4(2)+3)); c13 = str2num(L4(location_E_L4(2)+4:location_E_L4(3)+3)); c14 = str2num(L4(location_E_L4(3)+4:location_E_L4(4)+3)); % To Create a Folder into The Directory mkdir(['G:#Aaditychallenge7 file parsingSpecies Data',species]) R = 8.3145; % Unversal Gas Constant (J/K.mol) %Calculating Specific Heat | Enthaply | Entropy For Different Temperature Range for i=1:length(T) if T(i)>local_med_temp % Formula To Calculate Specific Heat Cp(i) = R*(c1 + c2*T(i) + c3*T(i)^2 + c4*T(i)^3 + c5*T(i)^4); % Formula To Calculate Enthaply H(i) = R*T(i)*(c1 + c2*T(i)/2 + c3*T(i)^2/3 + c4*T(i)^3/4 + c5*T(i)^4/5 + c6/T(i)); % Formula To Calculate Entropy S(i) = R*(c1*log(T(i)) + c2*T(i) + c3*T(i)^2/2 + c4*T(i)^3/3 + c5*T(i)^4/4 + c7); else % Formula To Calculate Specific Heat Cp(i) = R*(c8 + c9*T(i) + c10*T(i)^2 + c11*T(i)^3 + c12*T(i)^4); % Formula To Calculate Enthaply H(i) = R*T(i)*(c8 + c9*T(i)/2 + c10*T(i)^2/3 + c11*T(i)^3/4 + c12*T(i)^4/5 + c13/T(i)); % Formula To Calculate Entropy S(i) = R*(c8*log(T(i)) + c9*T(i) + c10*T(i)^2/2 + c11*T(i)^3/3 + c12*T(i)^4/4 + c14); end end % Plotting For Temperature|Specific Heat|Enthaply|Entropy % Plotting For Temperature Specific Heat figure(1) plot(T,Cp) xlabel('Temperature [K]') ylabel('Specific Heat [J/Kg.K]') title('Temperature Vs Specific Heat') % Plotting For Temperature Enthaply figure(2) plot(T,H) xlabel('Temperature [K]') ylabel('Enthalpy [KJ]') title('Temperature Vs Enthalpy') % Plotting For Temperature Entropy figure(3) plot(T,S) xlabel('Temperature [K]') ylabel('Entropy [J/k]') title('Temperature Vs Entropy') % Saving Plots in Directory in Different Folder cd(['G:#Aaditychallenge7 file parsingSpecies Data',species]) saveas(1,'Specific Heat','jpg') saveas(2,'Enthalpy','jpg') saveas(3,'Entropy','jpg') %Calculation For Molecular Mass Of Species Atom = ['C','H','O','N','A']; % Create Array To save Species Character into a Variable Atom_wt = [12.01,1.0079,16,14.0067,39.95]; % Create Array To save Atomic Weight into a Variable Mol_mass = 0; % Nested For Loop For Multiple Itration for m = 1:length(species) for n = 1:length(Atom_wt) if strcmp(species(m),Atom(n)); Mol_mass = Mol_mass + Atom_wt(n); x = n; end end z = str2double(species(m)); % To Convert Species Sting Value Into Number if z > 1 % Calculate Moecular Weight Mol_mass = Mol_mass + (Atom_wt(x)*(z-1)); end end % Print The Floating Value Of Molecular Mass fprintf('Molecular mass of %s is = %f n',species,Mol_mass) end
Method/Command Used :-
Commands used in Program:- In order to extract the required data from a given file, we first open the file and save the data into the variables
Thermo_file = fopen('Thermo.dat','r');
Here, I use fopen command to open & read‘Thermo.dat’ file and save it in a variable ‘Thermo_file’
As, their are number of string and number, we need to assign these to different variable, so that can use them as per requirement.
To read data line by line, we use fgetl command
L = fgetl(Thermo_file)- This command read every next line. By using this, we read a file line by line and can save every line in a particular variable.
To make the the program more generic and useful, I use while loop command, in such a way that it compare all the line, to reach the ‘END’ of the line. By doing so, if more species gets added in future to the file, program will calculate the number of species and their coefficient automatically.
strcmp- Use this command to compare all the lines to get the ‘END’ character in the data sheet.
frewind(fileID)- Use this command to reach the beginning of file.strcmp
Strsplit- To split into separate quantity which can be store in variable & do process.
Findstr- use to find the location of a particular character from a string
str2num- this command is used to convert the string into a number
linspace(x1,x2,n)- Generates n points between x1, x2
i use this command to generate the 1000 values between Local Minimum Temperature and Local High Temperature
for- for loop to repeat specified number of time.
mkdir- I use this command to create a folder, as we required to create a folder, so that we can save all the images of the plot to a specific folder. I name the folder as ‘species’ to save images into it
cd- I use this command to change directory(cd), it changes the current folder to new Folder, to save the different files to different folder.
saveas- This command is used to save the plot as jpg Format
Procedure:-
Step1- First I open the Thermo data file using fopen command and save its line in a specific variable.
I use while command next, in such way that it compare all the line by line to get the END character, so that if more species data added to file. The program can run for it. Doing so I calculate the number of species and save it in variable num_species.
Step2- In order extract the data for the Global (Min,Mid,High) Temperature, I use split command to split the line into separate quantity and save it into variable. After that the use fgetl command to skip the comment line, which are not useful.
Step3- Same process of splitting I use in next line to split the line for Local minimum, local medium, local high temperature. Than I use linspace command to get 1000 values between Local low and high temperature range.
Step4- For Extracting the Coefficient of species
The logic I use to extract the coefficient of species is, I examine the data and reach a point that Exponential (e) is a scientific character and is available in every coefficient, so I locate the position of (e) in coefficient by using findstr command.
By doing so, I can locate character (e) and whats its left and right side, is the coefficient of species. Which we can than convert into number from string by using str2num command.
Hence, by doing so we will get all the 14 coefficient of any species, which we save in a particular variable line by line.
Step5- Here I create a directory using mkdir command in my system to save all the plot of different species in particular folder.
Step6-Calculating Specific Heat | Enthaply | Entropy For Different Temperature Range
In this, it is most important step, where, we have to calculate the Specific Heat, Enthaply, Entropy For Different Temperature Range and plot the graph for them. For that I use given formula-

Here, by using above formula, I put the value of coefficient and temperature, in for loop
I also use if else command inside form loop, so that if temperature is smaller that Local medium temperature it will take first seven coefficient, and if temperature is greater than Local medium temperature it eill take next 7cofefficient.
Also I put the value for Universal Gas Constant(R)=
R = 8.3145
Step7- After calculating I put these value to plot the graphs between
Temperature Vs Specific Heat
Temperature Vs Enthalpy
Temperature Vs Entropy
-And save these plot as .jpg format by using saveas command in the system directory by using cd command.
Step8- Calculation For Molecular Mass Of Species
Here in this last and very important part, we need to calculate the Molecular Mass of the species.
- For that I firstly create Two array first to save Atoms name (Atom = ['C','H','O','N','A']) second to put the values for all Atoms weight In same order as Atom name(Atom_wt = [12.01,1.0079,16,14.0067,39.95])
- To calculate the Molecular Mass I use nested for loop initialize by variable Mol_mass = 0.
- First for loop run for total length of species and second for loop run for the total length of Atom weight
- Than I use strcmp command to compare each character of species with the Atom array, in if command in such a condition that it calculate the molecular mass by adding molecular mass(initialize as 0) with atomic weight of each species .-- Formula(Mol_mass = Mol_mass + Atom_wt(n))
- while comparing if we get a numeric value in species name, we save it in different variable x
- Outside our for loop, to get the exact numeric value in species we use the command str2double and convert it from string to number. And save it in new variable z.
- After getting the numeric value in species, in order to calculate the molecular mass, we use if command, so that if the value is greater than 1, it will take the 1st character to add multiple time as that the numeric value in Atomic weight--
Mol_mass = Mol_mass + (Atom_wt(x)*(z-1)
NOTE:- This nested for loop runs in such a way that if their is any numeric value after the any character in species name, it will than extract that value convert into number and add that times of previous character in the formula and calculate the molecular mass of the species.
Example- (O2)- what will happens, it extract 2 from string and convert it into number and add O+O to get the Atomic weight of O2
Step8- After getting the Molecular Mass I use fprintf to print, by using %s and %f, i print the string and floating values of Molecular Mass.
Results:-
Result-1 Molecular weight of each species and display it in the command window.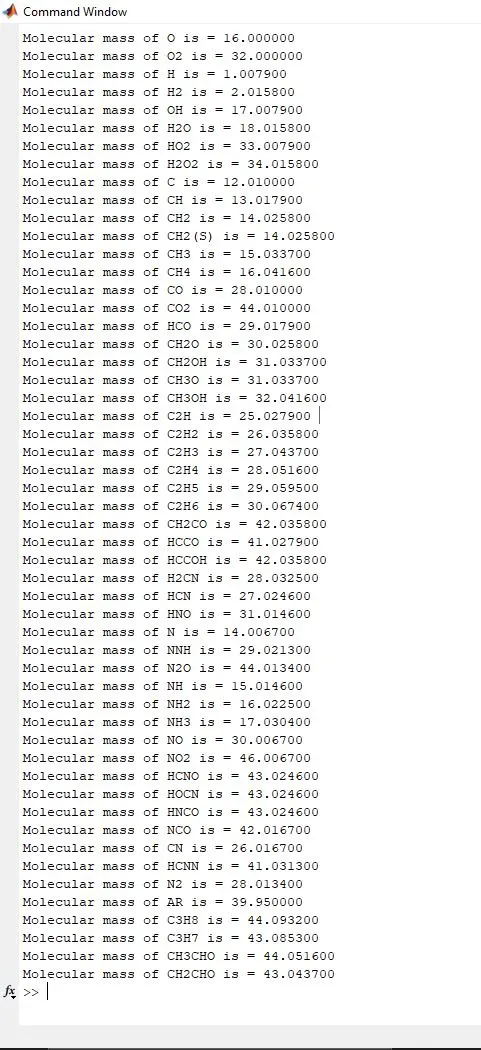
Result-2 Plot the Cp, Enthalpy and Entropy for the local temperature range 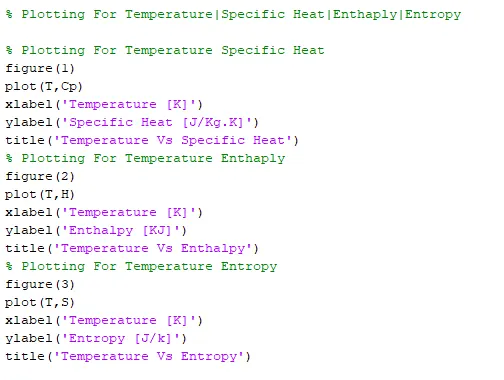
Result-3 Save the plots as images 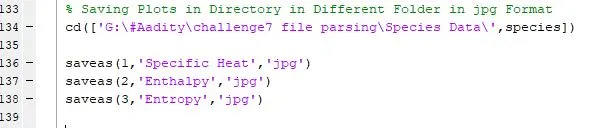
Result-4 Screenshot of the window where all the folders are saved.

Result-5 Plots for o2, N2 and Co2 species
- Plot for O2
Plotting between Temperature and Specific Heat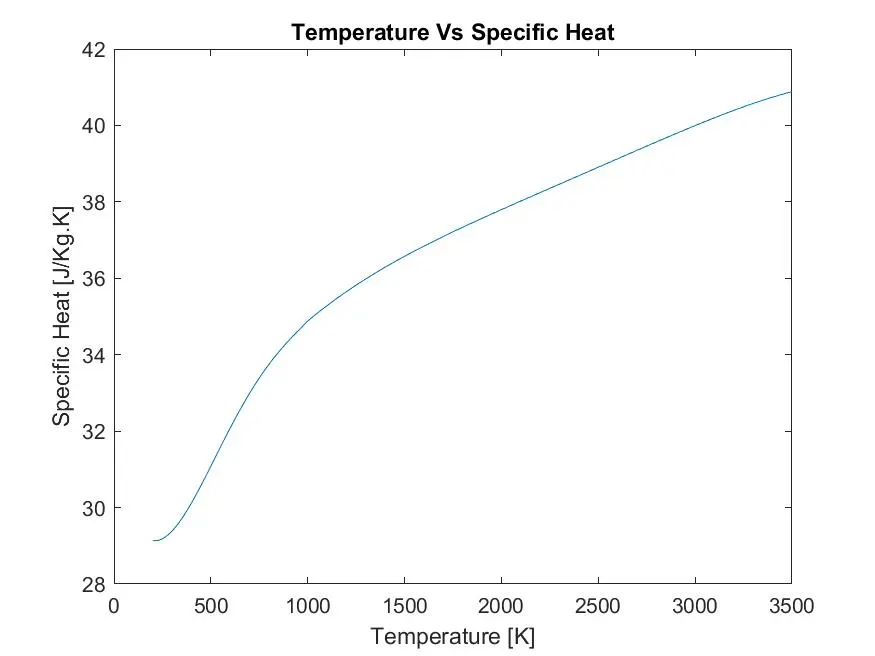
Plotting between Temperature and Enthaply
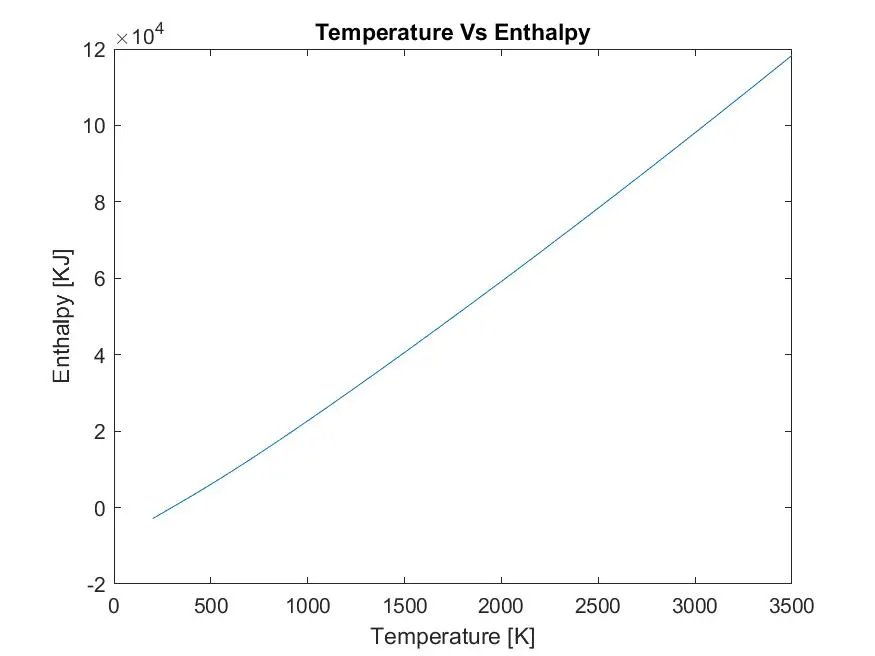
Plotting between Temperature and Entropy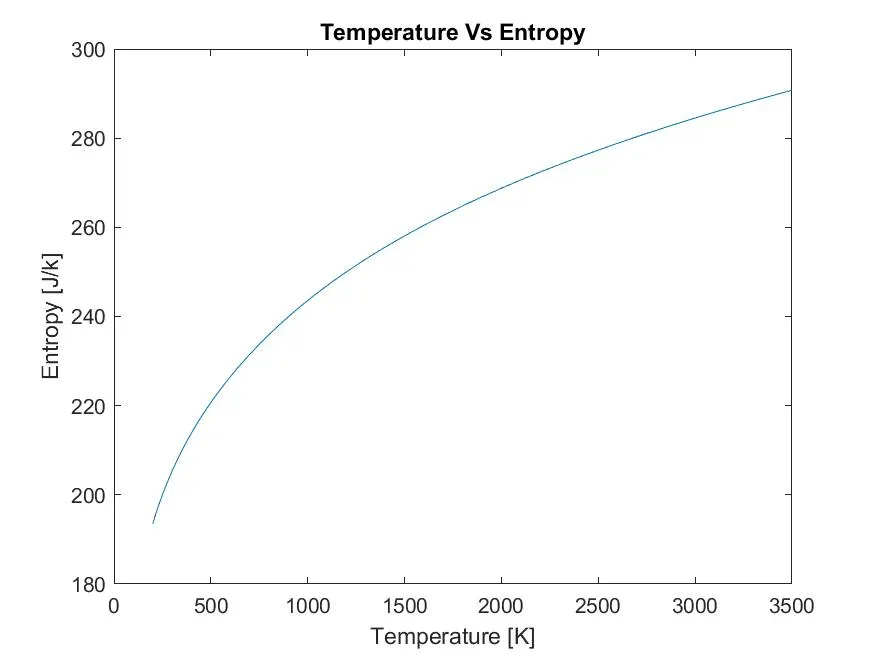
- Plot for N2
Plotting between Temperature and Specific Heat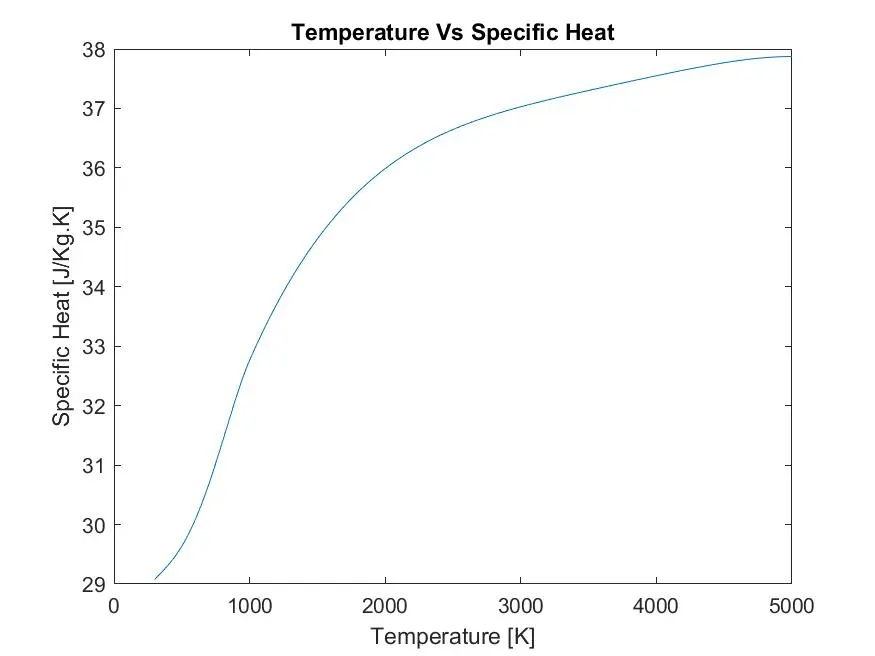
Plotting between Temperature and Enthaply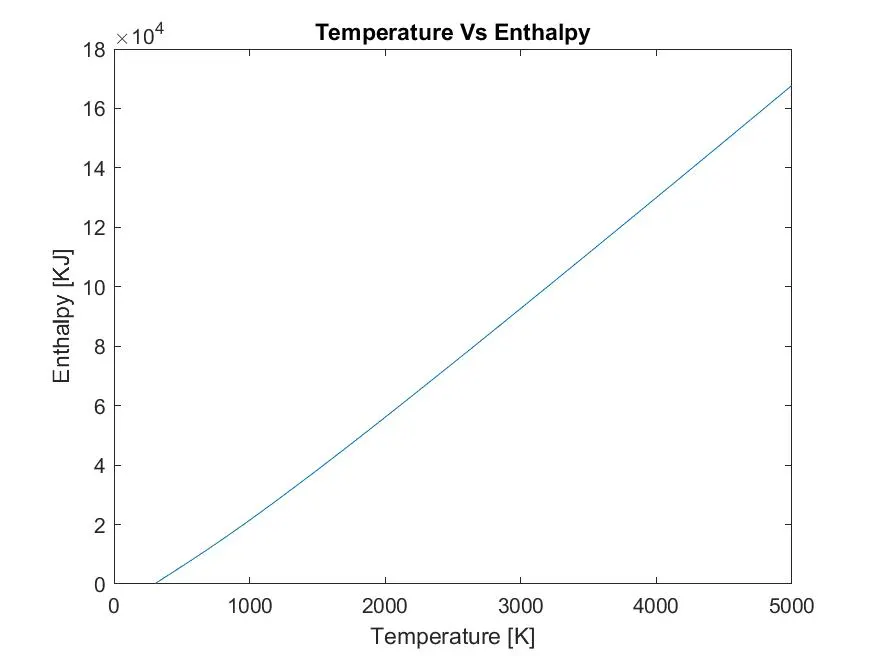
Plotting between Temperature and Entropy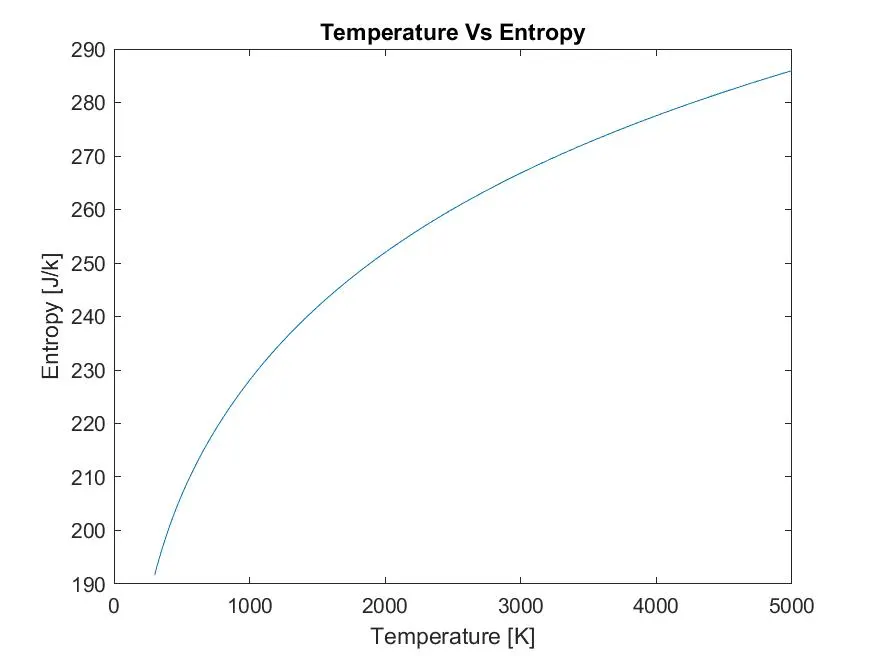
- Plot for CO2
Plotting between Temperature and Specific Heat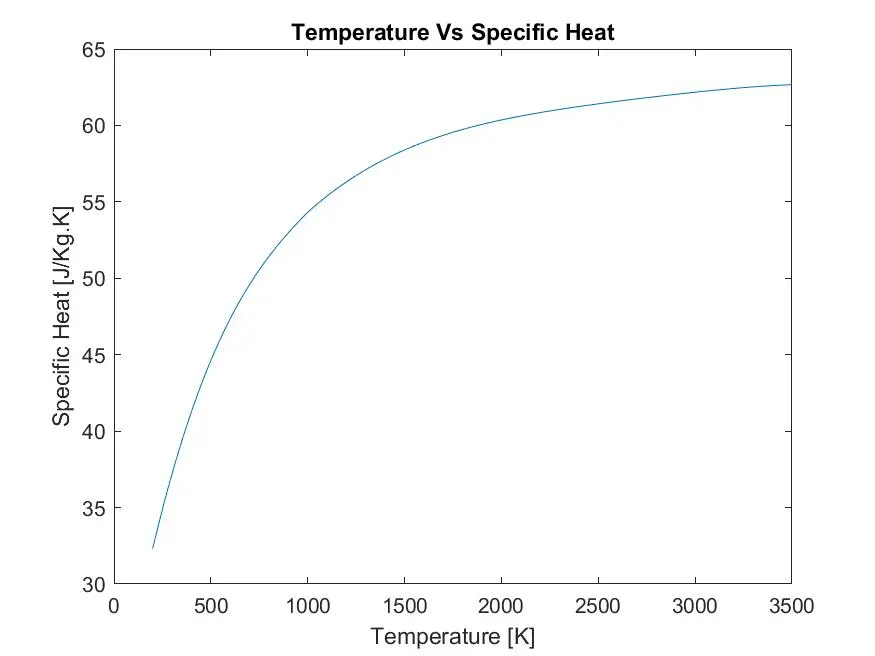
Plotting between Temperature and Enthaply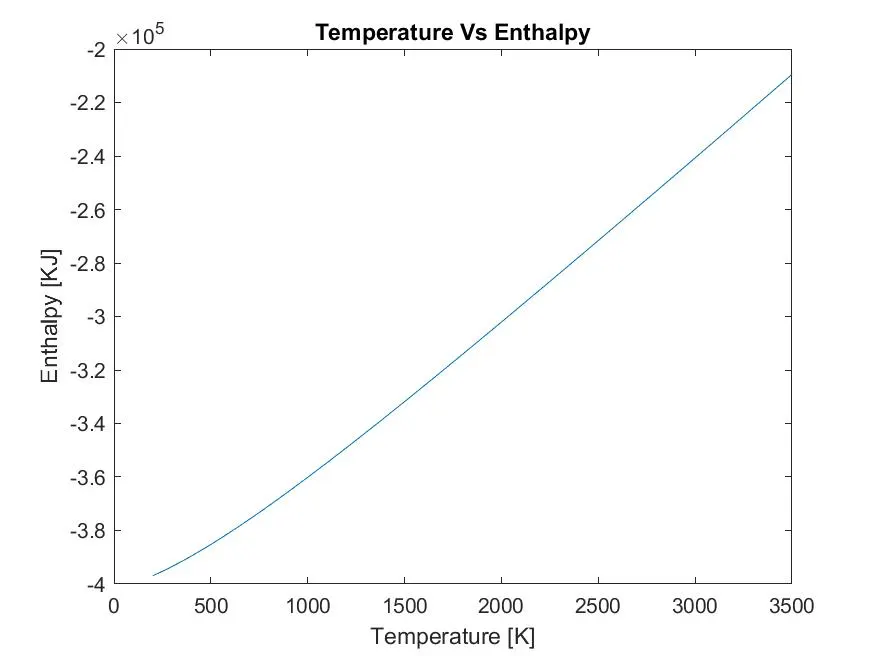
Plotting between Temperature and Entropy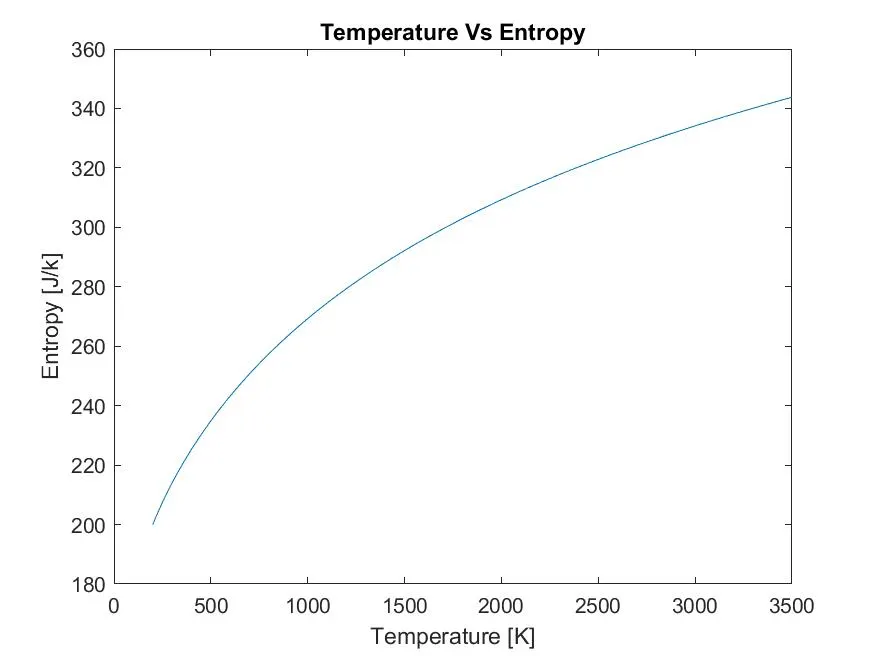
Workspace Of Programme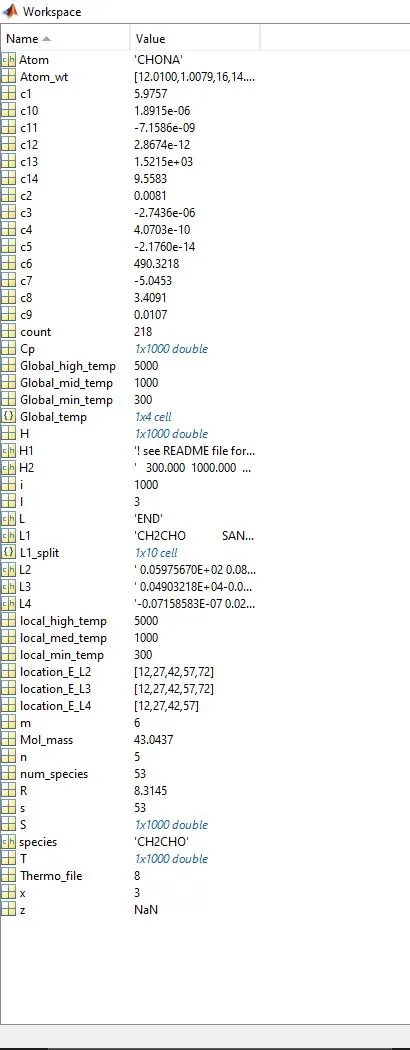
Errors:-
I face many problem while making the program, one sharing some are:-
Command Window
Editor window
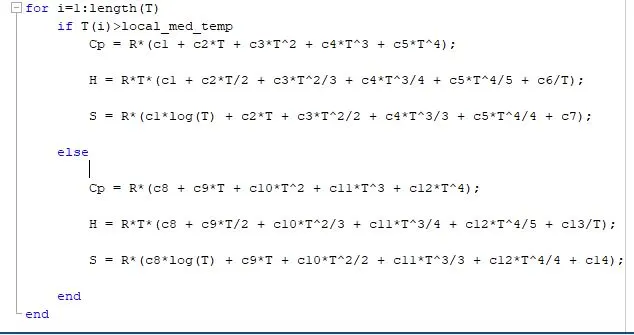
In above error, it apperas beacause i did'nt use "." product while multiplying the matrix, to overcome it i recheck it and apply the "." product.
Also in this same place i did mistake by not taking calculating the Cp,H,S for different temperature range
to overcome this i multiply every coefficient to the length of trmperatured
below i am sahring picture after recorrection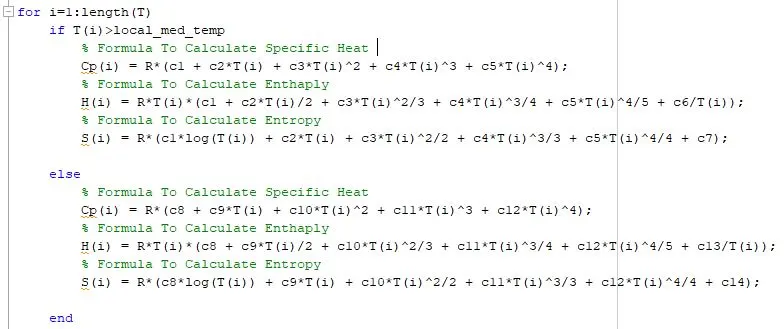
Links and references:-
For Atomic Mass- https://www.angelo.edu/faculty/kboudrea/periodic/structure_mass.htm
https://drive.google.com/drive/folders/1KncPU0dJvX1b8f0h8q_PcedFhjzCV85f