MATLAb Programme to solve an otto cycle.
AIM:- To Write a Code that can solve an Otto Cycle and make Plots for it.
Theory:-
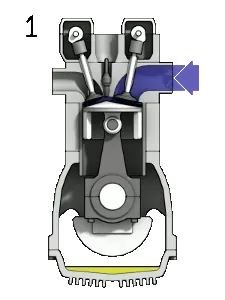
Otto Cycle : The Otto cycle is a set of processes used by spark ignition internal combustion engines (2-stroke or 4-stroke cycles). These engines
- ingest a mixture of fuel and air,
- b) compress it,
- c) cause it to react, thus effectively adding heat through converting chemical energy into thermal energy,
- d) expand the combustion products, and then
- e) eject the combustion products and replace them with a new charge of fuel and air.
- The different processes are shown in Figure.
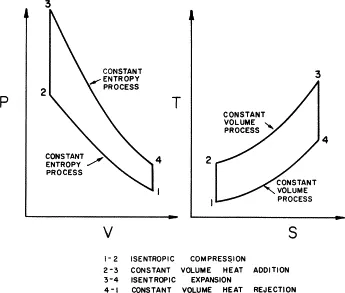
The Otto cycle 1 → 2 → 3 → 4 consists of following four processes:-
Process 1 → 2: Reversible adiabatic compression of air;
Process 2 → 3: Heat addition at constant volume;
Process 3 → 4: Reversible adiabatic expansion of air;
Process 4 → 1: Heat rejection at constant volume.
Since processes 1 → 2 and 3 → 4 are adiabatic processes, the heat transfer during the cycle takes place only during processes 2 → 3 and 4 → 1, respectively
Objective:-
- Thermal efficiency of the engine.
- Plot PV Diagram
Procedure:
Step 1- Firstly we need to assign the values for Engine Parameters
Engine Geometric Parameters;
bore = 0.1
stroke = 0.1
con_rod = 015
cr = 12
Step 2- Now, At state-1 we will provide the values-
gamma = 1.4
t3 = 2300
p1 = 101325
t1 = 500
Step 3- Typed coding to Calculate the pressure, volume, temperature & at all the States(2,3,4) by using the Thermodynamics Equations in the code.
Also I write the code to get the Thermal Efficiency as output.
Step4- Here, this is most important step, where I am coding and generating a function for calculating the ratio of swept volume by clearance volume,
which means how the volume is changing inside the cylinder at every process.
I did this to get the exact work done by the engine, and to represent it on the graph.
To code this function I use the formula (V/Vc) by dividing it in small terms so that to make it easy in code.
Then put the all the terms according to the formula.
Step5- After the function is created I call the function inside the code to get the points for all the process and join them according to the process.
Step6- Finally I plot all the point of Pressure And Volume on PV- Diagram and join them according to the process taking place inside the cylinder.
also I plot the output of Thermal Efficiency on the PV -Diagram.
Formulas:
- Change in Volume inside the Combustion Chamber=

Where;-
V = Swept Volume
Vc = Clearance Volume
rc = Compression Ratio
R = Radius of Piston
- Thermal Efficiency =
nth = 1 - 1/(cr^gamma-1)
Where;-
nth = Thermal Efficiency
cr = Compression ratio
MATLAB PROGRAMME:-
- Matlab code to get the Graphical representation of PV-Diagram Of Otto Cycle
And Thermal Efficiency as the Outputs
clear all
close all
clc

%Inputs
gamma = 1.4;
t3 = 2300;

%Engine Geometric Parameters
bore = 0.1;
stroke = 0.1;
con_rod = 015;
cr = 12;

%State Variables At Point 1
p1 = 101325;
t1 = 500;

 %Calculate The Swept Volume And The Clearance Volume
 v_swept = (pi/4)*bore^2*stroke;
 v_clearance = v_swept/(cr-1);

 v1 = v_swept + v_clearance;
 v2 = v_clearance;

 %State Variables At State point 2
 %p2v2^gamma = p1v1^gamma
 %To calculate p2 = p1(v1/v2)*gamma = p1*cr^gamma
 p2 = p1*cr^gamma;

 %p1v1/t1 = p2v2/t2 | t2 = p2v2*t2/(p1*v1)
 t2 = p2*v2*t1/(p1*v1);

 constant_c = p1*v1^gamma;
 V_compression = engine_kinem(bore,stroke,con_rod,cr,180,0);

 P_compression = constant_c./V_compression.^gamma;

 %State variable at state point 3
 v3 = v2;

 %p3v3/t3 = p2v2/t2 | p3 = p2*t3/t2
 p3 = p2*t3/t2;

 constant_c = p3*v3^gamma;
 V_expansion = engine_kinem(bore,stroke,con_rod,cr,0,180);

 P_expansion = constant_c./V_expansion.^gamma;

 %state variable aty state point 4
 v4 = v1;

 %p3v3^gamma = p4v4^gamma | p4 = p3*(v3/v4)^gamma
 p4 = p3*(v3/v4)^gamma;


 %output- Thermal Efficiency - Graphical representation
 %Thermal Efficiency = nth = 1 - 1/(cr^gamma-1)
 nth = 1 - 1/(cr^gamma-1)

 figure(1)
 hold on
 plot(v1,p1,'*','color','b')
 plot(v2,p2,'*','color','b')
 plot(v3,p3,'*','color','b')
 plot(v4,p4,'*','color','b')
 grid on

 plot(V_compression,P_compression,'color','m')
 plot([v2 v3],[p2 p3],'color','m')
 plot(V_expansion,P_expansion,'color','m')
 plot([v4 v1],[p4 p1],'color','m')
 title('Otto Cycle','fontsize',30)


 text(v1,p1,'state-1')
 text(v2,p2,'state-2')
 text(v3,p3,'state-3')
 text(v4,p4,'state-4')

%  text(5*10^(-4),4*10^6,['Thermal Efficiency(nth) = 1 - 1/(cr^g^a^m^m^a-1)','fontsize',15])
 text(5*10^(-4),4*10^6,[ sprintf('Thermal Efficiency=%d',nth)])


 xlabel('Volume')
 ylabel('Pressure')
- Matlab Coding to create the Function named engine_kinem as follows:-
function[V] = engine_kinem(bore, stroke, con_rod, cr, start_crank, end_crank)


a = stroke/2;
R = con_rod/a;


v_s = pi/4*bore^2*stroke;
v_c = v_s/(cr-1);


theta = linspace(start_crank,end_crank,100);

term1 = 0.5*(cr-1);
term2 = R +1 -cosd(theta);
term3 = (R^2 - sind(theta).^2).^0.5;

V = (1 + term1*(term2 - term3)).*v_c;


end
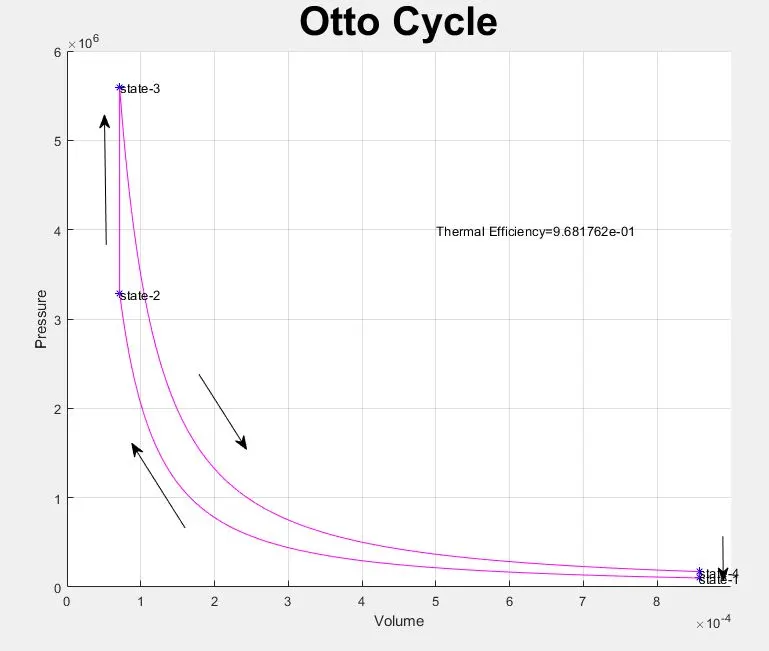
Result:- Otto cycle Graph & Thermal Efficiency Obtained as Follows:-
Otto Cycle is Thermodynamics Process occurs in any Internal Combustion Engine. By Coding MATLAB Programme we can Visualize our Data.
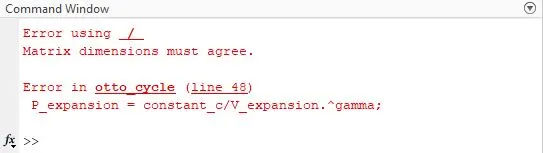
Errors:- The errors, i faced while coding the Programms are mostly due to the mistyped the alphabet, ehich i overcome by checking my programme again.
I am overcoming thses by the programme slowly and checking it 2times beofor executing