Project 1 - Parsing NASA thermodynamic data
Aim:
Write a code in MATLAB to perform file parsing for NASA thermodynamic data.
Objective:
Write a code in MATLAB to extract 14 coefficients of different species from given NASA data file THERMO.dat and to calculate enthalpy, entropy and specific heat of all species.
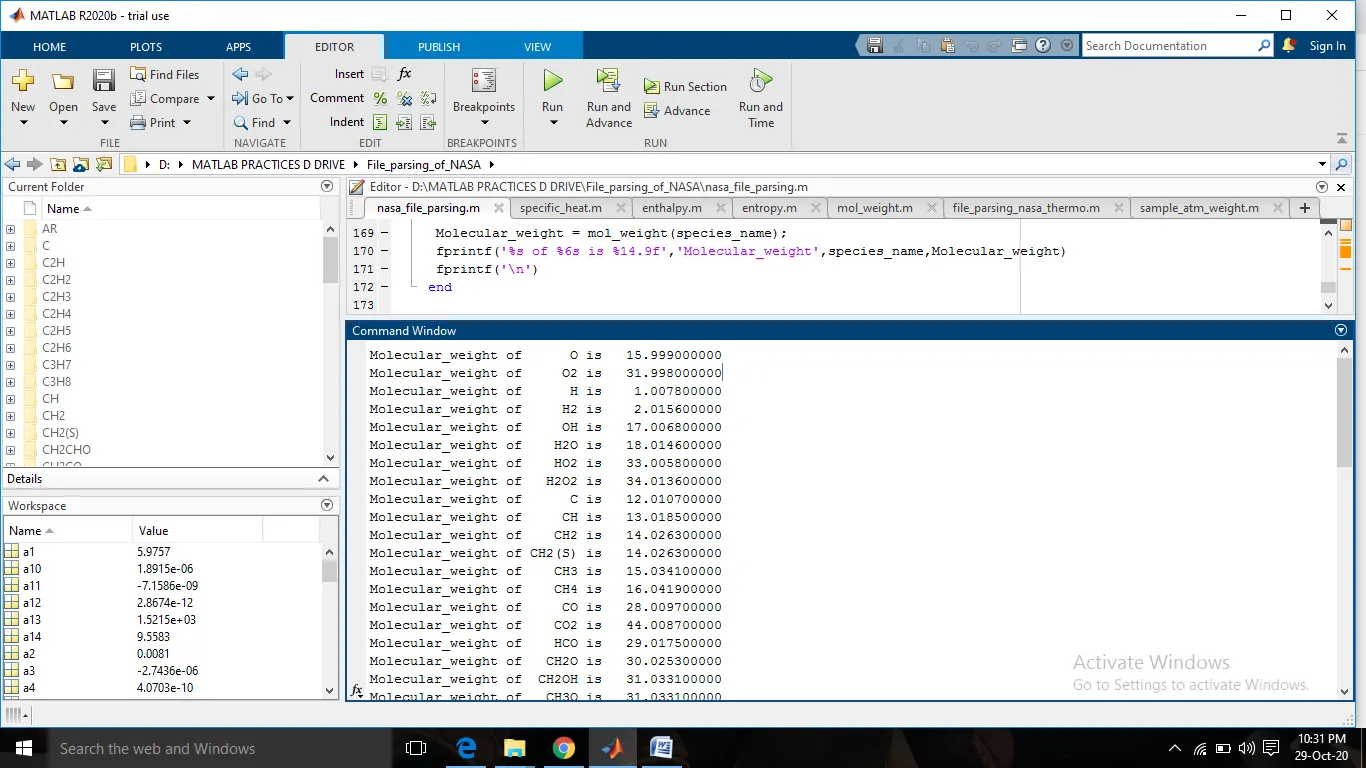
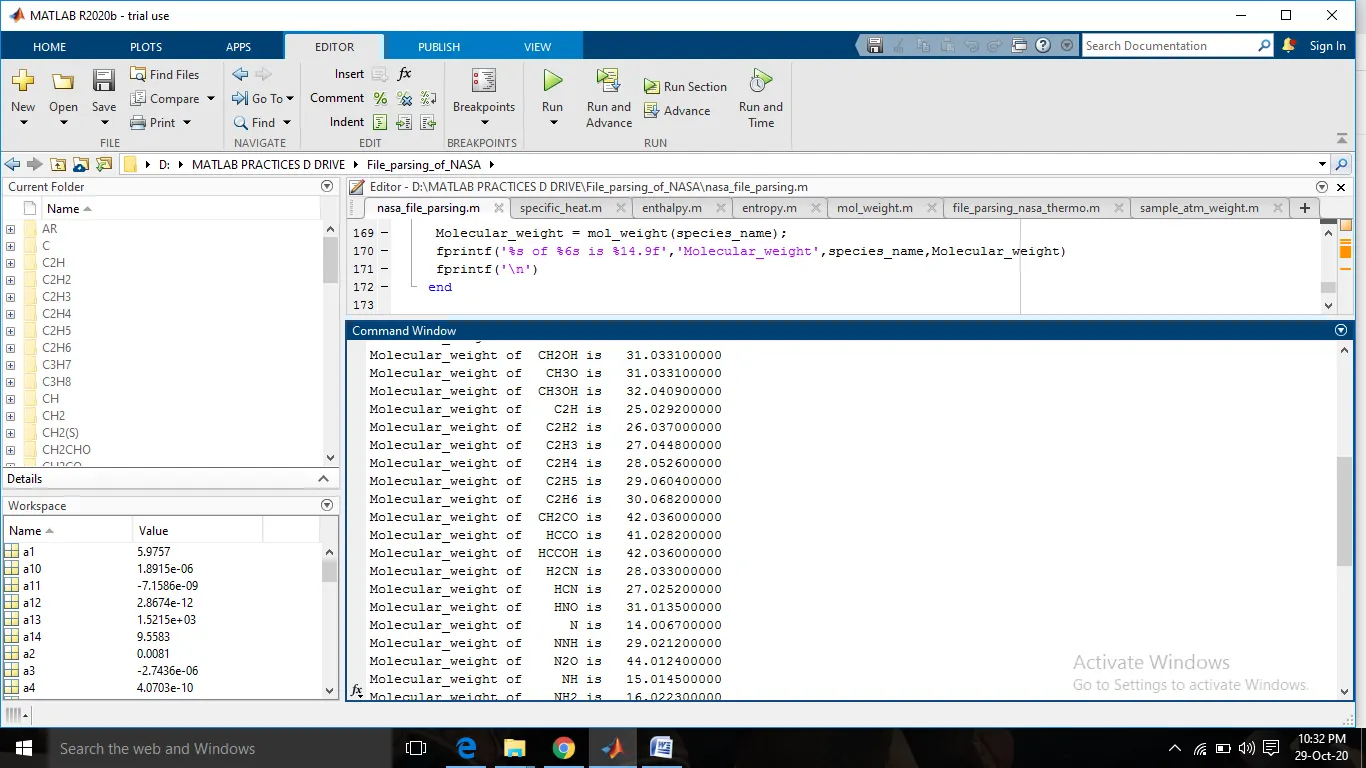
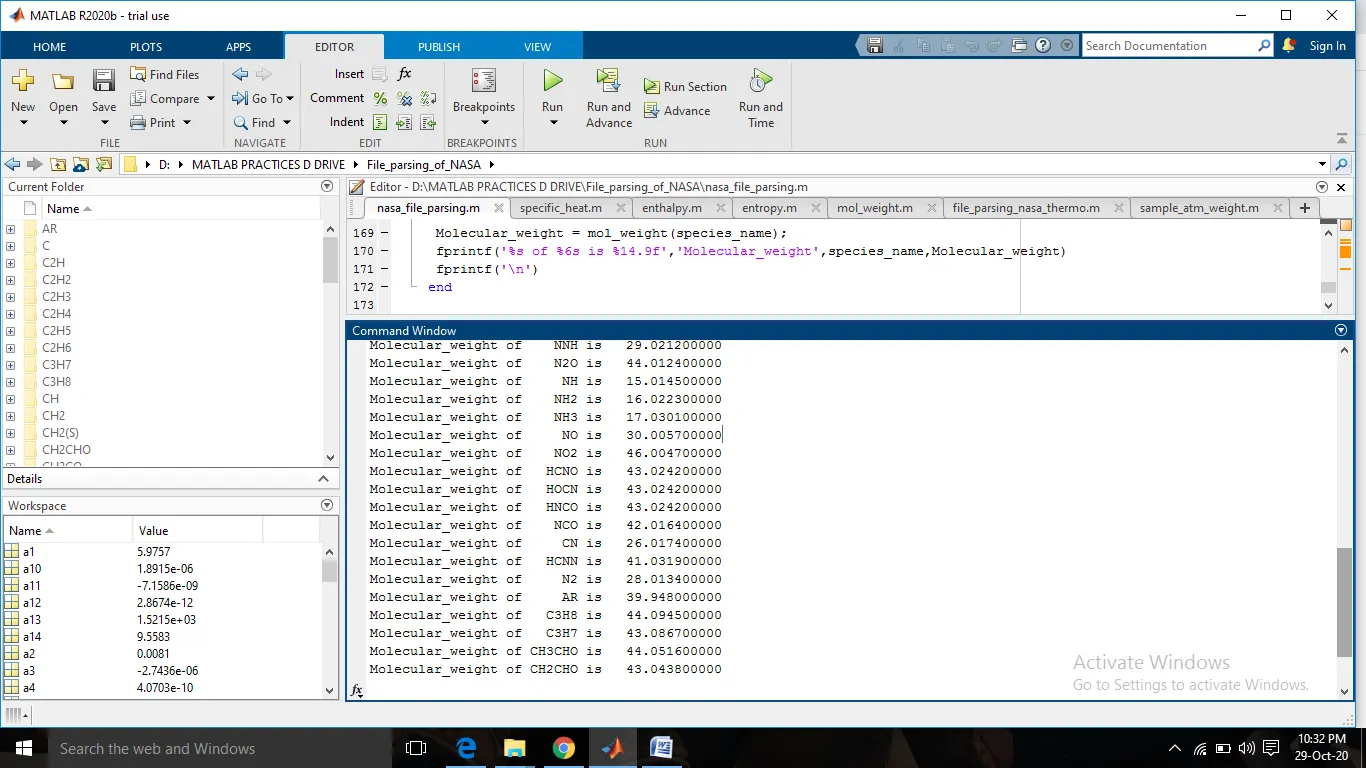
Calculate the molecular weight of all species.
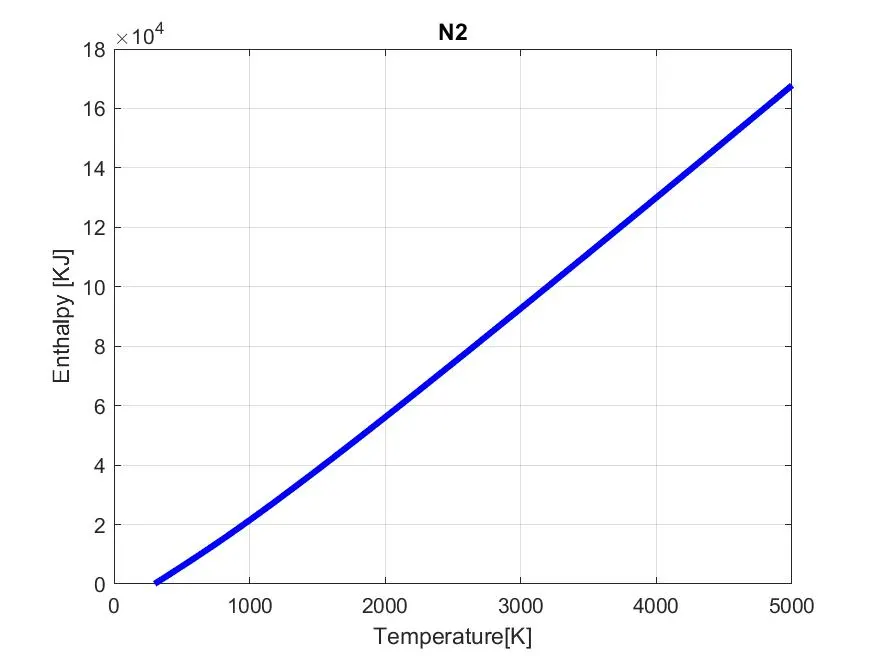
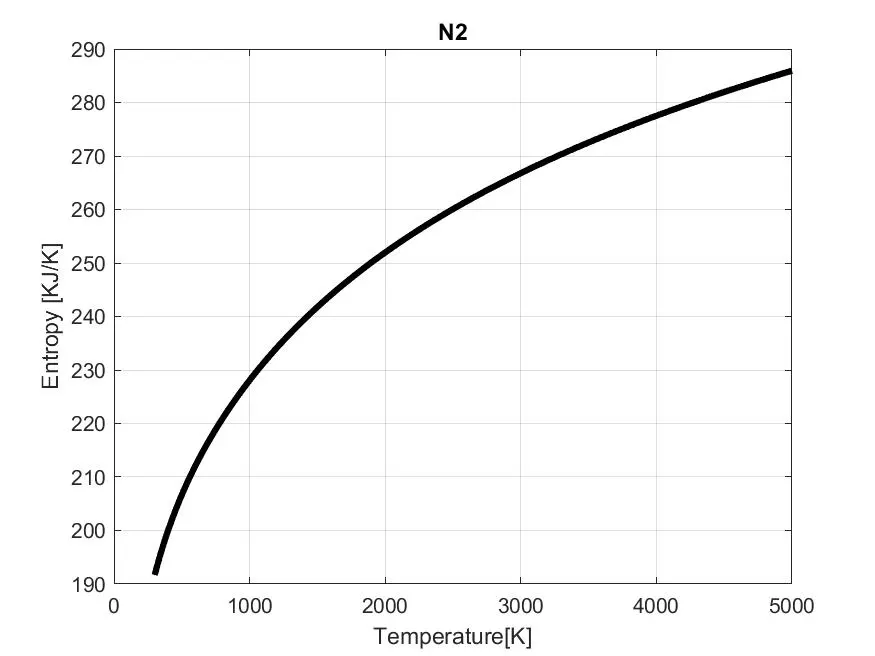
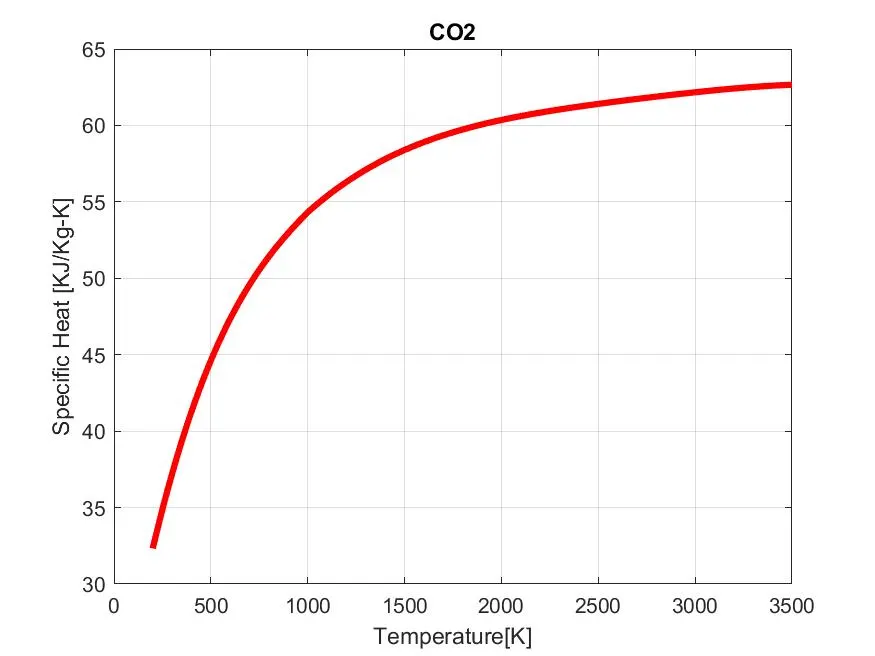
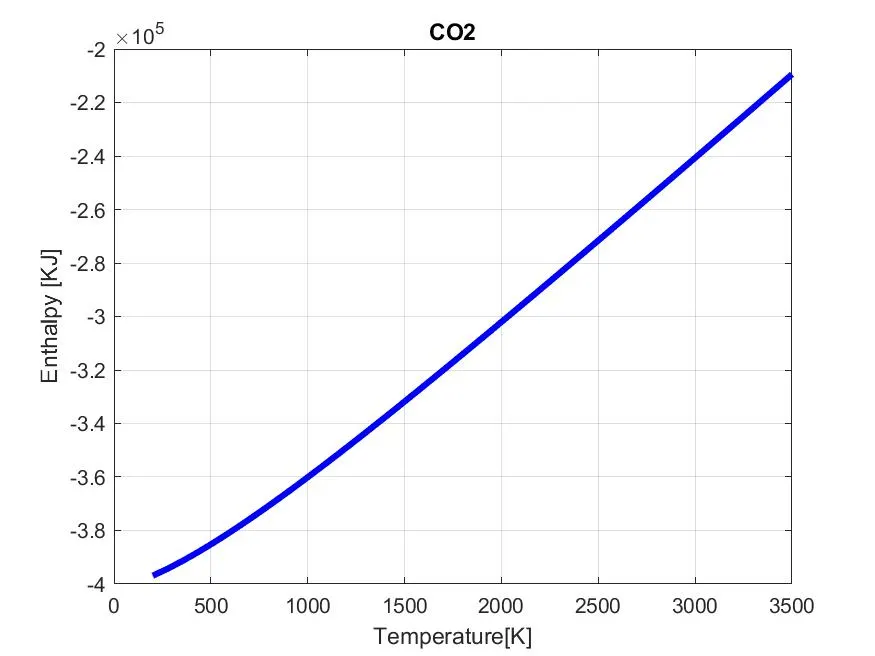
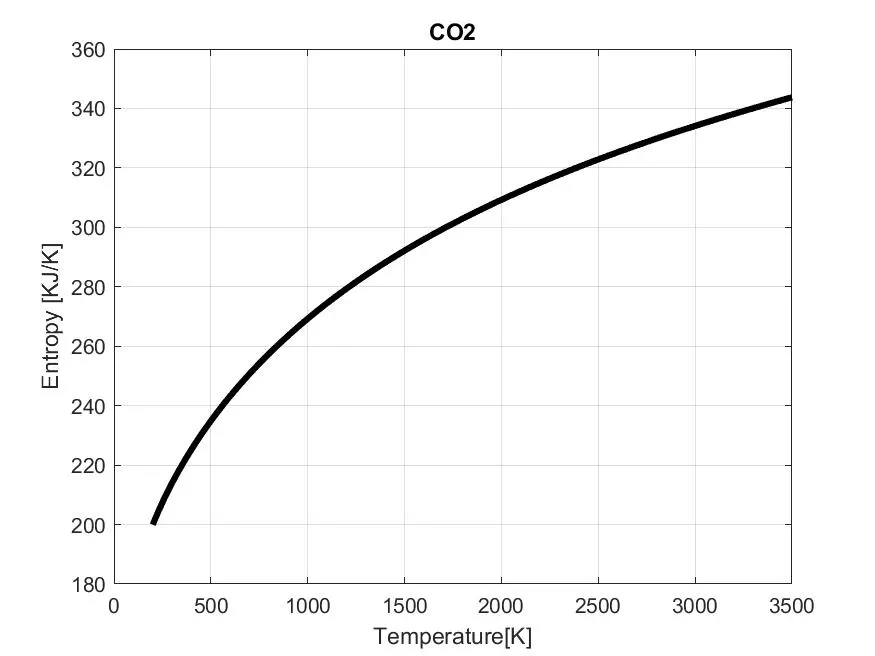
To plot specific heat Cp, enthalpy H, entropy S v/s local temperature for O2, N2, CO2.
Theory:
Formula to calculate Cp, H, S are given below.

Where Cp is specific heat, H is enthalpy, S is entropy.
R is the universal gas constant, T is the local temperature and first 7 coefficients are high-temperature coefficients(a1 to a7) and the second 7 coefficients are low-temperature coefficients(a8 to a14).
MATLAB code:
clear all
close all
clc

%opening the file
f1 = fopen('THERMO.dat','r');

%getting line-1
line_1 = fgetl(f1);   %skip this line

%line -2 containing global temperature values
global_temp = fgetl(f1);    %global temp range values

global_temp_values = strsplit(global_temp,' ');

%skipping next three lines
line_3 = fgetl(f1);
line_4 = fgetl(f1);
line_5 = fgetl(f1);

%extracting global temp values from line-2 and converting them from strings to numbers
global_low_temp = str2num(global_temp_values{2});
global_mid_temp = str2num(global_temp_values{3});
global_high_temp = str2num(global_temp_values{4});

%Universal Gas Constant R in J/mol-K
R = 8.314 ;

%getting species information and coefficients
%there are 53 species

 for i = 1 : 53

    %first line of species
    tline = fgetl(f1);

    %getting species name
    species_name_1 = tline(1:10);

    %emitting unnecessary spaces/blanks
    species_name = deblank(species_name_1);

    %extracting local temperature values
    local_temp = tline(49:78);
    local_temp_values = strsplit(local_temp,' ');
    local_low_temp = str2num(local_temp_values{1});
    local_mid_temp = str2num(local_temp_values{3});
    local_high_temp = str2num(local_temp_values{2});

    %storing all 3 into single variable
    local_temperature_values = [ local_low_temp  local_mid_temp  local_high_temp];

    %splitting  local temperature range for plots
    local_temperature_range = linspace(local_low_temp,local_high_temp,500);
    T = local_temperature_range;

    %extracting coefficients of species
    co_effs_line1 = fgetl(f1);
    a_l1 = strfind(co_effs_line1,'E');

    %extracting co-efficients from this line

   a1 = co_effs_line1(1:a_l1(1)+3);
   a1 = str2num(a1);
   a2 = co_effs_line1(a_l1(1)+4:a_l1(2)+3);
   a2 = str2num(a2);
   a3 = co_effs_line1(a_l1(2)+4:a_l1(3)+3);
   a3 = str2num(a3);
   a4 = co_effs_line1(a_l1(3)+4:a_l1(4)+3);
   a4 = str2num(a4);
   a5 = co_effs_line1(a_l1(4)+4:a_l1(5)+3);
   a5 = str2num(a5);

   %marching to next line
   co_effs_line2 = fgetl(f1);
   a_l2 = strfind(co_effs_line2,'E');

   %extracting coeffcinets from this line

   a6 = co_effs_line2(1:a_l2(1)+3);
   a6 = str2num(a6);
   a7 = co_effs_line2(a_l2(1)+4:a_l2(2)+3);
   a7 = str2num(a7);
   a8 = co_effs_line2(a_l2(2)+4:a_l2(3)+3);
   a8 = str2num(a8);
   a9 = co_effs_line2(a_l2(3)+4:a_l2(4)+3);
   a9 = str2num(a9);
   a10 = co_effs_line2(a_l2(4)+4:a_l2(5)+3);
   a10 = str2num(a10);

   %marching to next line
   co_effs_line3 = fgetl(f1);
   a_l3 = strfind(co_effs_line3,'E');

   %extracting coeffcients from this line

   a11 = co_effs_line3(1:a_l3(1)+3);
   a11 = str2num(a11);
   a12 = co_effs_line3(a_l3(1)+4:a_l3(2)+3);
   a12 = str2num(a12);
   a13 = co_effs_line3(a_l3(2)+4:a_l3(3)+3);
   a13 = str2num(a13);
   a14 = co_effs_line3(a_l3(3)+4:a_l3(4)+3);
   a14 = str2num(a14);

   %coeffcients a1 to a7 are high temperature coefficients
   %coefficents a8 to a14 are low temperature coefficients

   %calculating specific heat
   Cp = specific_heat(a1,a2,a3,a4,a5,a8,a9,a10,a11,a12,local_temperature_values,local_temperature_range,R);


   %calculating enthalpy
   H = enthalpy(a1,a2,a3,a4,a5,a6,a8,a9,a10,a11,a12,a13,local_temperature_values,local_temperature_range,R);

  %calculating entropy
  S = entropy(a1,a2,a3,a4,a5,a7,a8,a9,a10,a11,a12,a14,local_temperature_values,local_temperature_range,R);


  %Plotting and saving each species in seperate directories

  %getiing present working directory
  current_direc = pwd;

  %creating a new directory in species_name
  mkdir(species_name);

  %changing the directory
  cd(species_name);

  %Plotting
  %Temperature V/S Specific heat

  figure(1)
  plot(T,Cp,'r','linewidth',3)
  title(species_name)
  xlabel('Temperature[K]')
  ylabel('Specific Heat [KJ/Kg-K]')
  grid on

   %Temperature V/S Enthalpy

  figure(2)
  plot(T,H,'b','linewidth',3)
  title(species_name)
  xlabel('Temperature[K]')
  ylabel('Enthalpy [KJ]')
  grid on

  %Temperature V/S Entropy

  figure(3)
  plot(T,S,'k','linewidth',3)
  title(species_name)
  xlabel('Temperature[K]')
  ylabel('Entropy [KJ/K]')
  grid on


  %saving plots
  saveas(1,'Specific_Heat.jpg')
  saveas(2,'Enthalpy.jpg')
  saveas(3,'Entropy.jpg')


  %switching back to original directory for calculating molecular_weight
  cd(current_direc);

  Molecular_weight = mol_weight(species_name);
  fprintf('%s of %6s is %14.9f','Molecular_weight',species_name,Molecular_weight)
  fprintf('\n')
 end

 fclose(f1)
Explanation of code:
Code starts with clear all, close all, clc.
File THERMO.dat is opened using fopen command and r is used to read the file and file is stored in f1 variable.
fgetl is used to get the line wise information from the file f1.
Every time fgetl is used next line is read from the file.
strsplit is used to split the line wherever space is there in the line.
deblank removes the extra blank spaces.
str2num is used to convert the string to a number.
Local temperature values are read from 1st line of given species and 500 equal intervals are split between them using linspace command.
14 coefficients from given species is extracted from next 3 linesand named a1 to a14.
For loop is used for extracting information from 53 species.
Separate functions are created for Cp, H ands and are called in main code to calculate them.
New directory for each species is created using mkdir command and separate folder are created for all of them and plots of P, H and S v/s temperature of all species are saved in respective folders in jpg format.
Molecular weight of each species is calculated by calling the function that is created to calculate Molecular weight.
Function of Specific Heat Cp:
function [Cp] = specific_heat(a1,a2,a3,a4,a5,a8,a9,a10,a11,a12,local_temperature_values,local_temperature_range,R)

%a1,a2,a3,a4,a5 are high temperature coefficients
%a8,a9,a10,a11,a12 are low temperature coefficients

for i = 1:length(local_temperature_range)
    T = local_temperature_range;
    if T(i)<=local_temperature_values(2)
        Cp(i) = R *(a8 + a9.*T(i) + a10.*T(i).^2 + a11.*T(i).^3 + a12.*T(i).^4);
    else
        Cp(i) = R *(a1 + a2.*T(i) + a3.*T(i).^2 + a4.*T(i).^3 + a5.*T(i).^4);
    end

end
end
Function of Enthalpy H:
function H = enthalpy(a1,a2,a3,a4,a5,a6,a8,a9,a10,a11,a12,a13,local_temperature_values,local_temperature_range,R)

%a1,a2,a3,a4,a5,a6 are high temperature coefficients
%a8,a9,a10,a11,a12,a13 are low temperature coefficients

for i = 1 : length(local_temperature_range)
    T = local_temperature_range;
    if T(i)<=local_temperature_values(2)
        H(i) = (R*T(i)) * (a8 + (a9/2) * T(i) + (a10/3) * T(i).^2 + (a11/4) * T(i).^3 + (a12/5) * T(i).^4 + a13/T(i));
    else
        H(i) = (R*T(i)) *(a1 + (a2/2) * T(i) + (a3/3) * T(i).^2 + (a4/4) * T(i).^3 + (a5/5) * T(i).^4 + a6/T(i));

    end

end
end
Function of Entropy S:
function S = entropy(a1,a2,a3,a4,a5,a7,a8,a9,a10,a11,a12,a14,local_temperature_values,local_temperature_range,R)

%a1,a2,a3,a4,a5,a7 are high temperature coefficients
%a8,a9,a10,a11,a12,a14 are low temperature coefficients

for i = 1 : length(local_temperature_range)
    T = local_temperature_range;
    if T(i)<=local_temperature_values(2)
        S(i) = R * (a8 *log(T(i)) + a9 * T(i) + (a10/2) * T(i).^2 + (a11/3) * T(i).^3 + (a12/4) * T(i).^4 + a14);
    else
        S(i) = R * (a1 *log(T(i)) + a2 * T(i) + (a3/2) * T(i).^2 + (a4/3) * T(i).^3 + (a5/4) * T(i).^4 + a7);

    end
end
end
Function of Molecular Weight:
function M_weight = mol_weight(species_name)

elements = ['H','C','N','O','A'];
atm_weight = [1.0078 12.0107 14.0067 15.999 39.948];

%initialise molecular weight to 0
M_weight = 0;

for i = 1:length(species_name)
    for j = 1:length(elements)
        if strcmp(species_name(i),elements(j))
            M_weight = M_weight + atm_weight(j) ;
            p = j ;
        end
    end
    n = str2num(species_name(i));
    if n>1
        M_weight = M_weight + atm_weight(p) * (n-1);
    end
end
end
Result and Conclusion:
Screenshot showing separate folders of 53 species.

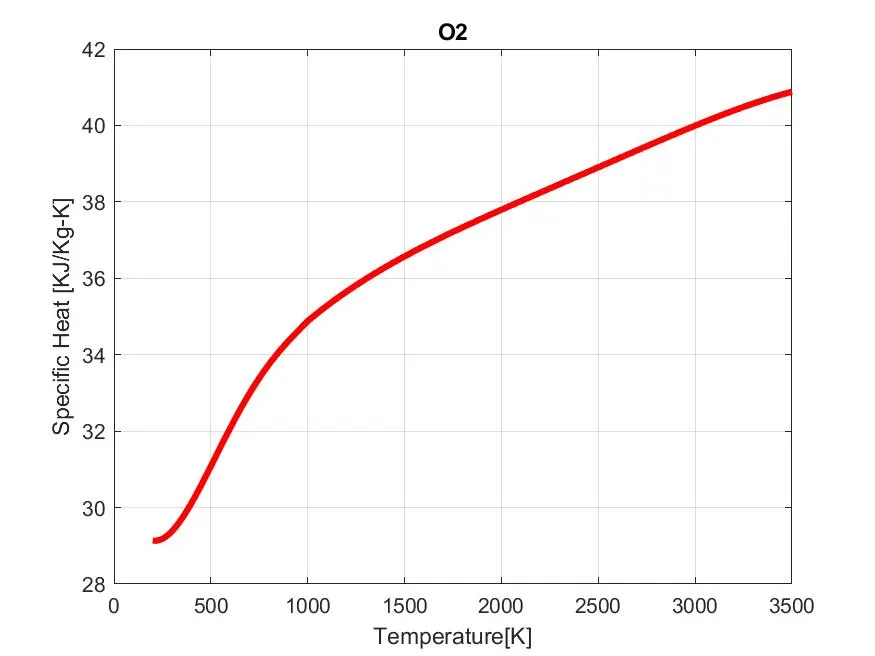
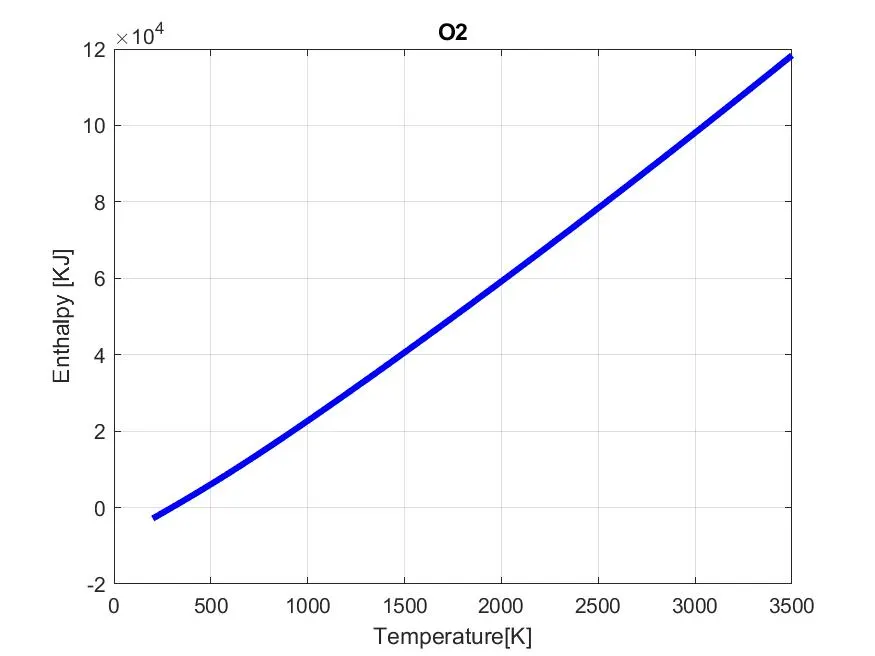
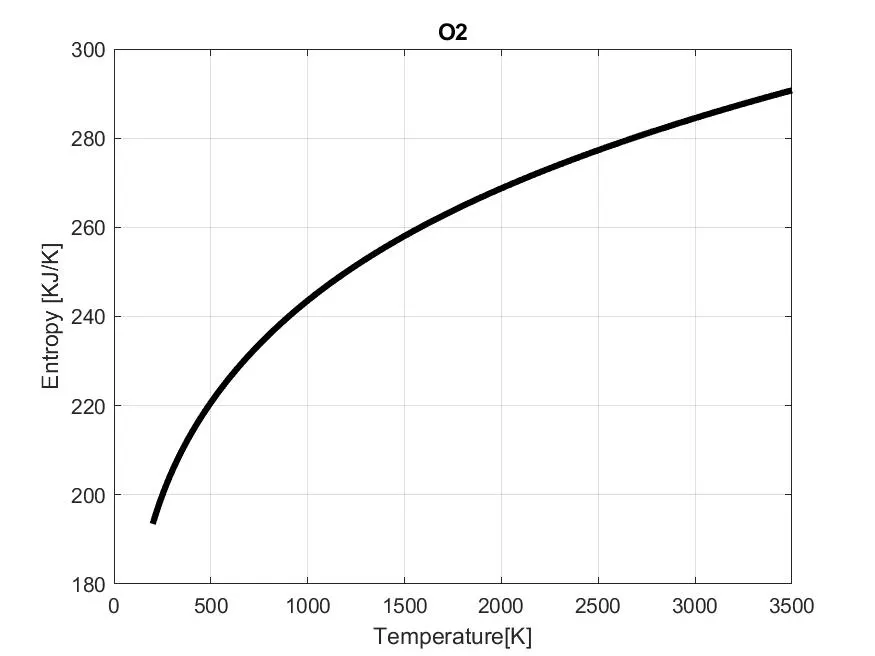
Plots of O2:
Plot of Specific Heat v/s Temperature
Plot of Enthalpy v/s Temperature
Plot of Entropy v/s Temperature
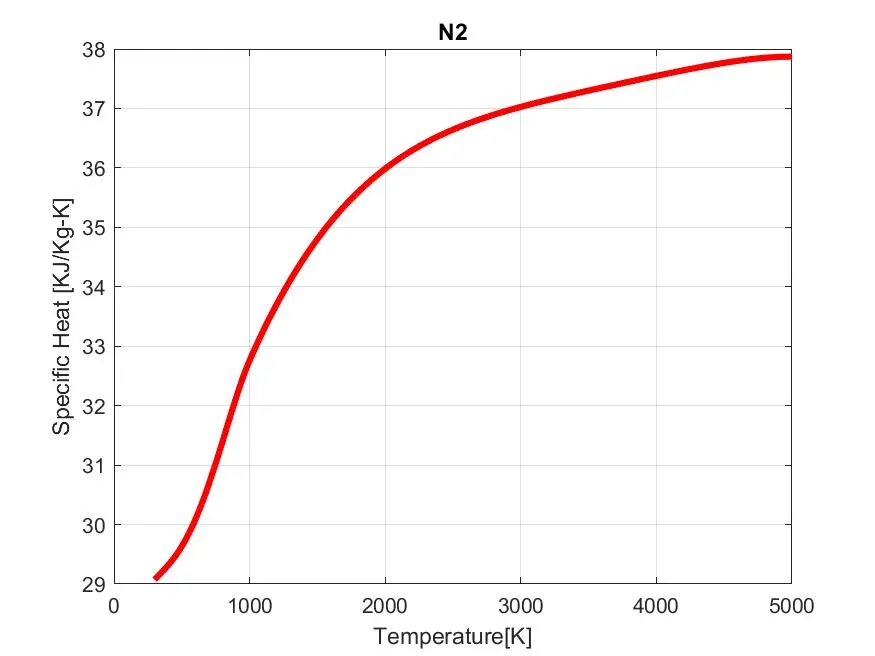
Plots of N2:
Plot of Specific Heat v/s Temperature
Plot of Enthalpy v/s Temperature
Plot of Entropy v/s Temperature
Plots of CO2:
Plot of Specific Heat v/s Temperature
Plot of Enthalpy v/s Temperature
Plot of Entropy v/s Temperature
Molecular Weight:
Molecular weight of species is calculated and displayed in the command window.
References: