Project 1 - Parsing NASA thermodynamic data
Parsing NASA thermodynamic data
Introduction: NASA came up with polynomials that can be used to evaluate thermodynamic properties such as Cp, H, and S. They have also documented the coefficients that are required to evaluate these polynomials for 1000+ species.
I read the following file: https://drive.google.com/file/d/1AikCHDlz9s_fu8whE81qee_GD4AyYpCP/view?usp=sharing( NASA thermodynamic data)
The objective of the project is:
Writing code in MATLAB to parse the NASA thermodynamic data file.
Writing a function that extracts the 14 coefficients and calculates the enthalpy, entropy, and specific heats for all the species in the data file.
Calculating the molecular weight of each species and displaying it in the command window.
Plotting the Cp, Enthalpy, and Entropy for the local temperature range (low temperature: high temperature) specific for each species. Saving the plots as images with appropriate names and dumping them in separate folders for each species with a suitable name.
Specific Heat: It is defined as the amount of heat required to raise the temperature of unit mass of a substance by 1 degree.
Enthalpy: It is the sum of the internal energy and the product of the pressure and volume of a thermodynamic process. Enthalpy is an energy-like property or state function—it has the dimensions of energy (and is thus measured in units of joules or ergs), and its value is determined entirely by the temperature, pressure, and composition of the system and not by its history.
Entropy: It is the measure of a system’s thermal energy per unit temperature that is unavailable for doing useful work. Because work is obtained from ordered molecular motion, the amount of entropy is also a measure of the molecular disorder, or randomness, of a system. The concept of entropy provides deep insight into the direction of spontaneous change for many everyday phenomena.
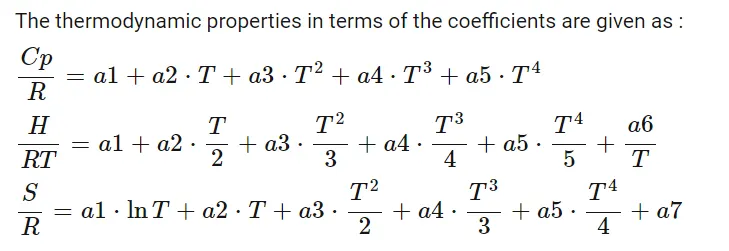
The three quantities are calculated as:
Main Code:
clear all
close all
clc

f1=fopen('THERMO.dat','r');
fgetl(f1); %skipping the first line
%extracting the global temperature values
tline= fgetl(f1);
a=strsplit(tline,' ');
global_low_temp= str2double(a{2});
global_med_temp= str2double(a{3});
global_high_temp= str2double(a{4});

%skipping the three comments in the THERMO file.
fgetl(f1);
fgetl(f1);
fgetl(f1);

for i= 1:53
    %closing the warnings because I have run the program many times so
    %program is giving an error that folder already exists
    warning('off')
    line=fgetl(f1);
    species_name=line(1:9);
    %removing the blank spaces
    species_name=deblank(species_name);

    %extracting the local temperatures
    line=line(49:75);
    species_local=strsplit(line,' ');
    local_low_temp=str2double(species_local{1});
    local_high_temp=str2double(species_local{2});
    local_med_temp=str2double(species_local{3});

    %setting local temperature range
    loc_temp_range=linspace(local_low_temp,local_high_temp,1000);
    %extracting the coefficients in line number 2 of the species
    tline=fgetl(f1);

    x=strfind(tline,'E');

    a1=str2double(tline(1:x(1)+3));
    a2=str2double(tline(x(1)+4:x(2)+3));
    a3=str2double(tline(x(2)+4:x(3)+3));
    a4=str2double(tline(x(3)+4:x(4)+3));
    a5=str2double(tline(x(4)+4:x(5)+3));

    tline=fgetl(f1);
    y=strfind(tline,'E');

    a6=str2double(tline(1:y(1)+3));
    a7=str2double(tline(y(1)+4:y(2)+3));
    a8=str2double(tline(y(2)+4:y(3)+3));
    a9=str2double(tline(y(3)+4:y(4)+3));
    a10=str2double(tline(y(4)+4:y(5)+3));

    tline=fgetl(f1);

    z=strfind(tline,'E');

    a11=str2double(tline(1:z(1)+3));
    a12=str2double(tline(z(1)+4:z(2)+3));
    a13=str2double(tline(z(2)+4:z(3)+3));
    a14=str2double(tline(z(3)+4:z(4)+3));

    %Calculating specific heat, calling the specific_heat function
    Cp= specific_heat(a1,a2,a3,a4,a5,a8,a9,a10,a11,a12,loc_temp_range,local_med_temp);

    %Calculating Enthalpy, calling the function
    H= enthalpy(a1,a2,a3,a4,a5,a6,a8,a9,a10,a11,a12,a13,loc_temp_range,local_med_temp);

    %calculating the Entropy
    S= entropy(a1,a2,a3,a4,a5,a7,a8,a9,a10,a11,a12,a14,loc_temp_range,local_med_temp);


    %plotting and saving specific heat, enthalpy
    cur_directory=pwd;

    %making new folder for each species
    mkdir(species_name);
    %selecting this folder
    cd(species_name);

    h=figure(1);
    plot(loc_temp_range,Cp,'linewidth',3,'color','r')
    xlabel('Temperature(K)')
    ylabel('Specific Heat(kJ/kgK)')
    title({'Enthalpy vs Temperature',['Species= ',species_name]})

    e=figure(2);
    plot(loc_temp_range,H,'linewidth',3,'color','b')
    xlabel('Temperature(K)')
    ylabel('Enthalpy(kJ/kg)')
    title({'Enthalpy vs Temperature',['Species= ',species_name]})

    k=figure(3);
    plot(loc_temp_range,S,'linewidth',3,'color','g')
    xlabel('Temperature(K)')
    ylabel('Entropy(kJ/kg)')
    title({'Entropy vs Temperature',['Species= ',species_name]})

    %saving the plots as a jpeg in the species folder

    saveas(h,'Specific Heat.jpg');
    saveas(e,'Enthalpy.jpg');
    saveas(k,'Entropy.jpg');

    cd(cur_directory);

    %calculating molecular mass

    M=molecular_mass(species_name);
    %printing the values of molecular mass of
    fprintf('The molecular mass of %s = %f\n',species_name,M)

end
%I used the diary on and off function to save the output molecular masses
%of all species
Specific Heat Function Code:
function [Cp]= specific_heat(a1,a2,a3,a4,a5,a8,a9,a10,a11,a12,loc_temp_range,local_med_temp)

R=8.314;
for i=1:length(loc_temp_range)
    if loc_temp_range(i)<=local_med_temp
        Cp(i)=R.*(a8+(a9*loc_temp_range(i)+a10*loc_temp_range(i).^2)+(a11*loc_temp_range(i).^3)+a12*loc_temp_range(i).^4);
    else
        Cp(i)= R.*(a1+a2*loc_temp_range(i)+a3*loc_temp_range(i).^2+a4*loc_temp_range(i).^3+a5*loc_temp_range(i).^4);
    end
end
end
Enthalpy Calculation Function:
function [H]= enthalpy(a1,a2,a3,a4,a5,a6,a8,a9,a10,a11,a12,a13,loc_temp_range,local_med_temp)

R=8.314;
for i=1:length(loc_temp_range)
    if loc_temp_range(i)<=local_med_temp
        H(i)= R.*((a8.*loc_temp_range(i))+0.5*(a9.*loc_temp_range(i).^2)+((a10.*loc_temp_range(i).^3)/3)+(0.25*(a11.*loc_temp_range(i).^4))+(0.2*(a12.*loc_temp_range(i).^5))+a13);
    else
        H(i)= R.*((a1.*loc_temp_range(i))+0.5*(a2.*loc_temp_range(i).^2)+((a3.*loc_temp_range(i).^3)/3)+0.25*(a4.*loc_temp_range(i).^4)+0.2*(a5.*loc_temp_range(i).^5)+a6);

    end
end
end
Entropy Calculating Function:
function [S]= entropy(a1,a2,a3,a4,a5,a7,a8,a9,a10,a11,a12,a14,loc_temp_range,local_med_temp)

R=8.314;
for i=1:length(loc_temp_range)
    if loc_temp_range(i)<=local_med_temp
        S(i)= R.*(a8.*log(loc_temp_range(i))+a9.*loc_temp_range(i)+0.5*(a10.*loc_temp_range(i).^2)+(a11.*loc_temp_range(i).^3)/3+0.25*a12.*loc_temp_range(i).^4+a14);
    else
        S(i)= R.*(a1.*log(loc_temp_range(i))+a2.*loc_temp_range(i)+0.5*(a3.*loc_temp_range(i).^2)+(a4.*loc_temp_range(i).^3)/3+0.25*a5.*loc_temp_range(i).^4+a7);


    end
end
end
Function for calculating Molecular Masses of different species:
function [M]=molecular_mass(species_name)

%setting atomic weights to all the atoms in the file
atoms={'H','O','C','N','A','R','S'};
atomic_weight=[1,16,12,14,20,0,32];
M=0;
%reading the species name and calclating the atomic weight
for i=1:length(species_name)
    for j= 1:length(atoms)

        if strcmp(species_name(i),atoms(j))
            M= M+ atomic_weight(j);
            x=j;   %storing the position because it is the number position of atom
            if strcmp(species_name(i),'R')
                %using this so that we can add atomic weights of all the elements even with two letter symbols
                M=M+20;
            end
        end


    end
    %setting b equal to the number and position of the j to convert into number
    a=str2double(species_name(i));
    if a>1
        M= M+atomic_weight(x)*(a-1);   %multiphying the number of times atom is repeated
    end
end
end
Explanation of the code:
The program begins with the clear all, close all, and clc commands to free up the command window and the workspace.
We will then read the data from the external NASA thermodynamic file using fopen(to open the file) and fgetl(to read the content in the file line by line) commands.
The useful header information will be extracted from the file such as global temperature limits.
Then we will proceed to extract the individual species data of all the species present in the file using fgetl command to read the file line by line and skipping the line not containing any useful data.
The data that is to be extracted for all the 53 species mentioned in the file is 14 coefficients(7 for higher temperature and & for lower temperature), species name, and the local temperature limits.
This process will be carried out with the help of a for loop.
Calculation of specific heat, enthalpy, entropy, and molecular weight will be done in separate function files and will be called in the main program.
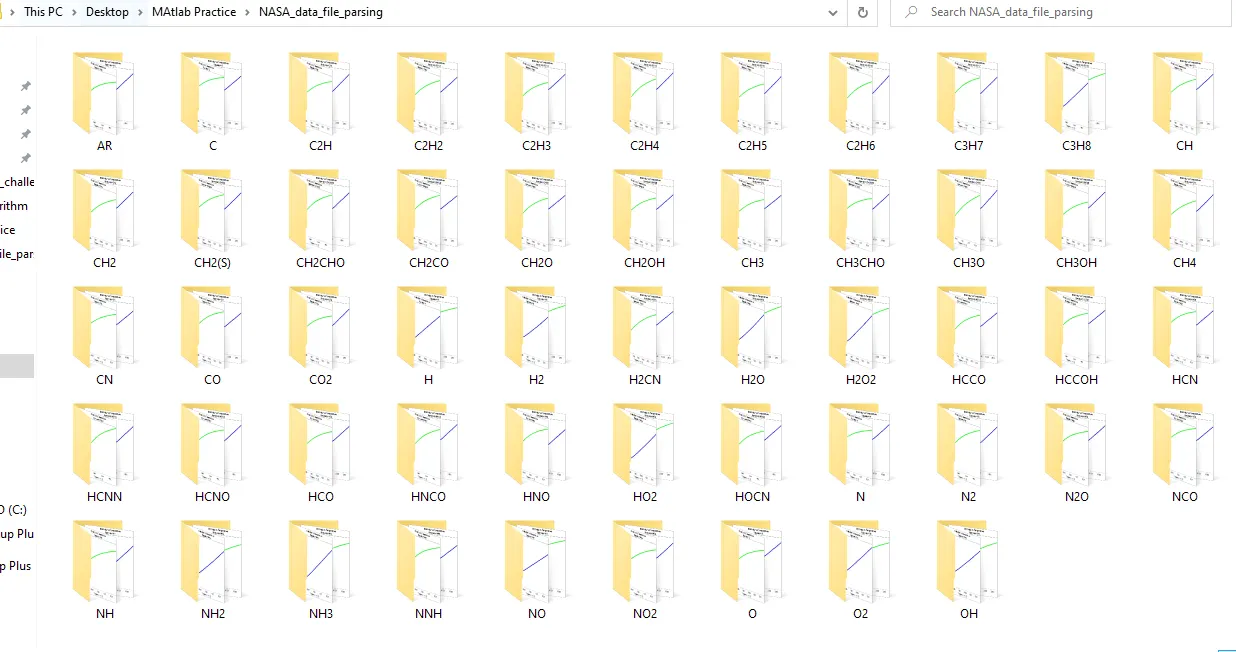
Then we will create plots for specific heat v/s temperature, enthalpy v/s temperature, and entropy v/s temperature for all the 53 species, and these 3 plots will be saved in separate folders for each species.
After this, we will display the molecular weight of all the species in the command window.
Output Command Window:
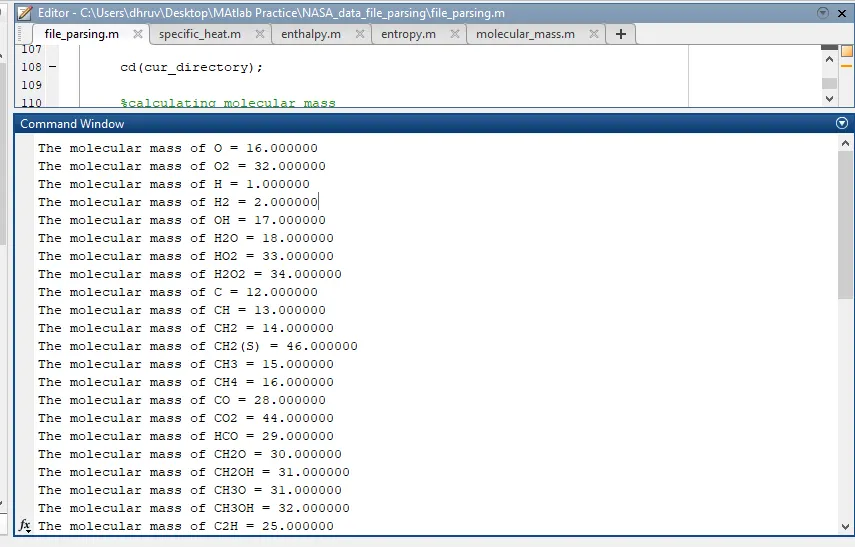
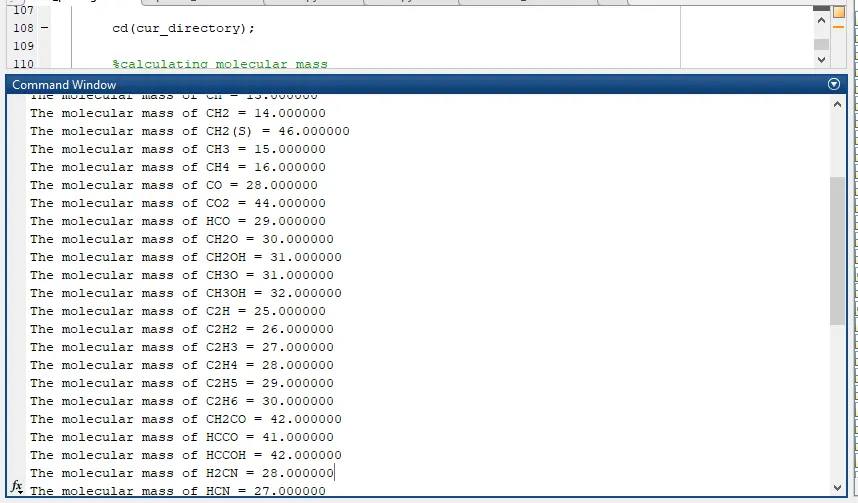
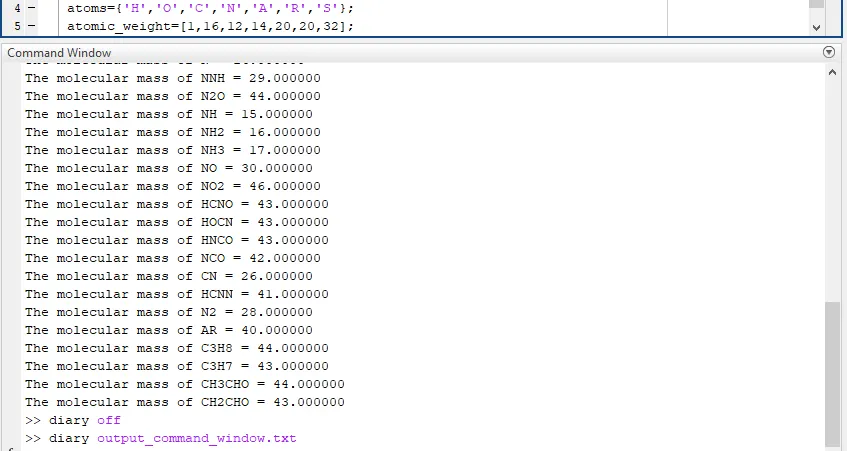
I also saved the command window output into a text file using the diary on and diary off tool.
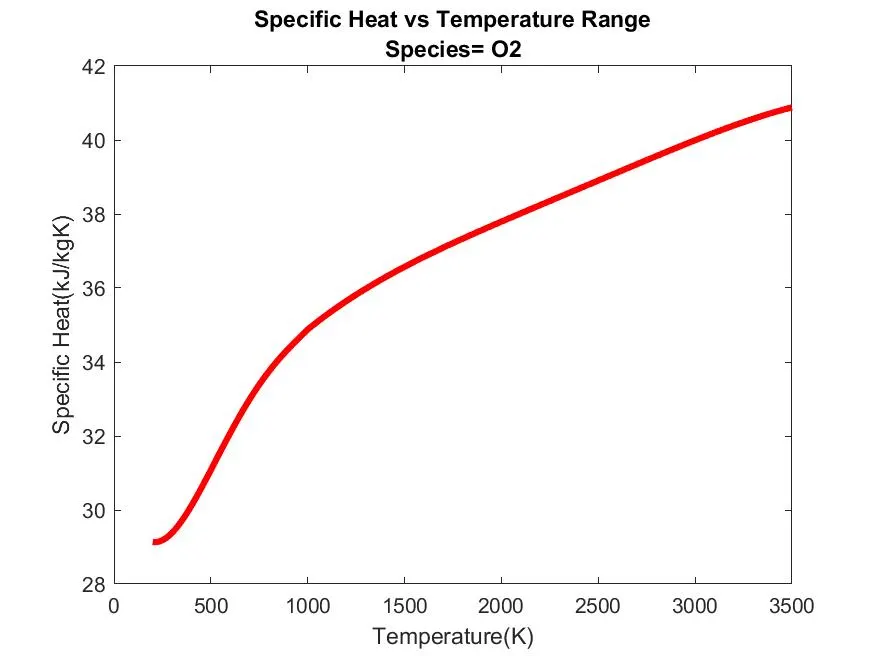
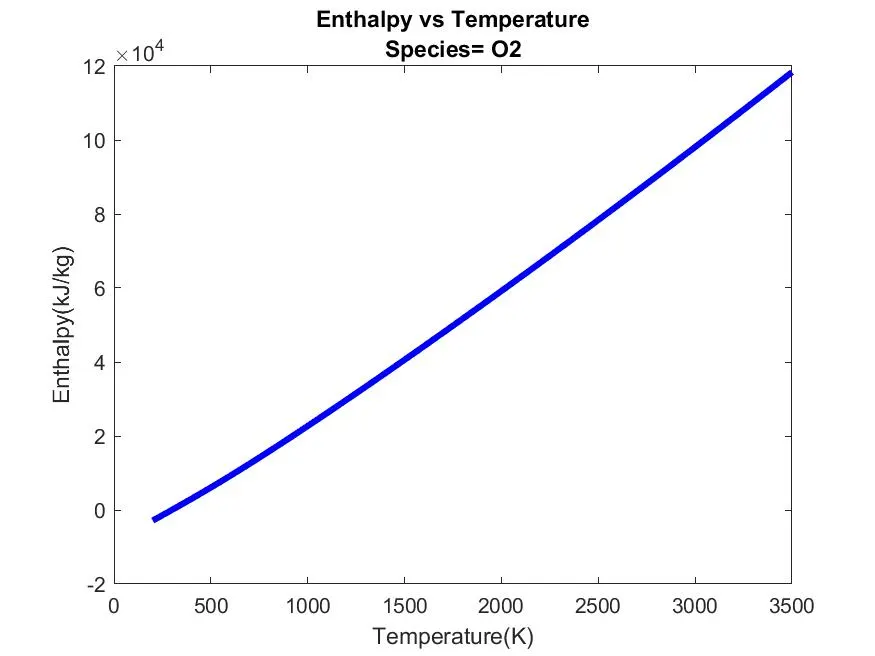
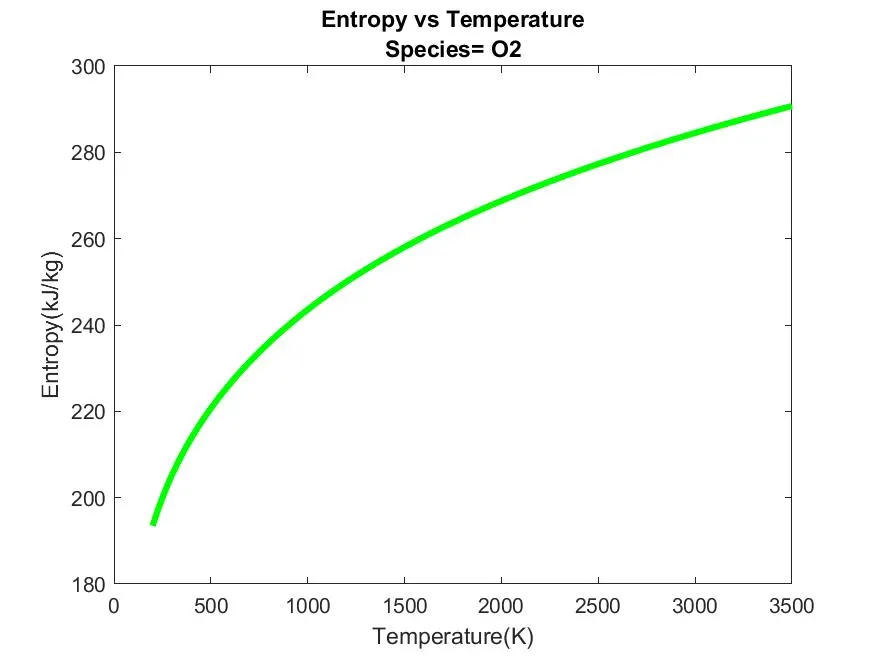
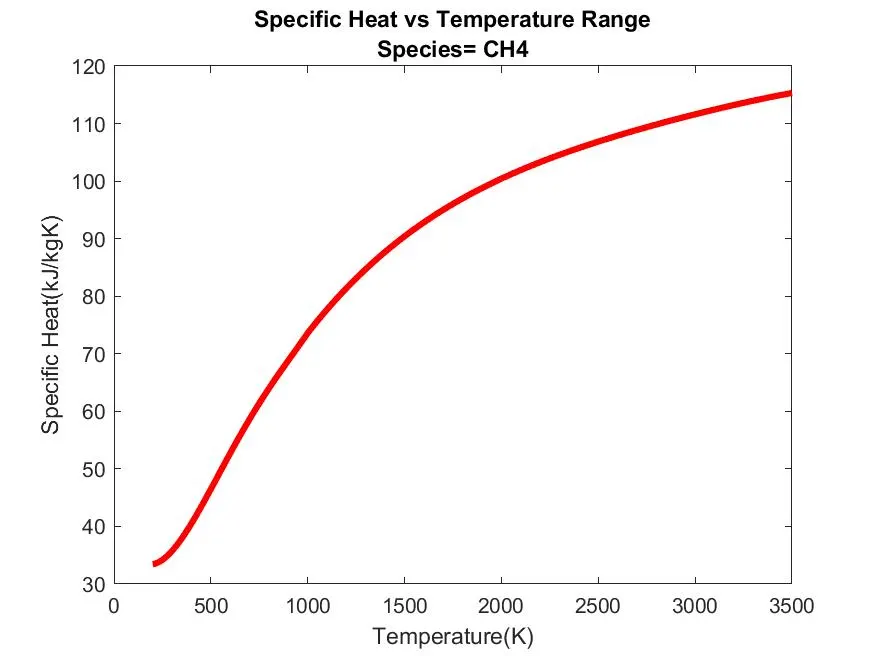
Sample Output Graphs: Methane(CH4) and Oxygen(O2).
Oxygen(O2):
Oxygen Specific Heat Graph:
Oxygen Enthalpy Graph:
Oxygen Entropy Graph:
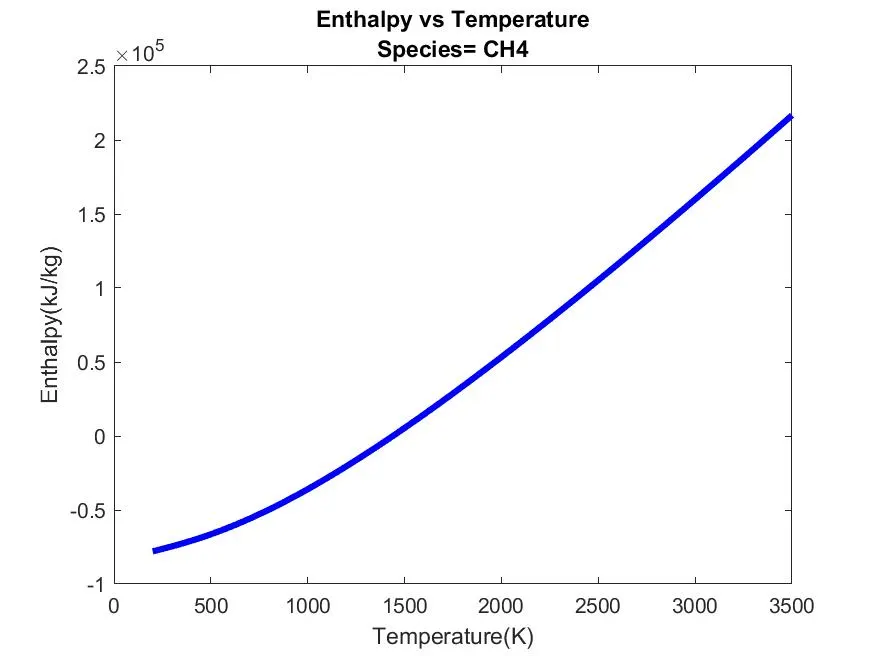
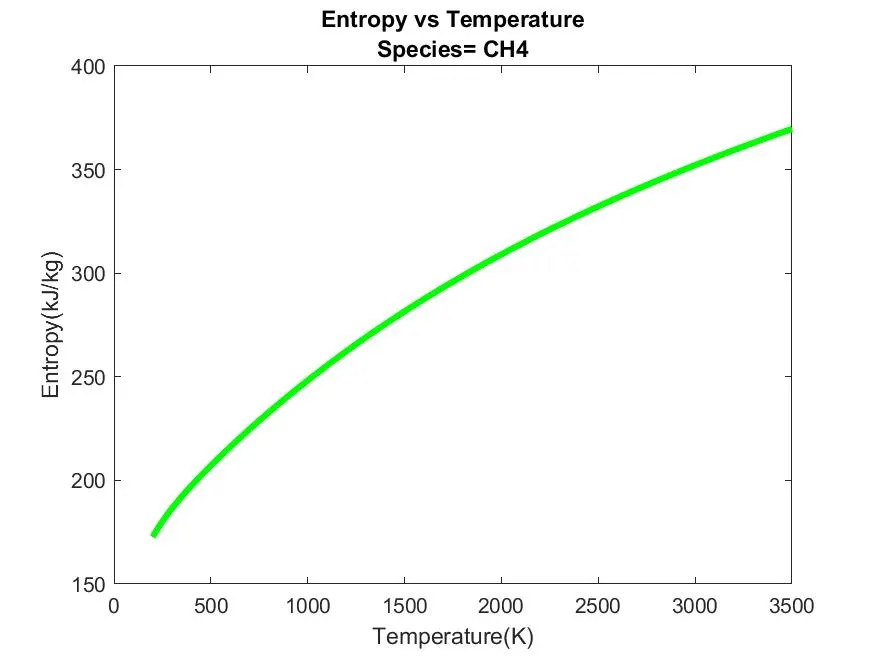
Methane(CH4):
Methane Specific Heat Graph:
Methane Enthalpy Graph:
Methane Entropy Graph:
Screenshot of All the species graphs folder stored in directory:
The error I faced and how I solved it:
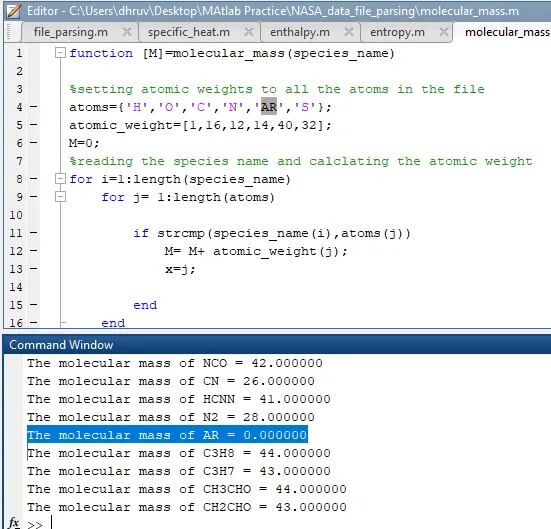
I was getting the molecular mass of argon to be 0 since I was checking each string and since there was no assigned value to 'A' and 'R' separately. So, no value got assigned to 'AR' together. To solve this I assigned A and R with 20 and thus the molecular mass of Argon(AR as per data file) came out to be 40.
Conclusion:
Thus File parsing is done for NASA Thermodynamic Data and the thermodynamic properties like specific heat, enthalpy, and entropy are calculated. Also plotting is done for the same and stored in the separate directory by using Matlab code.
Google Drive link to the graphs and files:
https://drive.google.com/drive/folders/10EZLfuPoLzqLYl88ld4Y_YzKEGINNJJl?usp=sharing
References:
https://in.mathworks.com/help/matlab/ref/savefig.html
https://in.mathworks.com/help/matlab/ref/cd.html
https://in.mathworks.com/help/matlab/ref/diary.html
https://in.mathworks.com/help/matlab/ref/diary.html#mw_01254829-0569-44af-aaa4-ff3d5bec6155
https://in.mathworks.com/help/matlab/ref/fgetl.html
https://in.mathworks.com/matlabcentral/answers/106320-make-a-loop-to-calculate-molecular-weight
https://in.mathworks.com/matlabcentral/answers/9701-sprintf-or-disp