AIM: To a program to parsing the data of the nasa thermodynamic data ,extacting the species , calculate the sp,H, and S and the molecular weigth of the species and plot the data in the graphs.
OBJECTIVES:
1.parsing the data.
2.exacting the species.
3.calculating the sp,H and S.
4.then plotting the sp vs T, s vs T and H vs T.
5. calculation of the molecular weight.
PROCEDURE:
1.first i started writing the program with the clear all,close all and clc to last program commands from the program.
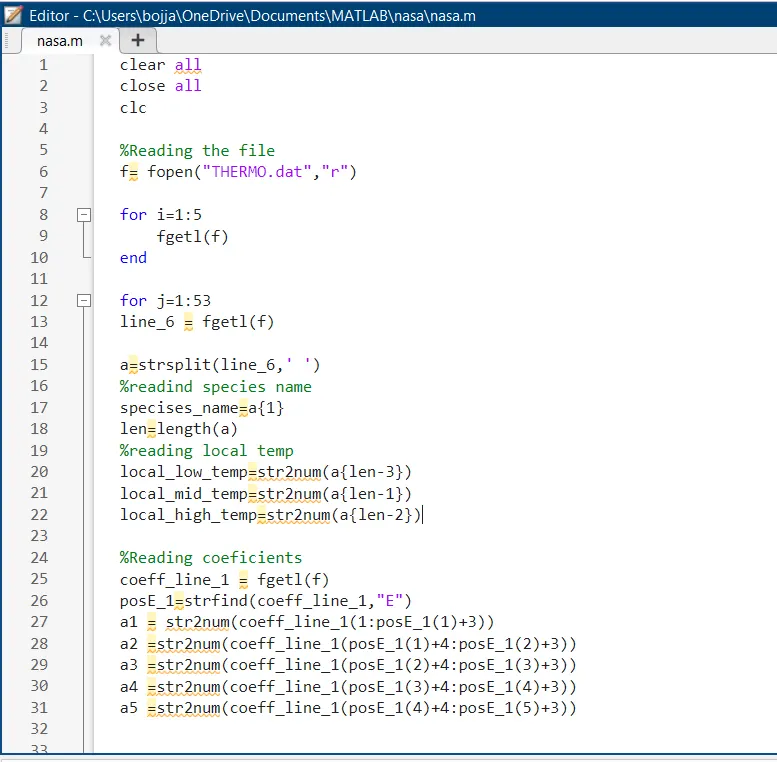
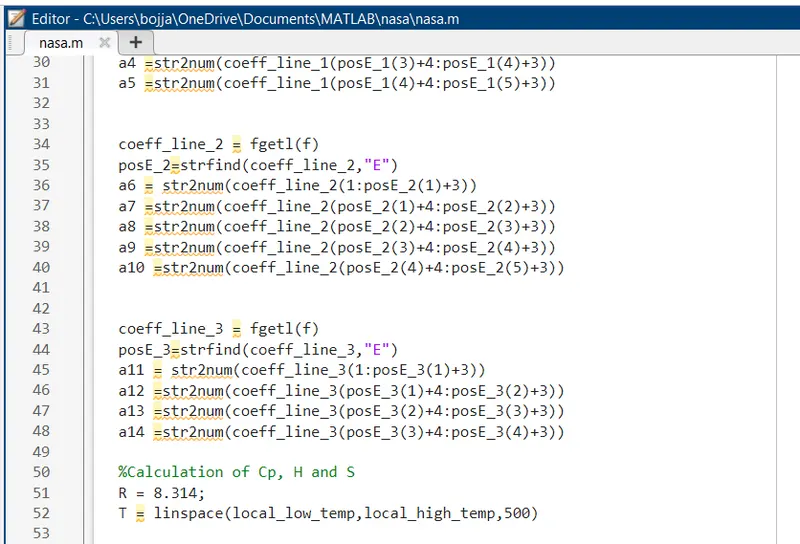
fig: main program part 1.
2. here i used to parsing the data by using the command by "fopen". then i given the name of the file.
3. then i used the forloop to read first five line and then i uesd another forloop to repeat the all the lines of the program for all the species then iread the sixth line that having the local temperatures.
4. then i split the sixth line and i coverted it into integer by using the command "strsplit".
{a=strsplit(line_6,' ')}.
5. then i reading the species name by using the command
{specises_name=a{1}
6. here the len is then length of the line "a" then i read the all the local temperatures
{local_low_temp=str2num(a{len-3})
local_mid_temp=str2num(a{len-1})
local_high_temp=str2num(a{len-2})} here the the len -ve one is the mid temperature.
7.then i went to fine the coefficients
{coeff_line_1 = fgetl(f)} here i read the line of the coefficient line 1.
8. in neaxt line fine the place of "E" the inthat line.
{posE_1=strfind(coeff_line_1,"E")}
9.here i fine the first coeificient nad i converted into the integer with help of the place of "E" and the str2num convert into the integer.
{a1 = str2num(coeff_line_1(1:posE_1(1)+3))}
10. then fot the second coeficient with help of 1 and 3 "E" place inthe line and then i converted the value character into the integer. this procedure is repeated for the a1 to a 14. but that are inthe next line.
{a2 =str2num(coeff_line_1(posE_1(1)+4:posE_1(2)+3))
a3 =str2num(coeff_line_1(posE_1(2)+4:posE_1(3)+3))
a4 =str2num(coeff_line_1(posE_1(3)+4:posE_1(4)+3))
a5 =str2num(coeff_line_1(posE_1(4)+4:posE_1(5)+3))}
11. i repeated same procedure for the coeficient of line 2 and 3.
{coeff_line_3 = fgetl(f)
posE_3=strfind(coeff_line_3,"E")
a11 = str2num(coeff_line_3(1:posE_3(1)+3))
a12 =str2num(coeff_line_3(posE_3(1)+4:posE_3(2)+3))
a13 =str2num(coeff_line_3(posE_3(2)+4:posE_3(3)+3))
a14 =str2num(coeff_line_3(posE_3(3)+4:posE_3(4)+3))}
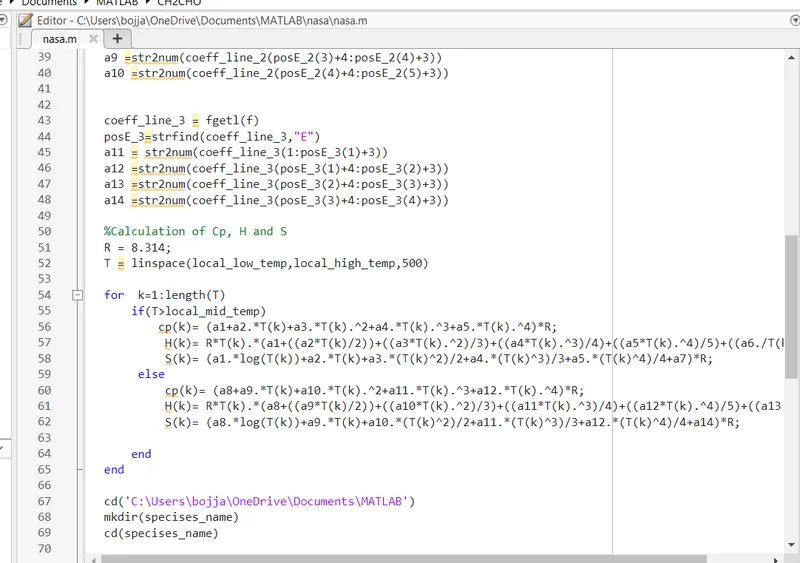
fig: main program part 2
12. then i went to the calculation of the cp,H and S with the help of the R=8.314.
{%Calculation of Cp, H and S
R = 8.314;
T = linspace(local_low_temp,local_high_temp,500)}
fig: main program part 3
13. here i used the for loop to repeat the same formula to the all the coeficient values inthe data. here i used the two condition with "if and else loop" for less than mid temperature and the greater than mid temperature.
{for k=1:length(T)
if(T>local_mid_temp)
cp(k)= (a1+a2.*T(k)+a3.*T(k).^2+a4.*T(k).^3+a5.*T(k).^4)*R;
H(k)= R*T(k).*(a1+((a2*T(k)/2))+((a3*T(k).^2)/3)+((a4*T(k).^3)/4)+((a5*T(k).^4)/5)+((a6./T(k))));
S(k)= (a1.*log(T(k))+a2.*T(k)+a3.*(T(k)^2)/2+a4.*(T(k)^3)/3+a5.*(T(k)^4)/4+a7)*R;
else
cp(k)= (a8+a9.*T(k)+a10.*T(k).^2+a11.*T(k).^3+a12.*T(k).^4)*R;
H(k)= R*T(k).*(a8+((a9*T(k)/2))+((a10*T(k).^2)/3)+((a11*T(k).^3)/4)+((a12*T(k).^4)/5)+((a13./T(k))));
S(k)= (a8.*log(T(k))+a9.*T(k)+a10.*(T(k)^2)/2+a11.*(T(k)^3)/3+a12.*(T(k)^4)/4+a14)*R;
end
end}
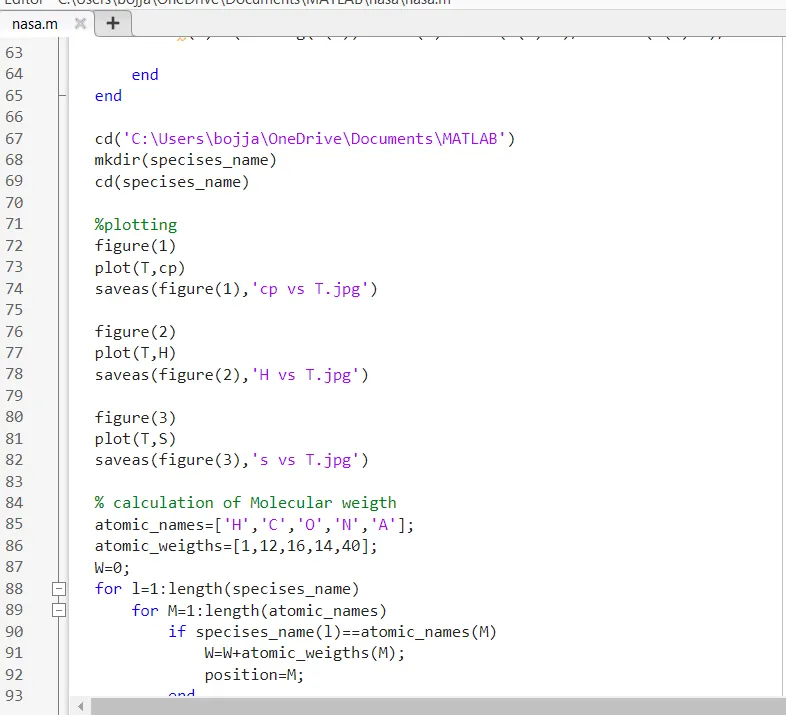
14. then i went to seva the plots in the document folder i given the path and by used with the command "cd". then "mkdir" for the speices_name and then "cd" to store the name of the species_ name .
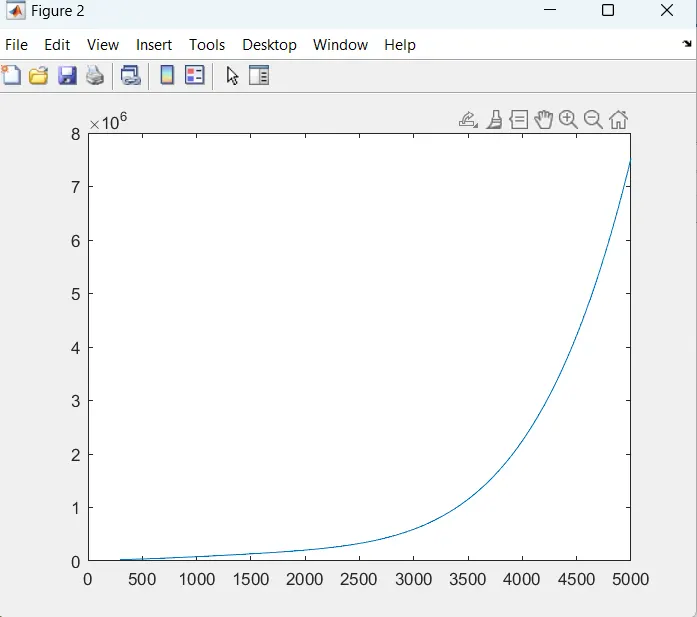
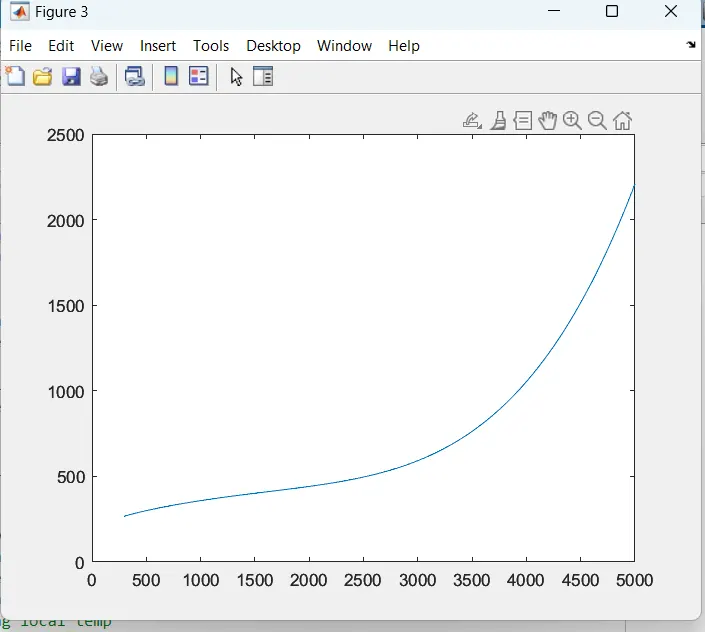
15.then i went to the plotting the T vs cp, T vs H and the T vs S and i given the figure 1 ,figure 2 and figure 3.
{%plotting
figure(1)
plot(T,cp)
saveas(figure(1),'cp vs T.jpg')
figure(2)
plot(T,H)
saveas(figure(2),'H vs T.jpg')
figure(3)
plot(T,S)
saveas(figure(3),'s vs T.jpg')}
fig: main program part 4
15. then i went to the calculate the molecular weight for the which specises of molecular weight. here i given the atomic_names and their atomic_weights. i have given the w = 0 at initial condition.
{atomic_names=['H','C','O','N','A'];
atomic_weigths=[1,12,16,14,40];
W=0;}
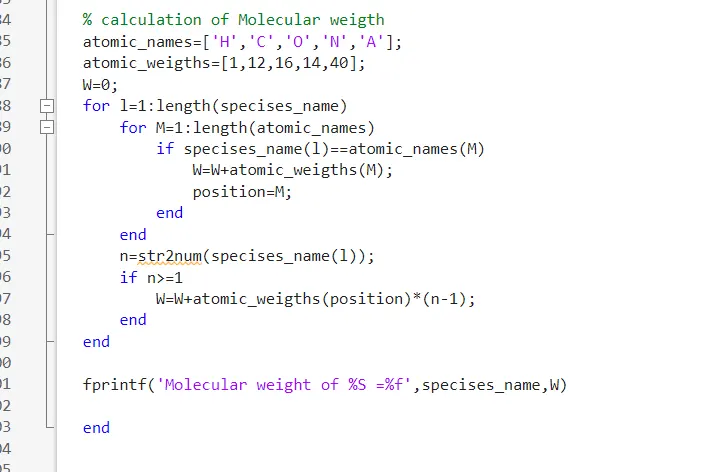
16. then i started the for loop to repeat the molecular weight calculation for each species. i"l" is changed along the length of the species_names and then i went to the next for loop for the "M" and it change 1 to the length of the atomic_names.
fig: main program part 5
17. then i went to the "if" condition specises (l) and (M). here the it select the specises name or the atomic name.
{
if specises_name(l)==atomic_names(M)
W=W+atomic_weigths(M);
position=M;
}
18. then i went formula to the add the molecular weight of the atomic_ name according to the specises name.then the position of "m".
19. then i coverted the character to integer by using the str2num then condition i uesd for the if loop they are n>=1 trhen i calculated the weight. then i ended the for loop and if loop.
20. then i went to the print the molecular weight of the specise name and then i end the main for loop. that for loop to repeat the for loop to the whole program for the lines and the calculation of the molecular weight calculation.
ERRORS:
1. here i got the syntax error while writting the program and change of the varible that captal letter in place i used the small letter that is the varible error.
fig: error.
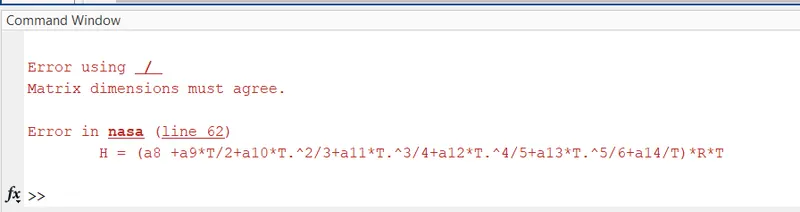
2. here i got the symbollic error "/" then changed the syntax above format to {H(k)= R*T(k).*(a1+((a2*T(k)/2))+((a3*T(k).^2)/3)+((a4*T(k).^3)/4)+((a5*T(k).^4)/5)+((a6./T(k))));} to over come this error.
OUTPUT:
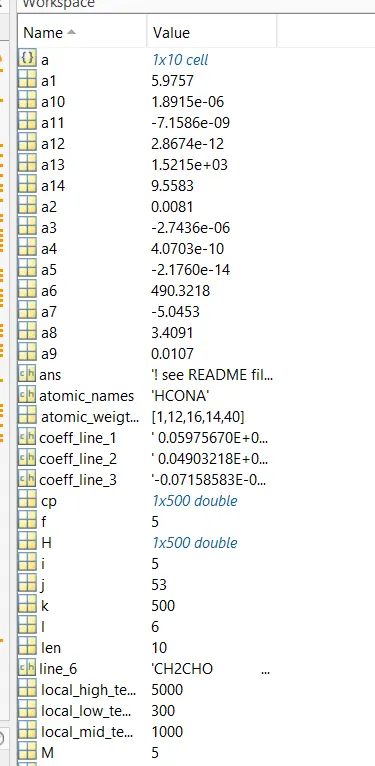
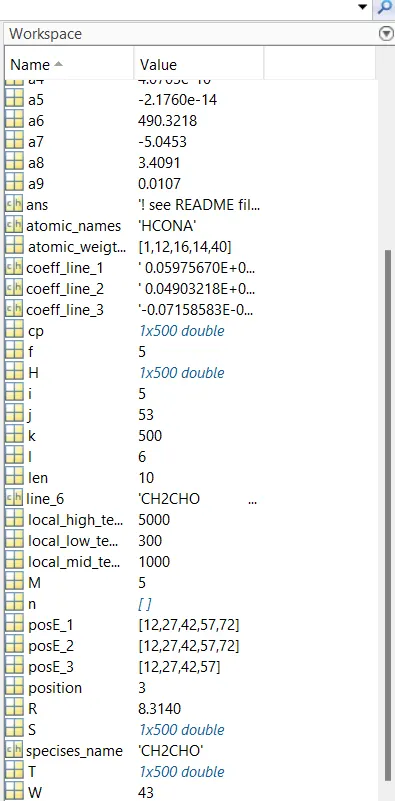
here i got the all the output value in the workspace.
fig: workspace part 1
fig: workspace 2
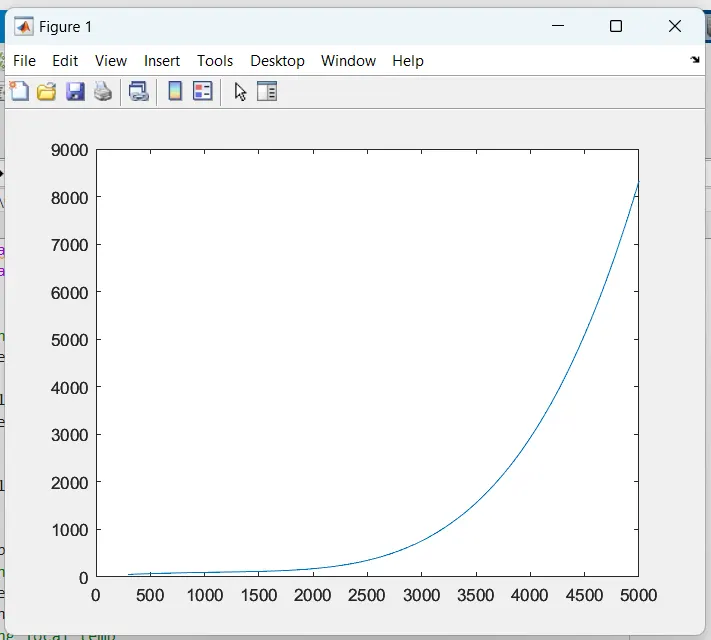
then i got the all the plots of T vs H, T vs cp and T vs S example of the plot i got is below.
FIG: 'cp vs T' plot
fig:'H vs T' plot
fig: 's vs T' plot
BELOW i submited the O2 ,CO2 and N2 file.
RESULT:
Hence i the all the task the and i calculated the molecular weight and plotting the graphs.
CONCLUSION:
hence i conculed that the it very easy to read the data inthe file and the calculation of the sp,H and S and calculation of molecular weight.