Project 1 - Parsing NASA thermodynamic data
AIM:
- Write a code that extracts the 14 co-efficients and calculates the enthalpy, entropy and specific heats for all the species in the data file.
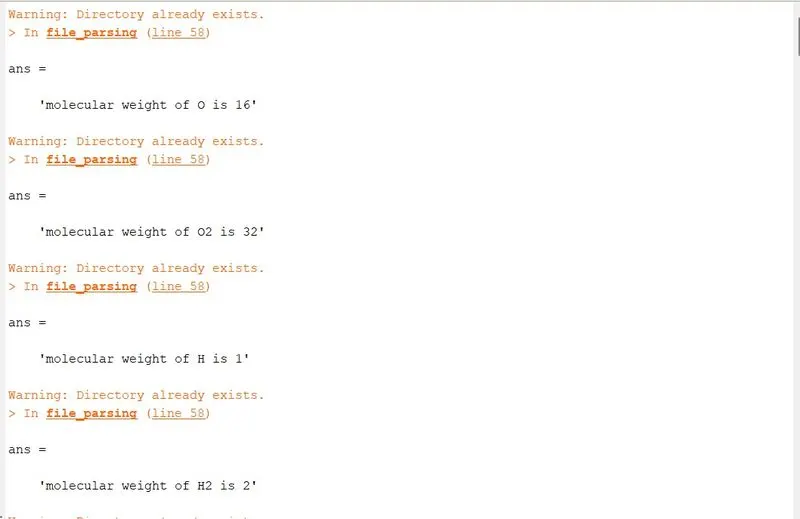
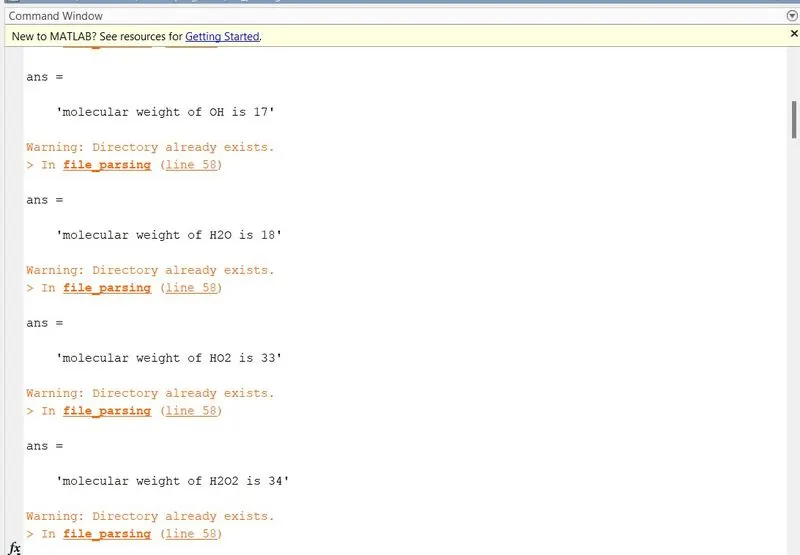
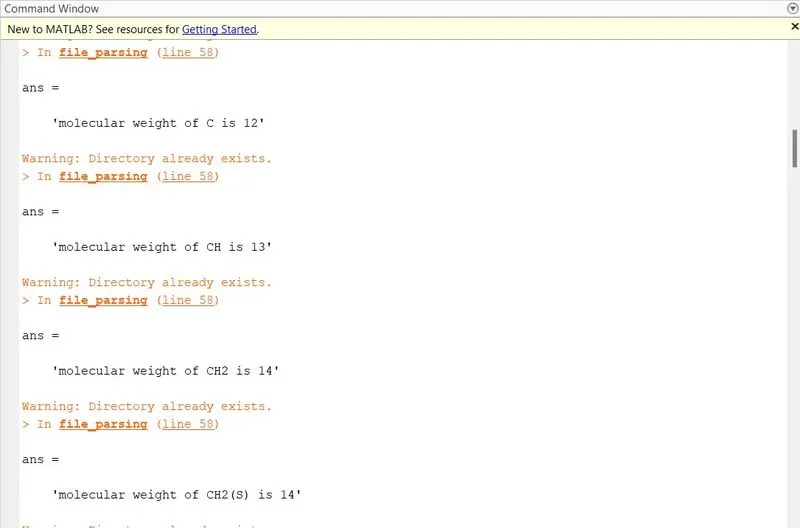
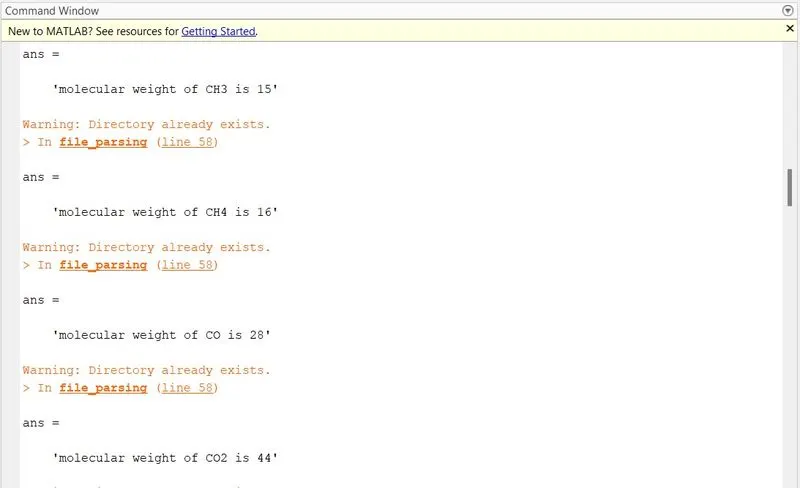
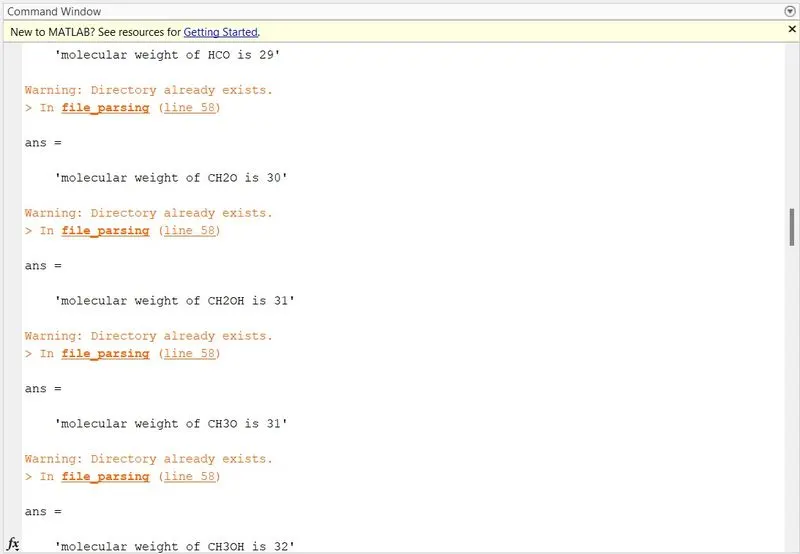
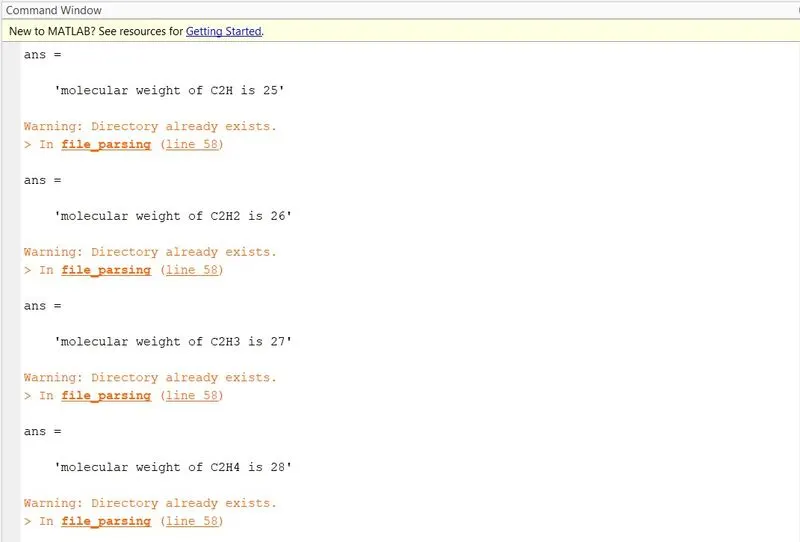
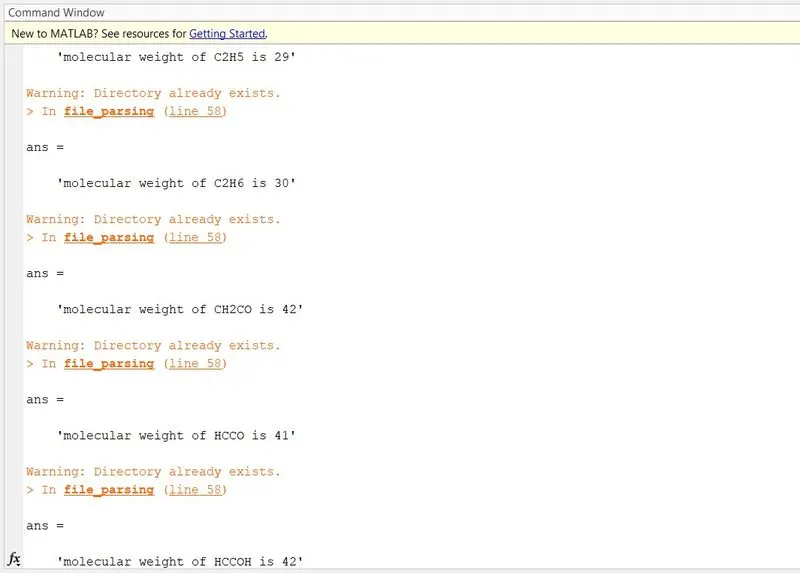
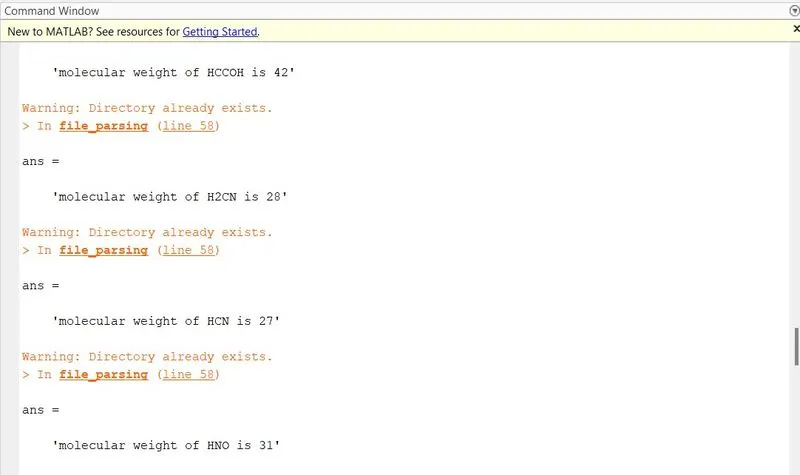
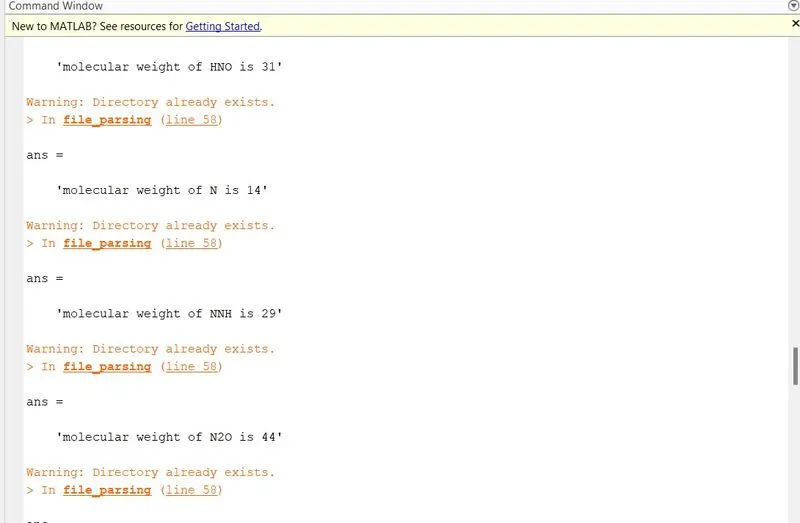
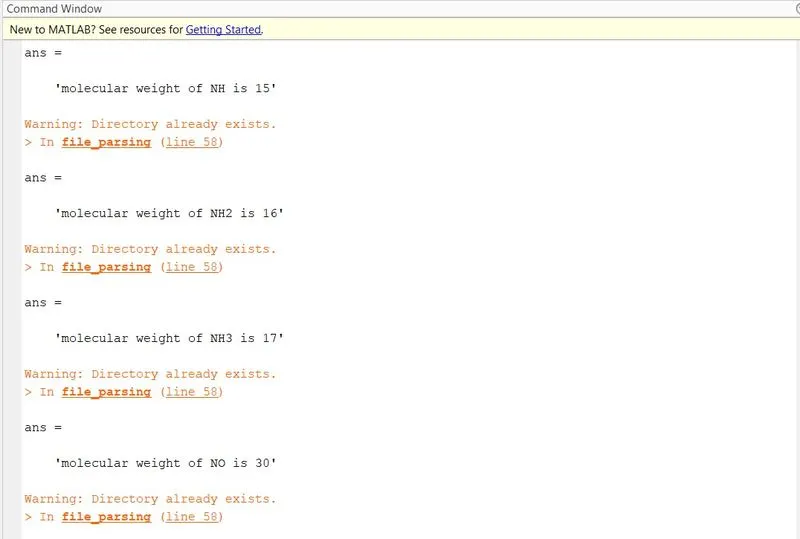
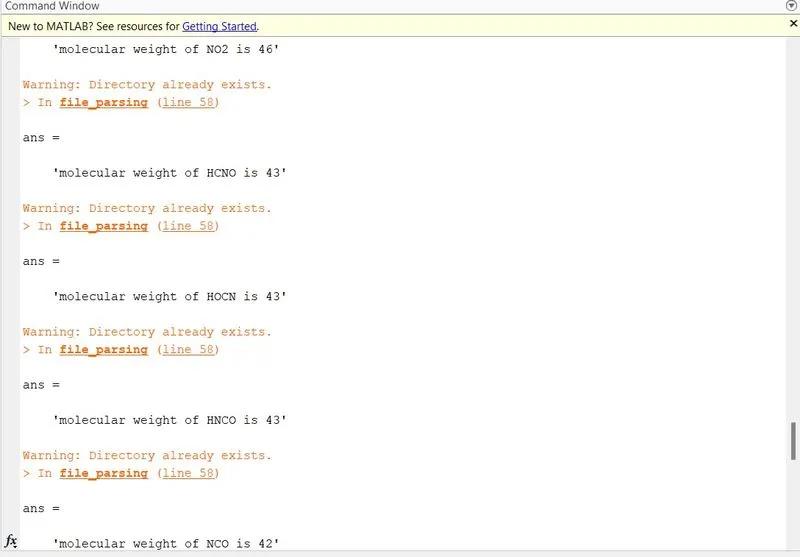
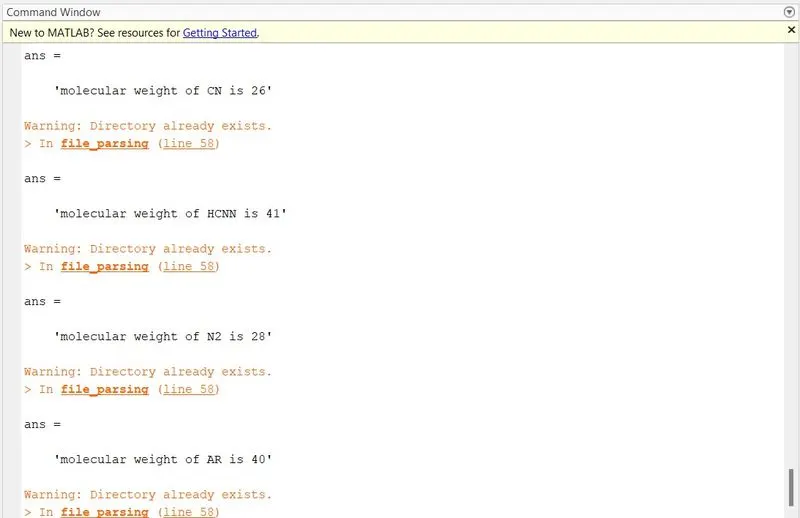
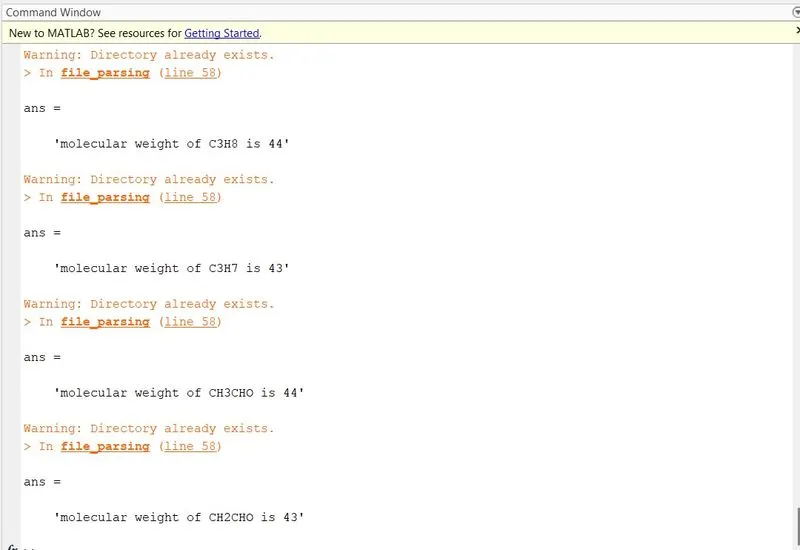
- Display molecular weight of all the species in the command window.
- Plot the Cp, Enthalpy and Entropy for the local temperature range (low temperature : high temperature) specific for each species.
- Save the plots as images with appropriate names and dump them in separate folders for each species with suitable name. All these should be generated automatically.
- The main program that you will submit will just take the "THERMO.dat" file as an input and generate Cp, H and S plots.
- Screenshot of the window where all the folders are saved.
- Plots for o2, N2 and Co2 species.
THEORY:
File Parsing:
- Parsing, syntax analysis, or syntactic analysis is the process of analyzing a string of symbols, either in natural language ,computer languages or data structures, conforming to the rules of a formal grammar. The term parsing comes from Latin pars (orationis), meaning part(of speech).
- The term has slightly different meanings in different branches of linguistics and computer science. Traditional sentence parsing is often performed as a method of understanding the exact meaning of a sentence or word, sometimes with the aid of devices such as sentence diagrams. It usually emphasizes the importance of grammatical divisions such as subject and predicate.
- Within computational linguistics the term is used to refer to the formal analysis by a computer of a sentence or other string of words into its constituents, resulting in a parse tree showing their syntactic relation to each other, which may also contain sematic and other information (p-values). Some parsing algorithms may generate a parse forest or list of parse trees for a syntactically ambigious input.
NASA Thermodynamic File:
- In NASA theromdynamic file 'THERMO.dat' ,53 species are given with 14 coefficients we have to parse the useful data from the file and by using these 14 coefficients we have to find out enthalpy.entropy and specific heat of these species .
- Where,
R = Universal Gas constant
T = Temperature
Cp = Specific heat (KJ)
S = Entropy(KJ/mol-K)
H = Enthalpy(KJ/mol)
a(i) = Coefficients where, i = 1 to 14
Specific heat(cp) :
- In thermodynamics, the specific heat capacity (symbol cp) of a substance is the heat capacity of a sample of the substance divided by the mass of the sample, also sometimes referred to as massic heat capacity. Informally, it is the amount of heat that must be added to one unit of mass of the substance in order to cause an increase of one unit in temperature. The SI unit of specific heat capacity is joule per kelvin per kilogram, J⋅kg−1⋅K−1. For example, the heat required to raise the temperature of 1 kg of water by 1 K is 4184 joules, so the specific heat capacity of water is 4184 J⋅kg−1⋅K−1.

Enthalpy(h):
- Enthalpy is a property of a thermodynamic system, is the sum of the system's internal energy and the product of its pressure and volume.It is a state function used in many measurements in chemical, biological, and physical systems at a constant pressure, which is conveniently provided by the large ambient atmosphere.
- The heat absorbed or released during a process at constant pressure is equal to the change in enthalpy.
Sometimes referred to as “heat content,” enthalpy is a fascinating and uncommon word that most people prefer to use - Enthalpy H can be written as,(Generally)
H = U + pV
Where, H = Enthalpy of the system
U = Internal energy of the system
p = Pressure of the system
V = Volume of the system
- Here the equations that we are going to use for enthalpy calculation is :

Entropy(s):
- Entropy, the measure of a system’s thermal energy per unit temperature that is unavailable for doing useful work. Because work is obtained from ordered molecular motion, the amount of entropy is also a measure of the molecular disorder, or randomness, of a system.
- Entropy is the ratio of change in heat over absolute temperature and the SI unit of entropy J/K.
- Here the equations that we are going to use for entropy calculation is :

3.PROGRAM DESCRIPTION:
Matlab Main Code:
clear all
close all
clc
f=fopen('THERMO.dat','r');

for i=1:5
    fgetl(f);
end

% extraction of local temperatures
for j=1:53
a=fgetl(f);

b=strsplit(a,' ');
species=b{1};
local_low=str2num(b{end-3});
local_high=str2num(b{end-2});
local_mid=str2num(b{end-1});

% Extraction of coefficients
coeff_line1=fgetl(f);
pos_e=strfind(coeff_line1,'E');
a1=str2num(coeff_line1(1:pos_e(1)+3));
a2=str2num(coeff_line1((pos_e(1)+4):(pos_e(2)+3)));
a3=str2num(coeff_line1((pos_e(2)+4):(pos_e(3)+3)));
a4=str2num(coeff_line1((pos_e(3)+4):(pos_e(4)+3)));
a5=str2num(coeff_line1((pos_e(4)+4):(pos_e(5)+3)));

coeff_line2=fgetl(f);
pos_e1=strfind(coeff_line2,'E');
a6=str2num(coeff_line2(1:pos_e1(1)+3));
a7=str2num(coeff_line2((pos_e(1)+4):(pos_e(2)+3)));
a8=str2num(coeff_line2((pos_e(2)+4):(pos_e(3)+3)));
a9=str2num(coeff_line2((pos_e(3)+4):(pos_e(4)+3)));
a10=str2num(coeff_line2((pos_e(4)+4):(pos_e(5)+3)));

coeff_line3=fgetl(f);
pos_e2=strfind(coeff_line3,'E');
a11=str2num(coeff_line3(1:pos_e1(1)+3));
a12=str2num(coeff_line3((pos_e(1)+4):(pos_e(2)+3)));
a13=str2num(coeff_line3((pos_e(2)+4):(pos_e(3)+3)));
a14=str2num(coeff_line3((pos_e(3)+4):(pos_e(4)+3)));

% calculation of cp ,h, s
R=8.314; % gas constant(J/mol-k)
T=linspace(local_low,local_high,1000);
% calculation of specific heat (cp)
cp=specific_heat(a1,a2,a3,a4,a5,a8,a9,a10,a11,a12,T,R,local_mid);
% calculation of enthalpy (h)
h=enthalpy(a1,a2,a3,a4,a5,a6,a8,a9,a10,a11,a12,a13,T,R,local_mid);
% calculation of entropy (s)
s=entropy(a1,a2,a3,a4,a5,a7,a8,a9,a10,a11,a12,a14,T,R,local_mid);

% creating a folder
% Saving in a folder

%     cd('C:\Users\RAVI RANJAN KUMAR\Desktop\skill lync')  % changing directory
    mkdir(species);  %creating directory
    cd(species);  % changing directory


%Plotting Cp, H and S with Temperature
 % Plot cp vs T
figure(1)
plot(T,cp,'LineWidth',3,'Color','g')
xlabel('Temperature (K)');
ylabel('Specific heat (KJ)');
title(sprintf('Specific heat vs Temperature range of %s',species));
grid on
saveas(figure(1),'Specific Heat.jpg');

% Plot T vs h
figure(2)
plot(T,h,'LineWidth',3,'Color','k')
xlabel('Temperature (K)');
ylabel('enthalpy (KJ/mol-K)');
title(sprintf('Enthalpy vs Temperature range of %s',species));
grid on
saveas(figure(2),'Enthalpy.jpg');

% Plot T vs s
figure(3)
plot(T,s,'LineWidth',3,'Color','b')
xlabel('Temperature (K)');
ylabel('entropy (KJ/mol-K)');
title(sprintf('Entropy vs Temperature range of %s',species));
grid on
saveas(figure(3),'Entropy.jpg');

% cd('C:\Users\RAVI RANJAN KUMAR\Desktop\skill lync')  %Changing directory to Original matlab path
cd ..
 %Molecular weight
[W] = Molecular_weight(species);


 end
Code description:
- Firstly we will open the 'THERMO.dat' file by using fopen command and then we will put'r' to read that file.
- To read the file line by line we will be using fgetl command , which will read each line one by one in a sequence and we will apply for loop to read 5 lines using fgetl command .
- As we know that in the file the next line is having the low temperature ,medium temperature and high temperature so we will read that by fgetl.
- Using strsplit command we will split that string across the spaces that it is having as shown in main code.
- We will get the species name from that and store it in species.
- Now local_low,local_high and local_mid temperatures will be taken from variable 'b' using str2num command .str2num converts string to number and further we will use indexing to get the exact value of temperatures as shown in code.
- Now for the position of coefficients we will use fgetl again to read the next line and we will find the position of 'E' fro that line by using strfind .
- When we will find the position of 'E' in the coeff_line1,we will find out coefficients again using str2num and we will be doing again indexing as shown here. i.e. a2=str2num(coeff_line1((pos_e(1)+4):(pos_e(2)+3)));
- In the similar way we will find out all the 14 coefficients . i.e. a1,a2,a3,a4.......a14.
- we will be using the value of gas constant as R=8.314(J/mol-K) and for temperature range of a species we will be using linspace command as T=linspace(local_low,local_high,1000); it means it is having 1000 values between lower temperature and higher temperature .
- Now we will calculate the specific heat(cp),enthalpy(h) and entropy(s) by calling the functions of cp,h and s that we have already created and we will be giving the appropriate input accordingly.
- To create a folder we will be using command mkdir(species); ,and we will give name to the folder as species and we willchange the directory of folder by using cd command as shown in code.
- To plot the graphs we will use plot command ,and the plots will be made between teperature and specific heat ,temperature and enthalpy ,temperature and entropy.
- we will save plots with labels of x and y labels by using xlabel and ylabel command .title of plot will be given by using title command.
- To save the figures on the hard disk we will be using saveas command ,as shown in code.
- To display the molecular weight we will be calling the function of molecular weight and will be displaying it in the command window as shown in the code.
- We will then apply for loop loop for all the 53 species to get their coefficients and for all the plots and molecular weight .
Function to find specific heat :
function cp=specific_heat(a1,a2,a3,a4,a5,a8,a9,a10,a11,a12,T,R,local_mid)
if (T>local_mid)
    cp=R*(a1+(a2*T)+(a3*T.^2)+(a4*T.^3)+(a5*T.^4));
else
    cp=R*(a8+(a9*T)+(a10*T.^2)+(a11*T.^3)+(a12*T.^4));
end
Code description:
- To find the specific heat we will create a function named as 'specific_heat' ,as per the equation of specific heat shown above .(In theory).
- In this function we are using If-else loop , when temperature will be more than local mid temperature a1 to a5 coefficients will be taken into consideration ,where as if tempearature will be less then equation with coefficients a8 to a12 will be followed and corresponding equation will be followed.
Function to find enthalpy :
function h=enthalpy(a1,a2,a3,a4,a5,a6,a8,a9,a10,a11,a12,a13,T,R,local_mid)
if (T>local_mid)
h=R*T.*(a1+(a2*T)/2+((a3*T.^2)/3)+((a4*T.^3)/4)+((a5*T.^4)/5)+a6./T);
else
h=R*T.*(a8+(a9*T)/2+((a10*T.^2)/3)+((a11*T.^3)/4)+((a12*T.^4)/5)+a13./T);
end
Code description:
- To find the enthalpy we will be using above function,in this function we are using if -else loop.
- When temperature will be more than local_mid then we will be using equation with coefficients a1 to a6 ,where as when temperature will be lower than local_mid then equation with a8 to a13 coeefecients will be used and the corresponding equation will be followed for the calculation of enthalpy.
Function to find entropy :
function s=entropy(a1,a2,a3,a4,a5,a7,a8,a9,a10,a11,a12,a14,T,R,local_mid)
if (T>local_mid)
s=R*(a1*log(T)+a2*T+((a3*T.^2)/2)+((a4*T.^3)/3)+((a5*T.^4)/4)+a7);
else
    s=R*(a8*log(T)+a9*T+((a10*T.^2)/2)+((a11*T.^3)/3)+((a12*T.^4)/4)+a14);
end
Code description:
- To find entropy we will be using similar code as we have used for specific heat ,enthalpy and entropy.
- Here also we are using if-else condition ,when temperature will be more than local_mid then equation with coefficients a1to a7 will be followed and if temperature is less than local_mid then else condition will be used and R is universal gas constant ,T is temperature.
Function to find Molecular weight :
function [W] = Molecular_weight(species)

    % Defining  name of the species
    atomic_name = ['H','C','O','N','A'];

    % Defining Atomic masses of  species
    atomic_weight = [1 ,12, 16 ,14 ,40];

    W=0;  % Molecular weight starting value

    for i=1:length(species)   % Loop runs upto the length of the species
        for j=1:length(atomic_name)  % Loop runs upto the length of the atomic names
            if strcmpi(species(i), atomic_name(j))  %function to compare  strings
                W = W + atomic_weight(j);
                position = j;
            end
        end
        n = str2double(species(i));   % Now we will find if there is more element in the species then incrementing atomic weight of the species

        if n>1
            W = W + atomic_weight(position)*(n-1);
        end
    end
    sprintf('molecular weight of %s is %d',species,W)

end
Code description:
- we will create an function W for molecular weight and input to that function will be species.
- Then we will define the names of the elements present in all the species.
- Then we will define atomic weight of all the elements that we defined previously .
- now taking initial molecular weight W=0, we will create a for loop that runs upto the length of the species and their is another loop which runs upto the length of the atomic_name.
- Then we will use strcmp to compare species with the atomic_name ,if it matches then molecular weight we get calculated as shown in code.
- Now we will find if there is more element in the species then incrementing atomic weight of the species and we will get the number and assign it to n.
Error Rectification:
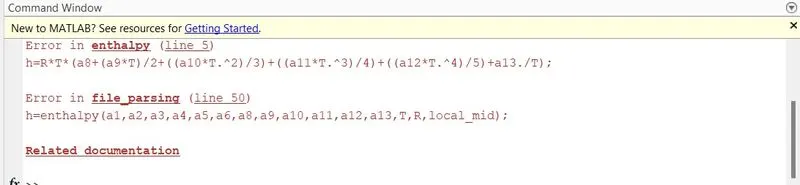
- Element wise operator not used while cretaing the function for calculation of enthalpy.Fixed this by applying (.) in the enthalpy function.

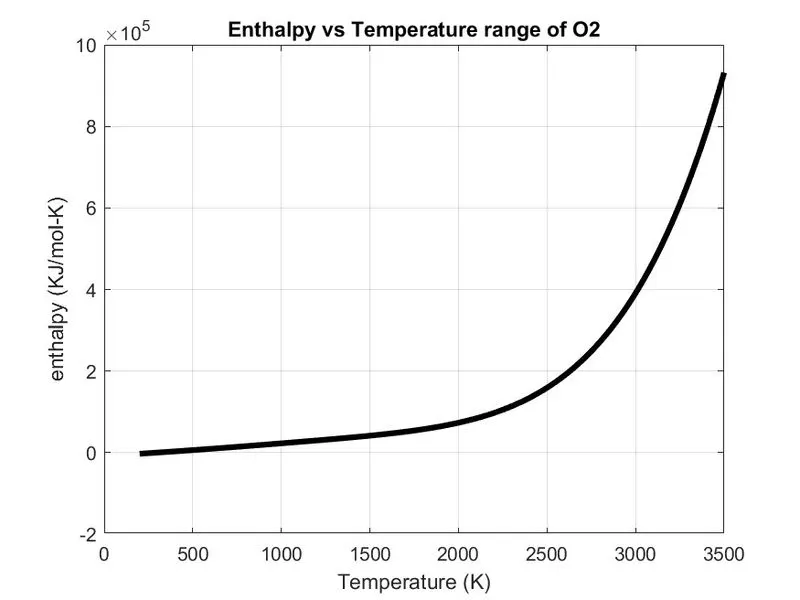
- It is showing that with increase in temperature enthalpy increases after 2000 k suddenly.
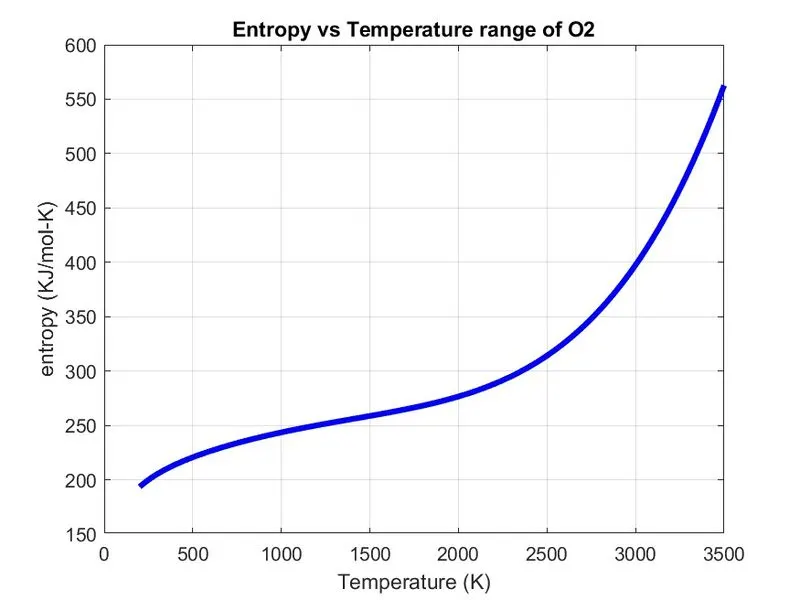
- It also shows that entropy increases with temperature .
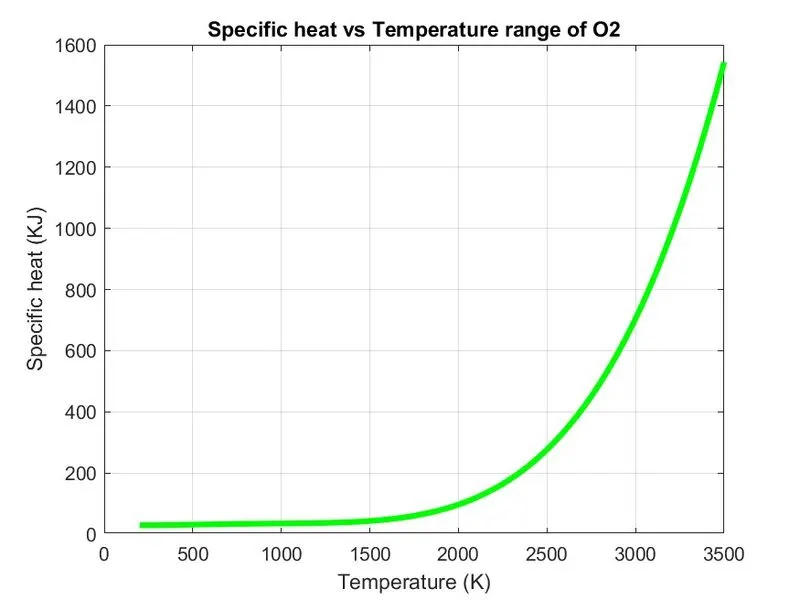
- Specific heat increases with temperature after 1500K.
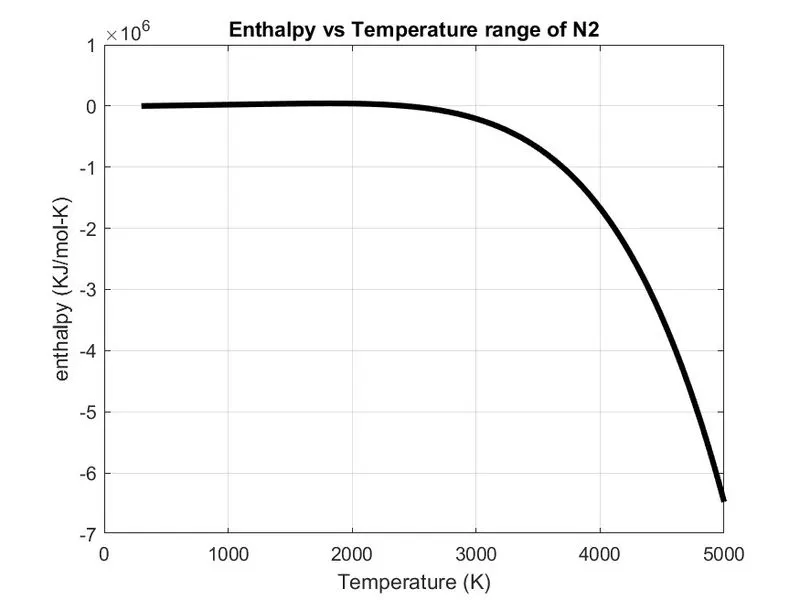
- It is showing that enthalpy decreases with increase in temperature.
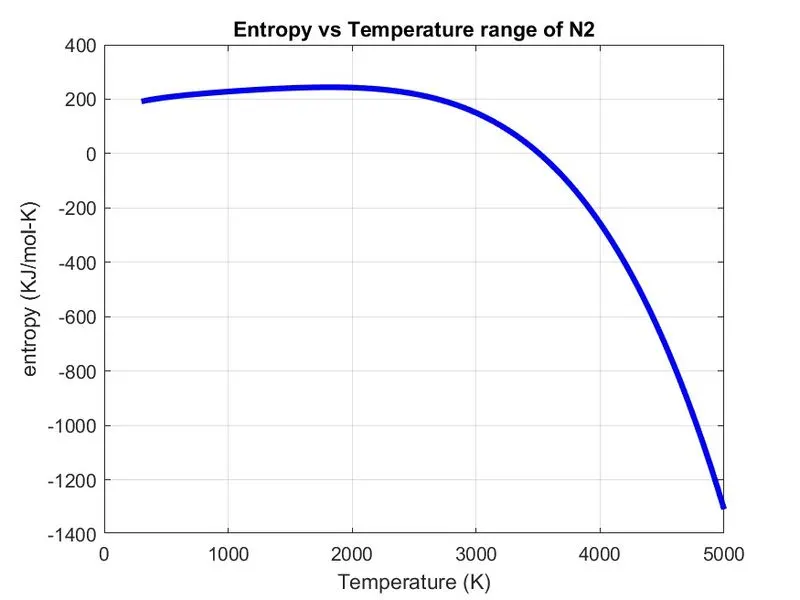
- It shows that entropy decreases ith temperature.
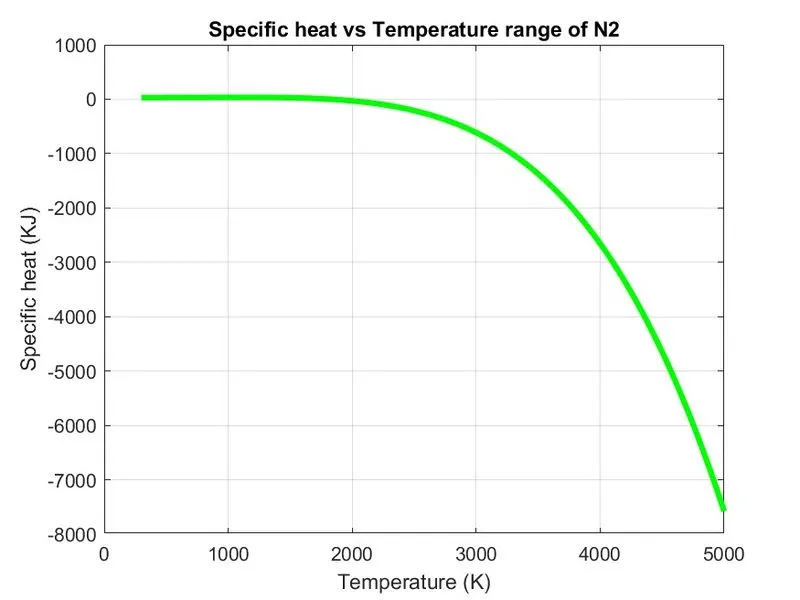
- It shows that specific heat decreases with temperature.
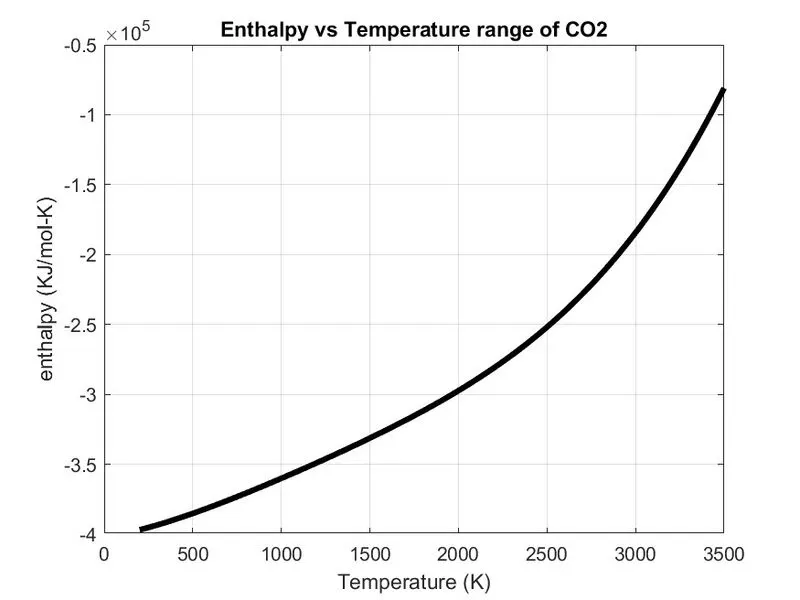
- Here enthalpy and temperature is having linear kind of relationship .(approx)
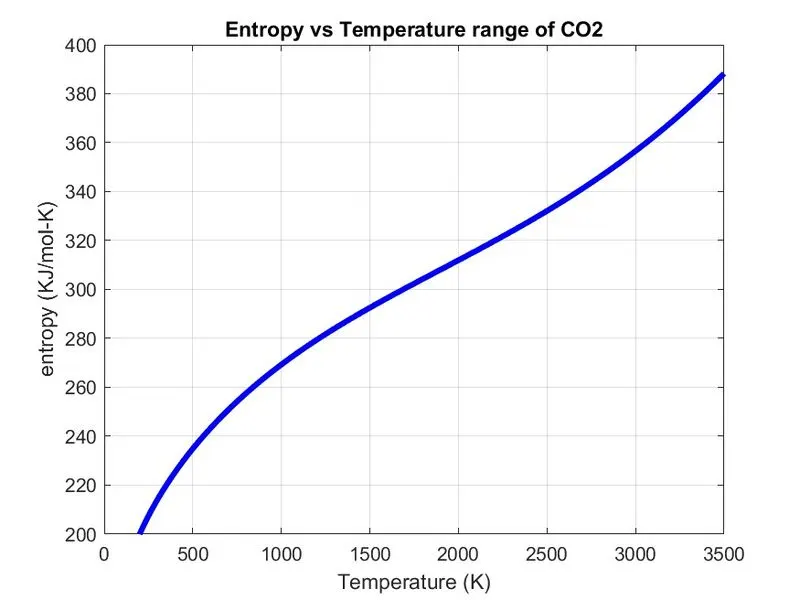
- Here also with increase in temperature entropy is increasing.
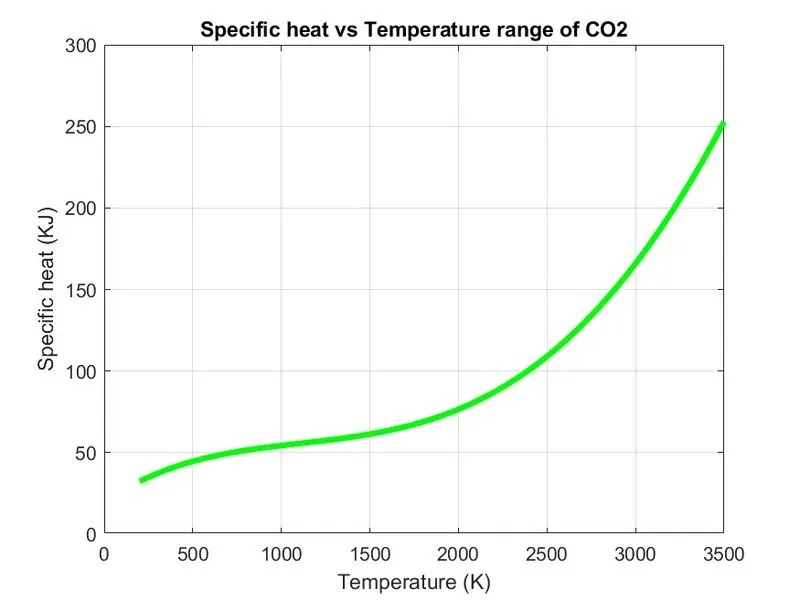
- Specific heat is constant approx upto 1500 K and then starts increasing as shown in fig.
4.CONCLUSION:
- We understood the way to extract relevant data from a particular file and how we can do that .
- We can use file parsing technique on datas having similar patterns of data in their file .
- File parsing technique is used for handling large files of data and we can also create plots as per requirements.
Refrences:
1.https://en.wikipedia.org/wiki/Enthalpy
2.https://byjus.com/physics/enthalpy/