Project 1 - Parsing NASA thermodynamic data
AIM: To write a program in matlab to parse the NASA thermodynamic data file and then calculate the thermodynamic properties of various gas species.
OBJECTIVE:
- To write a function that extracts the 14 co-efficient and calculates the enthalpy ,entropy and specific heats for all species in the data file.
- Calculating the molecular weight of each species and displaying it in command window.
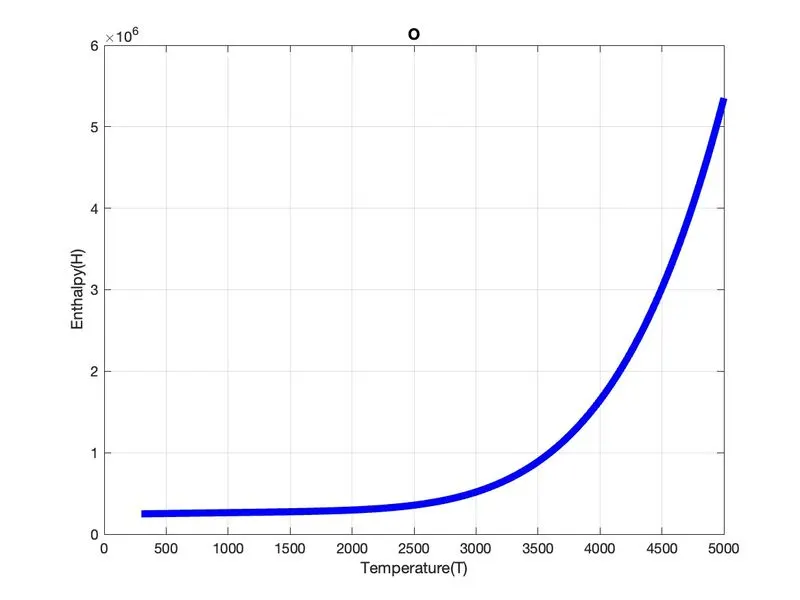
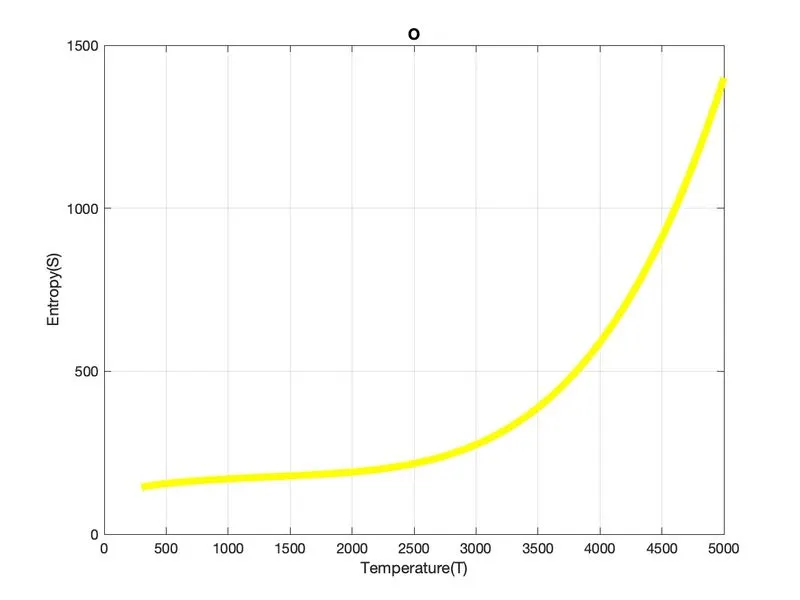
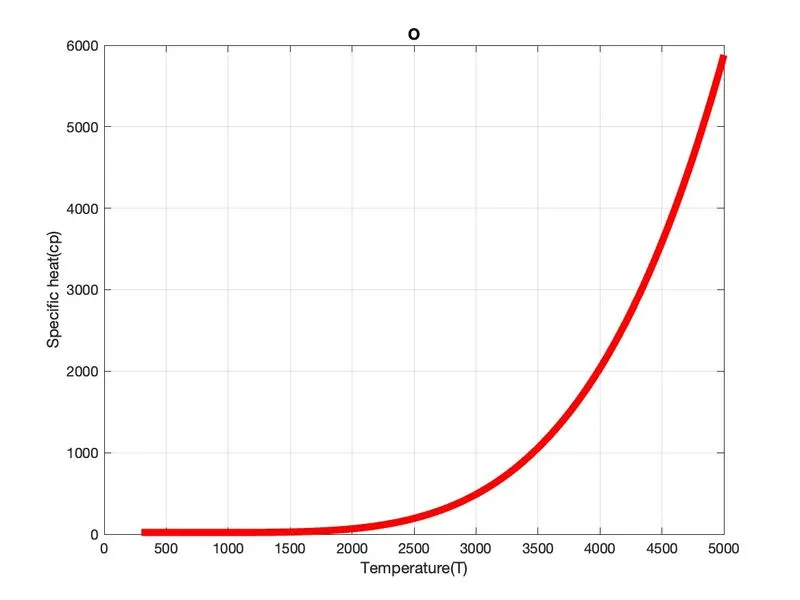
- Plotting cp, enthalpy and entropy for local temperature range specific for each species.
- Save the plot as images with appropriate names and dump them in separate folders for each species with suitable name.
INTRODUCTION:
PARSING DATA:
- Parsing means to make something understandable. For programming this means to convert information represented in one form into another form that's easier to work with. This is done by partially analysing the data, understanding its underlying structure (by making some assumptions based on what you're expecting to see), and then explicitly representing that structure in the code.
- Parsing a file means reading in a data stream of some sort and building an in memory model of the semantic content of that data. This aims at facilitating perfoming some kind of transformation on the data.
PARSING NASA THERMO DAT FILE:
- THERMO.dat file is a data file containing 14 coefficients for 53 different species given by NASA.
- These coefficients are utilized to calculate the specific heat, enthalpy & entropy for a particular element.
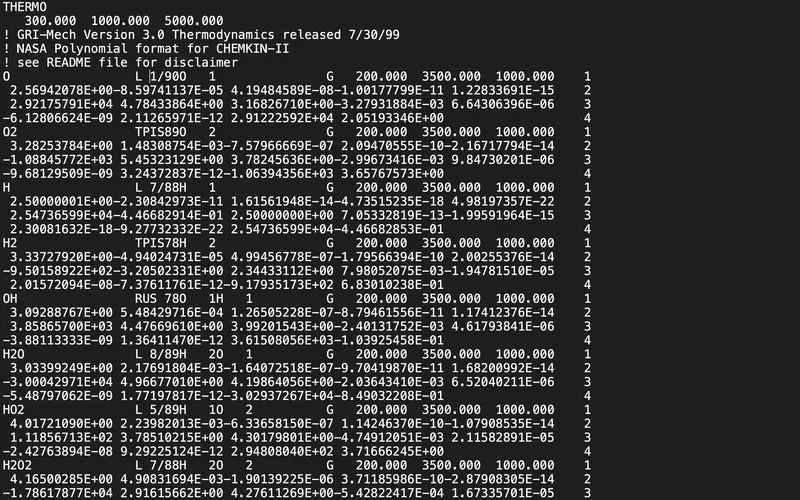
- Each species has its own range of local temperature. Below screenshot of the THERMO.dat file is displayed.
- In this file, the 2nd line has the global temperature(low, mid & high)
- Then from 6th line we have the species data of 53 different species.
- Each element has 4 lines of species data, where 1st line has the temperature data of the species and the other 3 lines have the 14 coefficients of the species as shown in the figure below.
EQUATIONS:
NASA came up with polynomials that can be used to evaluate thermodynamic properties such as Cp, H, and S. They have documented the coefficients that are required to evaluate these polynomials for 1000+ species.
`c_p/R=a_1+a_2T+a_3T^2+a_4T^3+a_5T^4`
`H/(RT)=a_1+(a_2T)/2+(a_3T^2)/3+(a_4T^3)/4+(a_5T^4)/5+a_6T`
`S/R=a_1lnT+a_2T+(a_3T^2)/2+(a_4T^3)/3+(a_5T^4)/4+a_7`
Where R is the universal gas constant, T is the temperature and a1, a2, a3, a4, a5, a6, and a7 are the numerical coefficients supplied in the thermodynamic file. The FIRST 7 coefficients are HIGH-temperature coefficients (above 1000 K) and the SECOND 7 coefficients are LOW-temperature coefficients (below 1000 K).
MATLAB code:
MAIN CODE:
clear all
close all
clc

%syntax to open the  file THERMO.dat
f1=fopen('THERMO.dat','r');

%To read lines
l1=fgetl(f1);
l2=fgetl(f1);
value=strsplit(l2,' ');

%To get global temperatures from file in number form
global_lowtemp=str2num(value{2})
global_midtemp=str2num(value{3})
global_hightemp=str2num(value{4})

%Defining Temperature range and Molar Gas Constant
T=linspace(global_lowtemp,global_hightemp,1000);
R=8.314;

%skipping next 3 lines
l3=fgetl(f1);
l4=fgetl(f1);
l5=fgetl(f1);

%Reading species ,calcuating cp,h,s and plotting
for i=1:53
    tline=fgetl(f1);

    A=strsplit(tline,' ');
    name_of_species=(A{1});
    lowtemp= str2num(A{end-3});
    midtemp=str2num(A{end-2});
    hightemp=str2num(A{end-1});

    %Finding 7 higher coefficients and 7 lower coefficients

    tline1=fgetl(f1);
    a=findstr(tline1,'E');

    a1=tline1(1:a(1)+3);
    a1=str2num(a1);
    a2=tline1(a(1)+4:a(2)+3);
    a2=str2num(a2);
    a3=tline1(a(2)+4:a(3)+3);
    a3=str2num(a3);
    a4=tline1(a(3)+4:a(4)+3);
    a4=str2num(a4);
    a5=tline1(a(4)+4:a(5)+3);
    a5=str2num(a5);

    tline2=fgetl(f1);
    a=findstr(tline2,'E');

    a6=tline2(1:a(1)+3);
    a6=str2num(a6);
    a7=tline2(a(1)+4:a(2)+3);
    a7=str2num(a7);
    a8=tline2(a(2)+4:a(3)+3);
    a8=str2num(a8);
    a9=tline2(a(3)+4:a(4)+3);
    a9=str2num(a9);
    a10=tline2(a(4)+4:a(5)+3);
    a10=str2num(a10);


    tline3=fgetl(f1);
    a=findstr(tline3,'E');
    a11=tline3(1:a(1)+3);
    a11=str2num(a11);
    a12=tline3(a(1)+4:a(2)+3);
    a12=str2num(a12);
    a13=tline3(a(2)+4:a(3)+3);
    a13=str2num(a13);
    a14=tline3(a(3)+4:a(4)+3);
    a14=str2num(a14);

    %calculate specific heat(cp),Enthalpy(H),Entropy(S)

    if(T>=global_midtemp)

        H=R*((a1*T)+((a2*(T).^2)/2)+((a3*(T).^3)/3)+((a4*(T).^4)/4)+((a5*(T).^5)/5)+a6);
        S=R*(a1.*log(T)+(a2*T)+((a3*(T).^2)/2)+((a4*(T).^3)/3)+((a5*(T).^4)/5)+a7);
        cp=R*(a1+(a2*T)+(a3*(T).^2)+(a4*(T).^3)+(a5*(T).^4));

    else
        H=R*((a8*T)+((a9*(T).^2)/2)+((a10*(T).^3)/3)+((a11*(T).^4)/4)+((a12*(T).^5)/5)+a13);
        S=R*(a8.*log(T)+(a9*T)+((a10*(T).^2)/2)+((a11*(T).^3)/3)+((a12*(T).^4)/4));
        cp=R*(a8+(a9*T)+(a10*(T).^2)+(a11*(T).^3)+(a12*(T).^4));
    end

    %calculating molecular weight and printing it.
    MW=wt(name_of_species);
    fprintf('molecular weight of %s is %f\n',name_of_species,MW);

    %PLOTTING CP,H,T

    cd('/Users/yuvarajcu/Documents/skill lync/MATLAB')
    %creating the folder
    mkdir(name_of_species);
    cd(name_of_species);

    %plotting T vs cp
    figure(1)
    plot(T,cp,'linewidth',5,'color','r')
    xlabel('Temperature(T)')
    ylabel('Specific heat(cp)')
    grid on
    title(name_of_species)
    saveas(figure(1),'specific heat.jpg');


    %Plotting T vs H
    figure(2)
    plot(T,H,'linewidth',5,'color','b')
    xlabel('Temperature(T)')
    ylabel('Enthalpy(H)')
    grid on
    title(name_of_species)
    saveas(figure(2),'Enthalpy.jpg');


    %Plotting T vs S
    figure(3)
    plot(T,S,'linewidth',5,'color','y')
    xlabel('Temperature(T)')
    ylabel('Entropy(S)')
    grid on
    title(name_of_species)
    saveas(figure(3),'Entropy.jpg');

    cd('/Users/yuvarajcu/Documents/skill lync/MATLAB')
end
Code for calculating molecular weight by calling function wt( ):
function MW=wt(species_name)

Elements=['H' 'C' 'O' 'N' 'A' 'S'];
Atomic_weight =[1 12 16 14 40 32];
species=upper(species_name)

MW=0;

for i=1:length(species)
  for    j=1:length(Elements)

    if strcmp(species(i),Elements(j))

        MW=MW+Atomic_weight(j);
        k=j;

    else
        n=str2double(species(i));
        if (n>1)
            MW=MW+Atomic_weight(k)*(n-1);
            break
        end
    end
  end
end
Explanation for code:
- Initially, 'fopen' command is used to open the file ‘THERMO.dat’ .
- Then,‘fgetl’ is used accordingly to start read the first two lines, after which we use 'strsplit' and 'str2num' commands tosplit and convert the strings to numbers and assign values for the global (low,mid and high) temperatures.
- Then the temperature range abd the value of Molar gas Constant (R) are defined for calculation and plotting purpose.
- Then again using the 'fgetl' command to read the next 3 lines but skipping it.
- Then a 'for loop' is used to get the species data having temperatures (low, mid, high) and the 14 coefficients of 53 different species.
- In the 'for loop', the 'fgetl' command is used to get the species name and the three local temperatures which will be read from first line of each species and stored.
- Then again 'fgetl' command is used to read further lines and get all the 14 coefficients of the particular species and store them accordingly
- Then after getting the 14 coefficients, these coefficients and other required data to calculate the cp, H & S
- For molecular weight calculation, 'MW' function is created which takes weight of Hydrogen, Carbon, Nitrogen, Oxygen, Argon and Sulphur as inputs, as all these elements consists of all these atoms.
- Further, a 'for loop is created where ‘strcmp’ command is used to compare elements with species. If they both match then the molecular weight will be calculated.
- Then, take the string of species name and position to calculate their weight. Here ‘n’ is number of molecules of elements present in the species.
- Further the 'cd' command is used to change the directory so that we can save the files at a particular location.After changing the directory ‘mkdir' command is used to create a new folder with the name of the current species and then a ‘cd’ command to make mkdir as the current directory.
- Then plot and figure commands are used to plot three different graphs of temperature vs cp,enthalpy & entropy respectively and saveas command to save the figures in the respective folders created for each species.
- Then changing our directory to again start the loop. So the loop continues to function till we get all the 53 species and then gets terminated.
Syntax Used during Coding
|
fopen : |
Open a file or obtain information about open files |
|
‘r’ : |
Open the file for reading |
|
fgetl |
Read line from file |
|
strsplit |
Split string or character vector at specified delimiter |
|
str2num |
Convert character array or string to numeric array |
|
strfind |
Find one string within another |
|
linspace |
Generate linearly spaced vectors |
|
fprintf |
Write formatted data to file |
|
pwd |
Identify current directory |
|
mkdir |
Make new directory |
|
cd |
Change working directory |
Results:
global_lowtemp = 300
global_midtemp = 1000
global_hightemp = 5000
species = 'O'
molecular weight of O is 16.000000
species = 'O2'
molecular weight of O2 is 32.000000
species = 'H'
molecular weight of H is 1.000000
species = 'H2'
molecular weight of H2 is 2.000000
species = 'OH'
molecular weight of OH is 17.000000
species = 'H2O'
molecular weight of H2O is 18.000000
species = 'HO2'
molecular weight of HO2 is 33.000000
species = 'H2O2'
molecular weight of H2O2 is 34.000000
species = 'C'
molecular weight of C is 12.000000
species = 'CH'
molecular weight of CH is 13.000000
species = 'CH2'
molecular weight of CH2 is 14.000000
species = 'CH2(S)'
molecular weight of CH2(S) is 46.000000
species = 'CH3'
molecular weight of CH3 is 15.000000
species = 'CH4'
molecular weight of CH4 is 16.000000
species = 'CO'
molecular weight of CO is 28.000000
species = 'CO2'
molecular weight of CO2 is 44.000000
species = 'HCO'
molecular weight of HCO is 29.000000
species = 'CH2O'
molecular weight of CH2O is 30.000000
species = 'CH2OH'
molecular weight of CH2OH is 31.000000
species = 'CH3O'
molecular weight of CH3O is 31.000000
species = 'CH3OH'
molecular weight of CH3OH is 32.000000
species = 'C2H'
molecular weight of C2H is 25.000000
species = 'C2H2'
molecular weight of C2H2 is 26.000000
species = 'C2H3'
molecular weight of C2H3 is 27.000000
species = 'C2H4'
molecular weight of C2H4 is 28.000000
species = 'C2H5'
molecular weight of C2H5 is 29.000000
species = 'C2H6'
molecular weight of C2H6 is 30.000000
species = 'CH2CO'
molecular weight of CH2CO is 42.000000
species = 'HCCO'
molecular weight of HCCO is 41.000000
species = 'HCCOH'
molecular weight of HCCOH is 42.000000
species = 'H2CN'
molecular weight of H2CN is 28.000000
species = 'HCN'
molecular weight of HCN is 27.000000
species = 'HNO'
molecular weight of HNO is 31.000000
species = 'N'
molecular weight of N is 14.000000
species = 'NNH'
molecular weight of NNH is 29.000000
species = 'N2O'
molecular weight of N2O is 44.000000
species = 'NH'
molecular weight of NH is 15.000000
species = 'NH2'
molecular weight of NH2 is 16.000000
species = 'NH3'
molecular weight of NH3 is 17.000000
species = 'NO'
molecular weight of NO is 30.000000
species = 'NO2'
molecular weight of NO2 is 46.000000
species = 'HCNO'
molecular weight of HCNO is 43.000000
species = 'HOCN'
molecular weight of HOCN is 43.000000
species = 'HNCO'
molecular weight of HNCO is 43.000000
species = 'NCO'
molecular weight of NCO is 42.000000
species = 'CN'
molecular weight of CN is 26.000000
species = 'HCNN'
molecular weight of HCNN is 41.000000
species = 'N2'
molecular weight of N2 is 28.000000
species = 'AR'
molecular weight of AR is 40.000000
species = 'C3H8'
molecular weight of C3H8 is 44.000000
species = 'C3H7'
molecular weight of C3H7 is 43.000000
species = 'CH3CHO'
molecular weight of CH3CHO is 44.000000
species = 'CH2CHO'
molecular weight of CH2CHO is 43.000000

The Plots of the species 'O' are shown here and you can access other results on clicking this link.
Conclusion :
Using MATLAB code, the necessary coefficients required to evaluate various thermodynamic parameters for different species are extracted from NASA thermodynamic data file. The specific heat, enthalpy, and entropy for all the species are calculated and plotted against the local temperature range. The molecular weight is calculated for all the species.