Project 1 - Parsing NASA thermodynamic data
Aim:
To write a code in MATLAB to parse the NASA thermodynamic data file and calculate thermodynamic properties of various gas species.
Objectives:
- Write a function that extracts the 14 co-efficient and calculates the enthalpy, entropy and specific heats for all the species in the data file. You will be reading this file NASA thermodynamic data
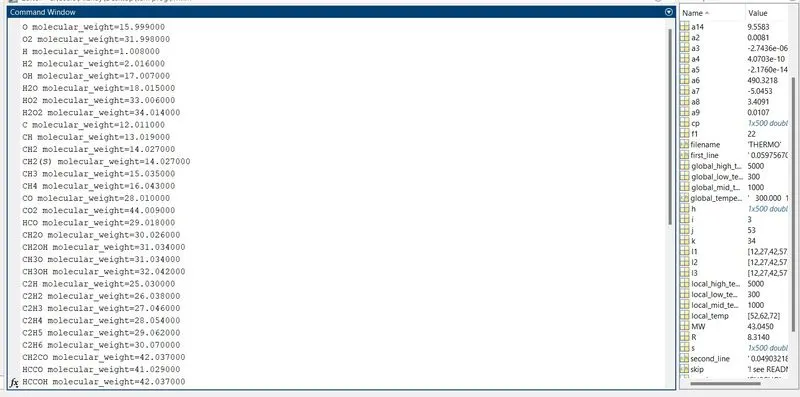
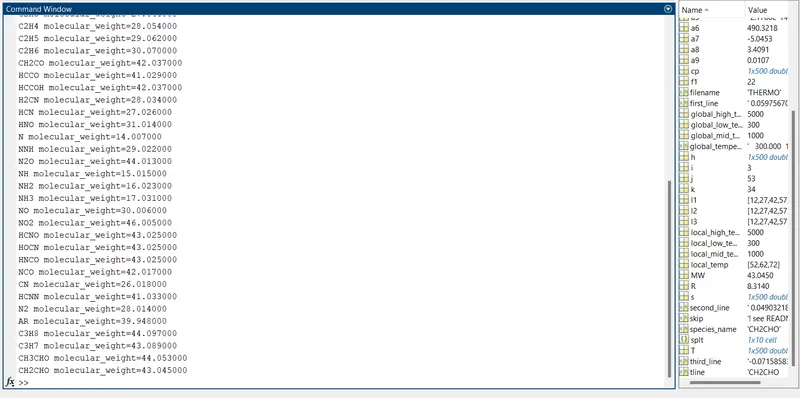
- Calculate the molecular weight of each species and display it in the command window.
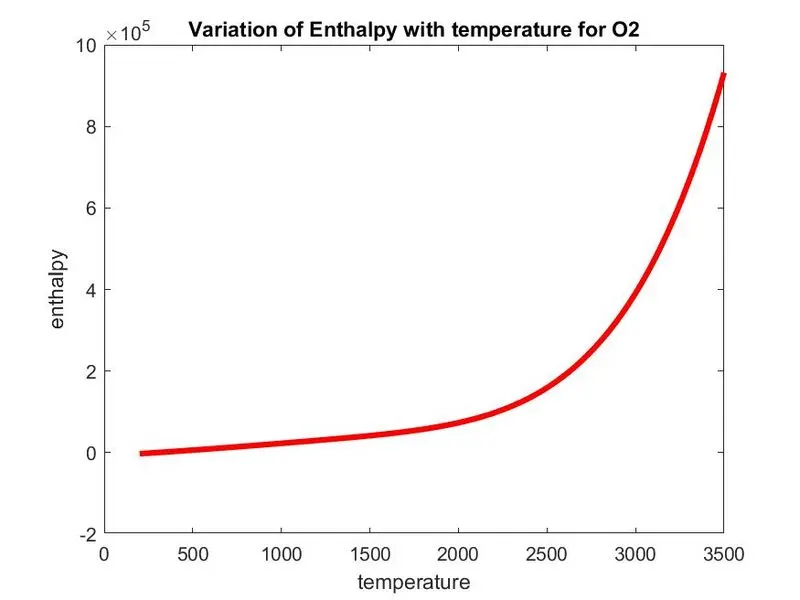
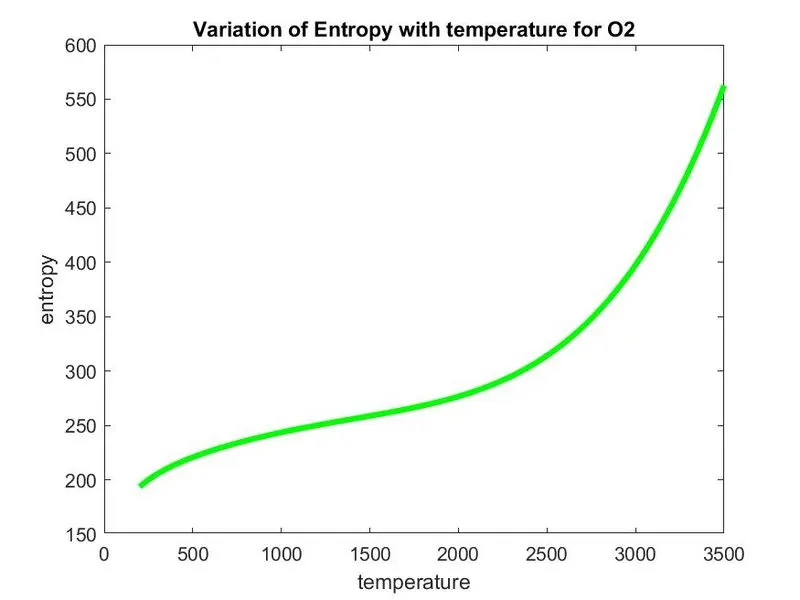
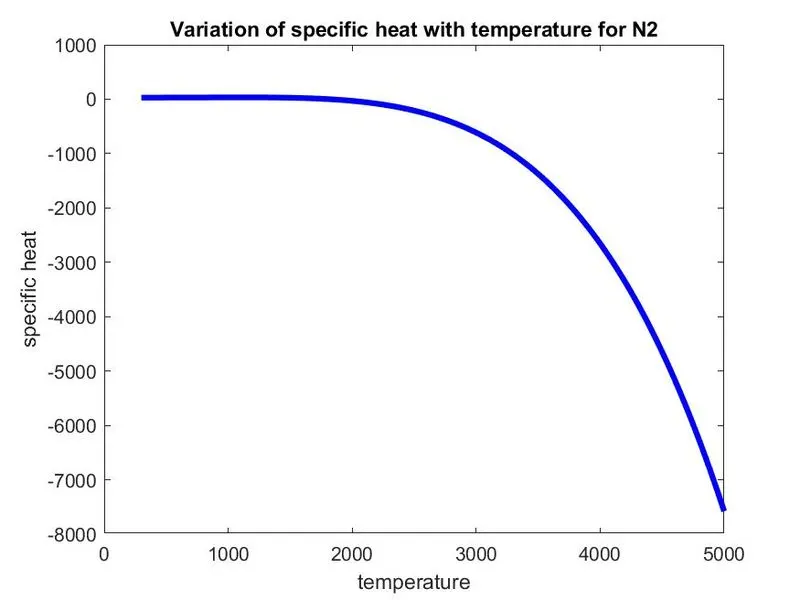
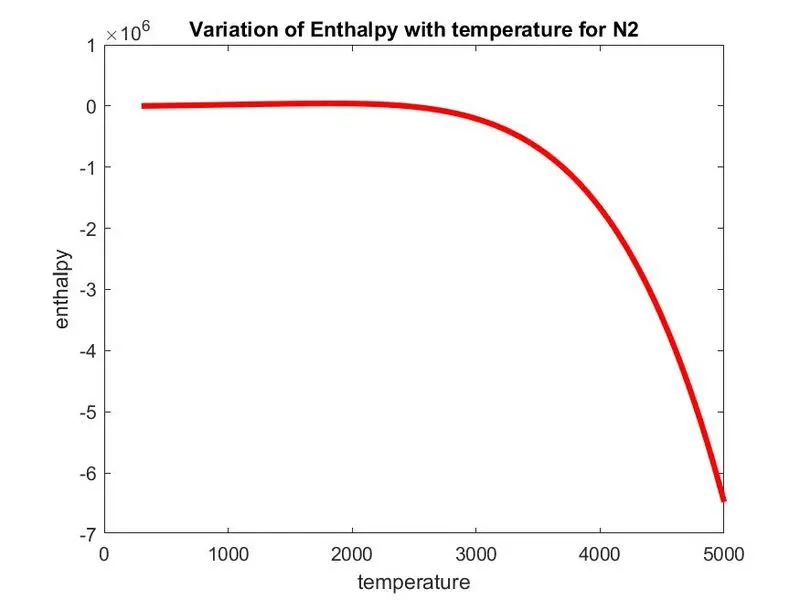
- Plot the Cp, Enthalpy and Entropy for the local temperature range (low temperature: high temperature) specific for each species.
- Save the plots as images with appropriate names and dump them in separate folders for each species with suitable name. All these should be generated automatically.
File parsing:
Parsing in computer languages refers to syntactic analysis of the input code into its components parts in order to facilitate the writing of compilers and interpreters. It can be used to describe split or separation.
Parsing a file means reading in a data stream of some sort and building an in-memory model of the semantic content of that data. This aims at facilitating performing some kind of transformation on the data.
Formulas used:
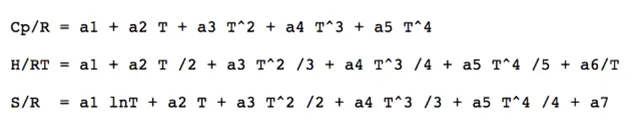
H-Enthalpy
S-Entropy
Cp-Specific heat
R-Universal gas constant(8.314 J/mol.K)
T-Temperature
Enthalpy: It is equal to the internal energy of the system plus the product of pressure and volume.
H = (a1 + a2 T /2 + a3 T^2 /3 + a4 T^3 /4 + a5 T^4 /5 + a6/T)*R*T
Entropy: A thermodynamic quantity representing the unavailability of a system's thermal energy for conversion into mechanical work, often interpreted as the degree of disorder or randomness in the system.
S = (a1 lnT + a2 T + a3 T^2 /2 + a4 T^3 /3 + a5 T^4 /4 + a7)*R
Specific heat: The heat in calories required to raise the temperature of one gram of a substance one degree Celsius.
Cp = (a1 + a2 T + a3 T^2 + a4 T^3 + a5 T^4)*R
Molecular weight: The average mass of a molecule of a compound compared to ¹/₁₂ the mass of carbon 12 and calculated as the sum of the atomic weights of the constituent atoms.
Program:
1)Main code-
clear all
close all
clc

%inputs
R=8.314; %universal gas constant

% open the given file for reading
f1=fopen('THERMO.dat','r') ;
filename=fgetl(f1);                       %reading file header
global_temperature_range=fgetl(f1);       %reading the second line
a=strsplit(global_temperature_range,' '); %splitting string from the liine
%defining the temperatures extracted from data file
global_low_temp=str2num(a{2});
global_mid_temp=str2num(a{3});
global_high_temp=str2num(a{4});

% skipping comments in file
for i=1:3
    skip=fgetl(f1);
end

%using for loop to consider 53 elements
for j=1:53
    %extracting species names
tline=fgetl(f1);                %reading the first line whiuch includes the species informations
 splt=strsplit(tline,' ');
 species_name=splt{1};          %rading the species name
 local_temp=strfind(tline,'.'); %finding the position of '.' so that we can extract the local temperatures of species
 local_low_temp=str2num(tline(local_temp(1)-3:local_temp(1)+3));   %storing local low temperature
 local_high_temp=str2num(tline(local_temp(2)-4:local_temp(2)+3));  %storing local high temperature
 local_mid_temp=str2num(tline(local_temp(3)-4:local_temp(3)+3));   %storing local medium temperature

 %extracting higher temperature coefficients
      %extracting coefficients from frist line
 first_line=fgetl(f1);
 l1=strfind(first_line,'E'); %finding position of 'E' so that we can extract the coefficients
 a1=str2num(first_line(1:l1(1)+3));         % Storing 1st coefficient
 a2=str2num(first_line(l1(1)+4:l1(2)+3));   % Storing 2nd coefficient
 a3=str2num(first_line(l1(2)+4:l1(3)+3)) ;  % Storing 3rd coefficient
 a4=str2num(first_line(l1(3)+4:l1(4)+3));   % Storing 4th coefficient
 a5=str2num(first_line( l1(4)+4:l1(5)+3));  % Storing 5th coefficient
       %extracting coefficients from second line
 second_line=fgetl(f1);
 l2=strfind(second_line,'E');   %finding position of 'E' so that we can extract the coefficients
 a6=str2num(second_line(1:l1(1)+3));         % Storing 6th coefficient
 a7=str2num(second_line(l1(1)+4:l1(2)+3));   % Storing 7th coefficient

 %extracting lower temperature coefficients
 a8=str2num(second_line(l1(2)+4:l1(3)+3)) ;  % Storing 8th coefficient
 a9=str2num(second_line(l1(3)+4:l1(4)+3));   % Storing 9th coefficient
 a10=str2num(second_line( l1(4)+4:l1(5)+3)); % Storing 10th coefficient

       %extracting coefficients from third line
 third_line=fgetl(f1);
 l3=strfind(third_line,'E');
 a11=str2num( third_line(1:l1(1)+3));        % Storing 11th coefficient
 a12=str2num( third_line(l1(1)+4:l1(2)+3));  % Storing 12th coefficient
 a13=str2num( third_line(l1(2)+4:l1(3)+3)) ; % Storing 13th coefficient
 a14=str2num( third_line(l1(3)+4:l1(4)+3));  % Storing 14th coefficient


 %ranging the temperature local low temperature to local high temperature
 T=linspace(local_low_temp,local_high_temp,500);
 %calling the thermodynamic properties function
 [cp, h, s] = thermo_properties(a1,a2,a3,a4,a5,a6,a7,a8,a9,a10,a11,a12,a13,a14,R,T,local_low_temp,local_mid_temp,local_high_temp);


  %creating new folders for species
   mkdir(species_name)
   %enterting current folder
   cd(species_name)

   %plot1
   figure(1)
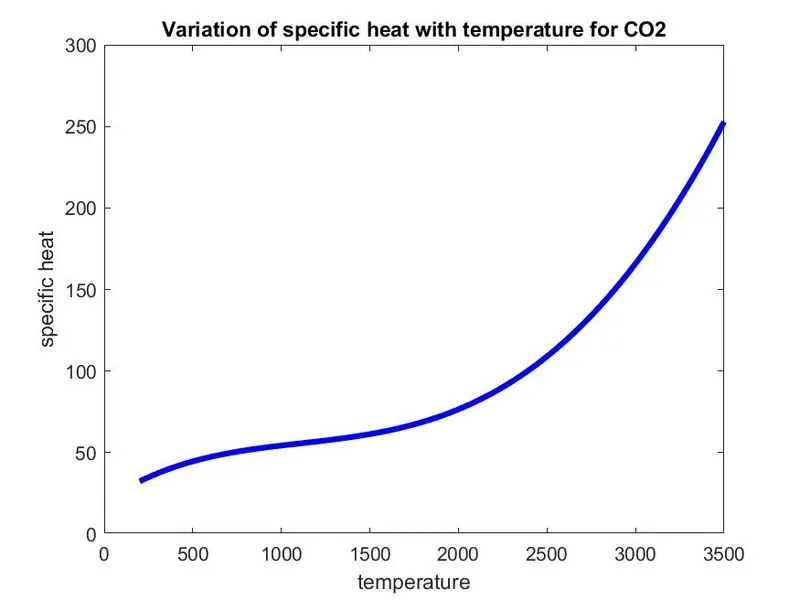
   plot(T,cp,'linewidth', 3,'color','b') %plot for specific heat vs temperature
   xlabel('temperature')
   ylabel('specific heat')
   title(sprintf('Variation of specific heat with temperature for %s', species_name))
   saveas(figure(1),'cp vs T.jpg') %saving plot

   %plot2
   figure(2)
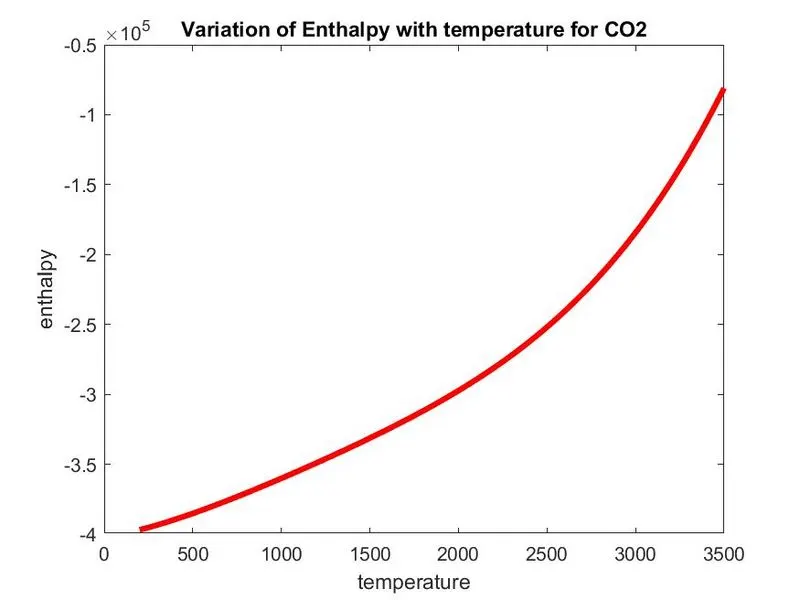
   plot(T,h,'linewidth', 3,'color','r')  %plot for enthalpy vs temperature
   title(sprintf('Variation of Enthalpy with temperature for %s', species_name))
   xlabel('temperature')
   ylabel('enthalpy')
   saveas(figure(2),'h vs T.jpg') %saving plot

   %plot3
   figure(3)
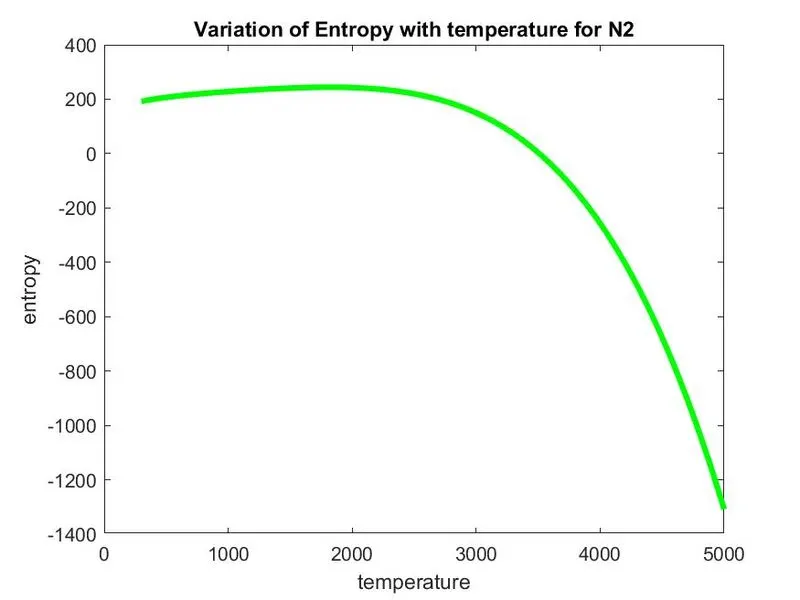
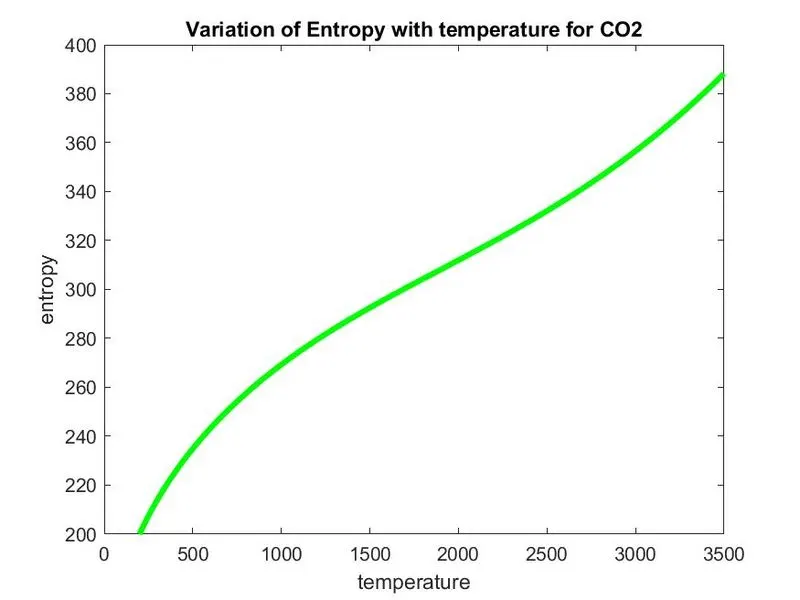
   plot(T,s,'linewidth', 3,'color','g') %plot for entropy vs temperature
   title(sprintf('Variation of Entropy with temperature for %s', species_name))
   xlabel('temperature')
   ylabel('entropy')
   saveas(figure(3),'s vs T.jpg') %saving plot

   %return back to initial directory
   cd ..
   [MW]=mw(species_name);
   k=fprintf('%s molecular_weight=%f\n',species_name,MW);
   %  disp(k) %displaying the molecular weight of the species
 end
Explanation-
Firstly in the program the value of the universal gas constant R is given as 8.314 as an input.
Then using the fopen command which is used to open the THERMO.dat file in the read mode specified by 'r' keyword in the fopen command.
The file is read line by line by using the fgetl command. The first line represents the title if the file so it is ignored.
Since the temperatures are inside the string we use 'strsplit' command that splits the string in the specified delimiter, here ' ' (space) is the delimiter, after splitting the values are assigned to variables ( global low, mid and high temperatures), using 'str2double' command string value is converted to the numeric value.
The next line in the file represents global temperatures, thus the values are stored for temperature calculations.
The next three lines are comments in the file so they are ignored by using a for loop to iterate for 3 values.
Then a for loop is created to loop through the 53 species data given in the file and clculate the required values.
Inside the loop the fgetl command is used to read the next line of the file which represents the name of the species.
The name of the element is stored in a variable using fget1 command.
Then the next line of the file is read which contains the high and low temperature data of the particular species.
The read lines are in the form of a string so they are converted into numbers using the strdouble command and stored in specific variables so they can be used for further calculations.
The low temperatures values are stored in variables a1,a2,a2,a4,a5,a6 and a7 and the high temperature values are stored invariables a8,a9,a10,a11,a12,a13 and a14.
Than creating a directory to save the plots of different species.
Then the temperature array is defined using linspace command as 500 values between the global minimum and global maximmum values.
The next line is the reference to a function called thermodynamic properties which calculates and returns the value of specific heat, enthalpy and entropy using the high and low temperature values as inputs.
The next line is to plots & graph(T-S, T-H & T-Cp) for different species using the given inputs by giving them title, xlabel, ylabel and various plot properties and saving them and mentioning the directory.
Now changing directory for calculating molecular weight.
The next line is the reference to a function that calculates the molecular weights of the different elements.
The next line is the reference to a fprintf function that writes the molecular weights of diferent elements in command window.
The next line is the reference to a function that writes the molecular weights of diferent elements to a file.
2)Coded for Thermodynamics properties function that calculates Specific heat, Enthapy and Entropy -
function [cp,h,s]= thermo_properties(a1,a2,a3,a4,a5,a6,a7,a8,a9,a10,a11,a12,a13,a14,R,T,local_low_temp,local_mid_temp,local_high_temp)

for k=1:length(T);

   if T<=local_mid_temp

      %specific heat
      cp=(a1+(a2.*T)+(a3.*T.^2)+(a4.*T.^3)+(a5.*T.^4))*R;
      %enthalpy
      h=(a1+(a2.*T/2)+((a3.*T.^2)./3)+((a4.*T.^3)./4)+((a5.*T.^4)./5)+(a6/T)).*R.*T;
      %entropy
      s=((a1.*log(T))+(a2.*T)+((a3.*T.^2)/2)+((a4.*T.^3)/3)+((a5.*T.^4)/4)+a7).*R;

   else

      %specific heat
      cp=(a8+(a9.*T)+(a10.*T.^2)+(a11.*T.^3)+(a12.*T.^4)).*R;
      %enthalpy
      h=(a8+(a9.*T/2)+((a10.*T.^2)./3)+((a11.*T.^3)./4)+((a12.*T.^4)./5)+(a13./T)).*R.*T;
      %entropy
      s=((a8.*log(T))+(a9.*T)+((a10.*T.^2)/2)+((a11.*T.^3)/3)+((a12.*T.^4)/4)+a14).*R;

   end
end
end
Explanation-
This function uses the high temperature coefficeints, low temperature coefficients, universal gas constant, global minimum, global medium and global maximum temperature values as the input parameters. Then we use the if else conditional statement to check if the temp values are less than or equal to the global medium temperature values and select the appropriate equations (defined for all the parameters to calculate) with high and low temperature coefficients is used to calculate the thermodynamic properties like specific heat(cp), enthalpy(h) and entropy(s).
3)Function code for Molecular Weight calculation-
function [MW]= mw(species_name)

weight=0;   % Declaring molecular weight is '0' in initial stage
elements=['H','C','N','O','A'];    % Declaring species elements
%Atomic weight of each elements
mass=[1.008,12.011,14.007,15.999,39.948];
for i=1:length(species_name)
    for j=1:length(elements)
        if strcmpi(species_name(i),elements(j))
            weight=weight+mass(j);
            y=j;
        end
    end
    number=str2double(species_name(i));
    if (number>1)
        weight=weight+(mass(y)*(number-1));
    end
    MW=weight;
end
end
Explanation-
A string array is created which contains the name of the atoms.
A variable atomic_weight is created which contains the atomic weight of respective atoms in the string array.
Then used strcmp command to compare the name of the element with the string array.
If there is repeatition of any element, str2num is used to find that and (number-1) is multiplied to atomic_weight of element to calculate molecular weight.
Out put:
The Screenshot of the command window showing molecular weight of elements -
Screenshot of the window where all the folders are saved -

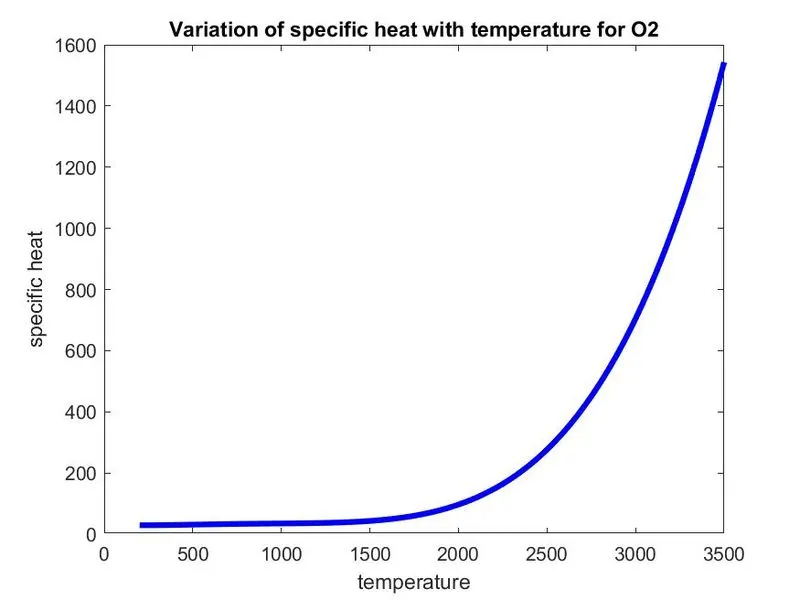
Plots for O2, N2, CO2 :
Plots for O2-
Plots for N2-
Plots for CO2-
Conclusion:
Hence, we conclude that using above MATLAB code. The require data extracted from NASA thermodynamics data file. Used this data for calculation of specific heat, enthalpy and entropy. also plot the graph for above properties vs local temperature. molecular weight was also calculated. New folder created for save all data.
Errors:
Some syntax errors and typing errors are occured. Corrected it well.