Project 1 - Parsing NASA thermodynamic data
CODE
Enthaly Funtion
%Enthalpy

function h = enthalpy(a1,a2,a3,a4,a5,a6,b1,b2,b3,b4,b5,b6,T,R,glob_temp_med)
%temperature condition
if T > glob_temp_med

  %High Temp coeff
     h = (a1+a2*T/2+a3*(T.^2)/3+a4*(T.^3)/3+a5*(T.^4)/3+a6./T)*R.*T;

else
    %low temp coeff
     h = (b1+b2*T/2+b3*(T.^2)/3+b4*(T.^3)/3+b5*(T.^4)/3+b6./T)*R.*T;
end
Specific Heat Funtion
%specific heat

function cp = specific_heat(a1,a2,a3,a4,a5,b1,b2,b3,b4,b5,T,R,glob_temp_med)

%Temperature Condition
if T > glob_temp_med

    %High Temp Coeff
     cp = (a1+a2*T+a3*T.^2+a4*T.^3+a5*T.^4)*R;

else
    %Low Temp Coeff
     cp = (b1+b2*T+b3*T.^2+b4*T.^3+b5*T.^4)*R;
end
Entropy Funtion
%Entropy

function s = entropy(a1,a2,a3,a4,a5,a7,b1,b2,b3,b4,b5,b7,T,R,glob_temp_med)
%temperaature condition
if T > glob_temp_med

     s = R*(a1*log(T) + a2*T/2+ a3*(T.^2)/3 + a4*(T.^3)/4 + a5*(T.^4)/5+ a7);

else
     s = R*(b1*log(T) + b2*T/2+ b3*(T.^2)/3 + b4*(T.^3)/4 + b5*(T.^4)/5+ b7);
end
Molecular Weight
%Molicular Weight

function w_m = molecular_weight(species)

%Definh elemtery aatoms in molecules
atom = ['H', 'C', 'N', 'O', 'A'];


%atomuc weight of each molecule in order
 atomic_weight =[1 12 14 16 40];
 w_m=0;
 for i = 1:length(species)

    for j = 1:length(atom)
        %Comparing String and assingnig molecular weight
       if strcmp(species(i), atom(j))
           w_m = w_m + atomic_weight(j);
           x = j;
       end
    end
    n = str2num(species(i));
    if n > 1
    w_m = w_m + atomic_weight(x)*(n-1);
    end
 end

 % Display result
 fprintf ('Atomic Weight of %s', species);
 fprintf(' is %s');
 fprintf('%d\n',w_m);
Main Code
clear all
close all
clc

%opeing given file
f1 = fopen('THERMO.dat','r');

%reading first line(Globel Temperature Values)
l0 = fgetl(f1);

%Spliting and Assinging Variables
glob_temp = fgetl(f1);

glob_temp = strsplit(glob_temp,' ');

%Save temperature
glob_temp_min = str2double(glob_temp{2});
glob_temp_med = str2double(glob_temp{3});
glob_temp_max = str2double(glob_temp{4});

%Directery Making
%mkdir('D:\Skill Lync\Challenges\Matlab\NASA');

for i = 1:3
    l0 = fgetl(f1);
end

%taking randem 500 temperature from globel temperature range
T = linspace(glob_temp_min, glob_temp_max, 500);
R = 8.314; %universal gas constant (J*mol^-1*K^-1)

%reading elements

for i = 1:53
   l1 = fgetl(f1);

   species = strsplit(l1,' ');    %extracting element
   species = species{1};

   for j = 1:3
      L{j} = fgetl(f1);
   end

   %finding the position of E in each string
    a = strfind(L{1},'E');

    %converting to scalar
    %High Temperature Coefficient

    a1 = L{1}(1:a(1)+3);                 %extracting high temperature coefficients
    a2 = L{1}(a(1)+4:a(2)+3);
    a3 = L{1}(a(2)+4:a(3)+3);
    a4 = L{1}(a(3)+4:a(4)+3);
    a5 = L{1}(a(4)+4:a(5)+3);
    a6 = L{2}(1:a(1)+3);
    a7 = L{2}(a(1)+4:a(2)+3);

    %Low Temperature Coefficient
    b1 = L{2}(a(2)+4:a(3)+3);            %extracting low temperature coefficients
    b2 = L{2}(a(3)+4:a(4)+3);
    b3 = L{2}(a(4)+4:a(5)+3);
    b4 = L{3}(1:a(1)+3);
    b5 = L{3}(a(1)+4:a(2)+3);
    b6 = L{3}(a(2)+4:a(3)+3);
    b7 = L{3}(a(3)+4:a(4)+3);

    %save temperature coeff
    a1 = str2double(a1);
    a2 = str2double(a2);
    a3 = str2double(a3);
    a4 = str2double(a4);
    a5 = str2double(a5);
    a6 = str2double(a6);
    a7 = str2double(a7);

    b1 = str2double(b1);
    b2 = str2double(b2);
    b3 = str2double(b3);
    b4 = str2double(b4);
    b5 = str2double(b5);
    b6 = str2double(b6);
    b7 = str2double(b7);

    %specific heat calculation
       cp = specific_heat(a1,a2,a3,a4,a5,b1,b2,b3,b4,b5,T,R,glob_temp_med);

    %Enthalpy CAlculation

    h = enthalpy(a1,a2,a3,a4,a5,a6,b1,b2,b3,b4,b5,b6,T,R,glob_temp_med);

    %Entropy Calculation
    s = entropy(a1,a2,a3,a4,a5,a7,b1,b2,b3,b4,b5,b7,T,R,glob_temp_med);

    %Molicular weight calculation(experiment 4)

    w_m = molecular_weight(species);


   %saving species data in folder wise
    cur_dir = pwd;
    mkdir(species);
    cd(species);

    %saving data
    f2 = fopen('Element Info.txt', 'w');
    fprintf(f2,'Molecular weight of %s is %d \n',species ,w_m);
    fclose(f2);
  %Graph T vs cp, Save in species folder
    figure(1)
    plot(T,cp,'color',[0 1 1], 'linewidth',2);
    xlabel('Temperature [K]'); ylabel('Specific Heat [kJ]');
    title(sprintf('Temperature vs Specific Heat %s', species));
    grid on;
    saveas(figure(1), 'T vs cp.jpg');
    %Graph T vs s, Save in species folder
   figure(2)
   plot(T,s,'linewidth',2,'color',[1 0 1]);
   xlabel('Tempearture [K]'); ylabel('Entropy [kJ/mol]');
   title(sprintf('Temperature vs Entopy %s', species));
   grid on;
   saveas(figure(2),'T vs s.jpg');

   %Graph T vs H, Save in species folder
   figure (3)
   plot(T,h,'color',[1 0.5 0], 'linewidth', 2);
   xlabel('Tempearture [K]'); ylabel('Entropy [kJ/mol]');
   title(sprintf('Temperature vs Enthalpy %s', species));
   grid on;
   saveas(figure(3),'T vs E.jpg')
   %keep at current directry
   cd(cur_dir);
end
fclose(f1);
Explanation
Enthalpy Function
Defining function ‘h = enthalpy’, for calling out in main code.
%Enthalpy
function h = enthalpy(a1,a2,a3,a4,a5,a6,b1,b2,b3,b4,b5,b6,T,R,glob_temp_med)
Using if condition to define temperature range to read the coefficient correctly.
%temperature condition
if T > glob_temp_med
Defining the expression for ‘h’(enthalpy) when the temperature is high (from global medium temperature to global high temperature)
%High Temp coeff
h = (a1+a2*T/2+a3*(T.^2)/3+a4*(T.^3)/3+a5*(T.^4)/3+a6./T)*R.*T;
else
Defining the expression for ‘s’ when the temperature is low (from low global temperature to global medium temperature)
%low temp coeff
h = (b1+b2*T/2+b3*(T.^2)/3+b4*(T.^3)/3+b5*(T.^4)/3+b6./T)*R.*T;
end
Entropy Function
Defining function ‘s = entropy’ , for calling out in main code.
%Entropy
function s = entropy(a1,a2,a3,a4,a5,a7,b1,b2,b3,b4,b5,b7,T,R,glob_temp_med)
%temperaature condition
Using if condition to define temperature range to read the coefficient correctly
if T > glob_temp_med
Defining the expression for ‘s’ when the temperature is high (from global medium temperature to global high temperature)
s = R*(a1*log(T) + a2*T/2+ a3*(T.^2)/3 + a4*(T.^3)/4 + a5*(T.^4)/5+ a7);
else
Defining the expression for ‘s’ when the temperature is low (from low global temperature to global medium temperature) =.
s = R*(b1*log(T) + b2*T/2+ b3*(T.^2)/3 + b4*(T.^3)/4 + b5*(T.^4)/5+ b7);
end
Specific Heat Function
Defining function ‘cp=Specific heat’, for calling out in main code.
%specific heat
function cp = specific_heat(a1,a2,a3,a4,a5,b1,b2,b3,b4,b5,T,R,glob_temp_med)
Using if condition to define temperature range to read the coefficient correctly
%Temperature Condition
if T > glob_temp_med
Defining the expression for ‘cp’ when the temperature is high (from global medium temperature to global high temperature).
%High Temp Coeff
cp = (a1+a2*T+a3*T.^2+a4*T.^3+a5*T.^4)*R;
Defining the expression for ‘cp’ when the temperature is low (from low global temperature to global medium temperature).
else
%Low Temp Coeff
cp = (b1+b2*T+b3*T.^2+b4*T.^3+b5*T.^4)*R;
end
Molecular Weight Function
Defining function ‘w_m = Molecular Weight’, for calling out in the main function.
%Molicular Weight
function w_m = molecular_weight(species)
%Definh elemtery atoms in molecules
Defining elementary atoms present in all the elements in an array. (H = Hydrogen, C = Carbon, N = Nitrogen, O = Oxygen, A = Argon).
atom = ['H', 'C', 'N', 'O', 'A'];
Defining the approximate atomic weight of each atom respectively.
%atomuc weight of each molecule in order
atomic_weight =[1 12 14 16 40];
Initial Condition, molecular weight is zero.
w_m=0;
‘for’ loop is used to calculate all the molecules present individually.
for i = 1:length(species)
‘for’ loop is defined to the length of atoms array
for j = 1:length(atom)
comparing strings from molecules defined in given data(in a cell) and the atoms (in array).
%Comparing String and assingnig molecular weight
if strcmp(species(i), atom(j))
Expression to calculate the atomic weight of the molecule.
w_m = w_m + atomic_weight(j);
defining the position of an atom in an array.
x = j;
end
end
String to number convertion.
n = str2num(species(i));
‘if’ condition is used. If the variable ‘n’ that is converted from the ‘species’ cell is a positive number that is greater than one (greater than zero also works here), then the atomic weight of the atom is determined by its position from the ‘atom’ array is multiplied by ‘n-1’. Where ‘n’ actually represents the total number of similar atoms present in the molecule while coming out from the second ‘for’ loop.
if n > 1
w_m = w_m + atomic_weight(x)*(n-1);
end
end
Display the result in a command window using the ‘fprintf’ command (%s represents it is a string and %d represents its (double) number).
% Display result
fprintf ('Atomic Weight of %s', species);
fprintf(' is %s');
fprintf('%d\n',w_m);
Main Code
Opening and reading(’r’) the given data file (THERMO.dat) using ‘fopen’ command.
clear all
close all
clc
%opeing given file
f1 = fopen('THERMO.dat','r');
Use ‘fgetl’ command to read the first line from the file ‘THERMO.dat’.
%reading first line(Globel Temperature Values)
l0 = fgetl(f1);
Since the first line contains information about the global temperature range it is stored in a variable ‘glob_temp’
%Spliting and Assinging Variables
glob_temp = fgetl(f1);
‘strsplit’ is used to separate the temperature variable limit by determining the position of ‘ ’(Space).
glob_temp = strsplit(glob_temp,' ');
The separate variable is converted to a number and stored individually in different variables.
%Save temperature
glob_temp_min = str2double(glob_temp{2});
glob_temp_med = str2double(glob_temp{3});
glob_temp_max = str2double(glob_temp{4});
Using For loop to read the next tree line, which is not valuable information for further usage.
for i = 1:3
l0 = fgetl(f1);
end
Using ‘linspace’ command to randomly draw 500 temperatures with in the global temperature range.
Defining the variable ‘R’ (Universal Gas constant).
%taking randem 500 temperature from globel temperature range
T = linspace(glob_temp_min, glob_temp_max, 500);
R = 8.314; %universal gas constant (J*mol^-1*K^-1)
Reading all the variables and the elements and coefficients using ‘for’ loop and
%reading elements
Rearing the 53 elements using ‘fgetl’ command inside ‘for’ loop.
for i = 1:53
l1 = fgetl(f1);
Saving each elements in ‘species’(cell).
species = strsplit(l1,' '); %extracting element
species = species{1};
Reading and saving all the coefficient of temperature in loop
for j = 1:3
L{j} = fgetl(f1);
end
Reading each temperature confident in a line using the position of the letter ‘E’.
%finding the position of E in each string
a = strfind(L{1},'E');
%converting to scalar
Saving each coefficient in a line in to a different cell.
%High Temperature Coefficient
a1 = L{1}(1:a(1)+3); %extracting high temperature coefficients
a2 = L{1}(a(1)+4:a(2)+3);
a3 = L{1}(a(2)+4:a(3)+3);
a4 = L{1}(a(3)+4:a(4)+3);
a5 = L{1}(a(4)+4:a(5)+3);
a6 = L{2}(1:a(1)+3);
a7 = L{2}(a(1)+4:a(2)+3);
%Low Temperature Coefficient
b1 = L{2}(a(2)+4:a(3)+3); %extracting low temperature coefficients
b2 = L{2}(a(3)+4:a(4)+3);
b3 = L{2}(a(4)+4:a(5)+3);
b4 = L{3}(1:a(1)+3);
b5 = L{3}(a(1)+4:a(2)+3);
b6 = L{3}(a(2)+4:a(3)+3);
b7 = L{3}(a(3)+4:a(4)+3);
Converting cell(string) to a scalar variable using ‘str2double’ command (‘str2num’ is also can be used).
%save temperature coeff
a1 = str2double(a1);
a2 = str2double(a2);
a3 = str2double(a3);
a4 = str2double(a4);
a5 = str2double(a5);
a6 = str2double(a6);
a7 = str2double(a7);
b1 = str2double(b1);
b2 = str2double(b2);
b3 = str2double(b3);
b4 = str2double(b4);
b5 = str2double(b5);
b6 = str2double(b6);
b7 = str2double(b7);
Calling out the function for specific heat with defined inputs.
%specific heat calculation
cp = specific_heat(a1,a2,a3,a4,a5,b1,b2,b3,b4,b5,T,R,glob_temp_med);
calling out the function enthalpy with properly defined inputs
%Enthalpy CAlculation
h = enthalpy(a1,a2,a3,a4,a5,a6,b1,b2,b3,b4,b5,b6,T,R,glob_temp_med);
calling out the function ‘entropy’ with defined inputs.
%Entropy Calculation
s = entropy(a1,a2,a3,a4,a5,a7,b1,b2,b3,b4,b5,b7,T,R,glob_temp_med);
%Molicular weight calculation(experiment 4)
Calling out the function molecular weight with defined inputs.
w_m = molecular_weight(species);
Saving each element in a folder in the current directory.
%saving species data in folder wise in current directory
cur_dir = pwd;
mkdir(species);
cd(species);
Saving the molecular weight details in ‘.txt’ format in their corresponding directory.
%saving data
f2 = fopen('Element Info.txt', 'w');
fprintf(f2,'Molecular weight of %s is %d \n',species ,w_m);
fclose(f2);
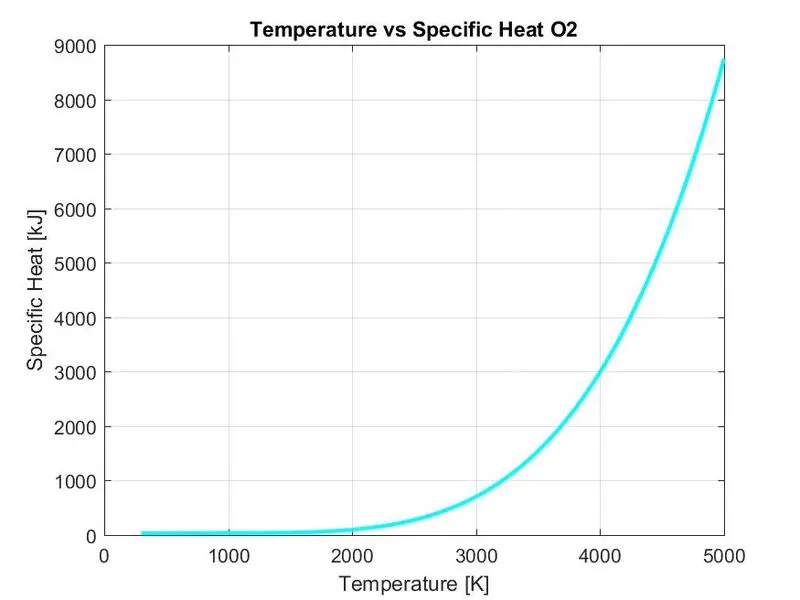
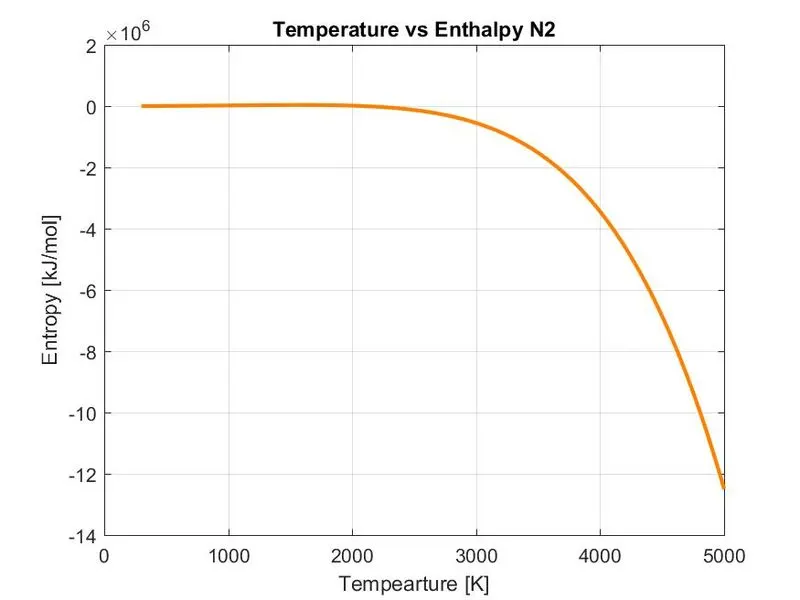
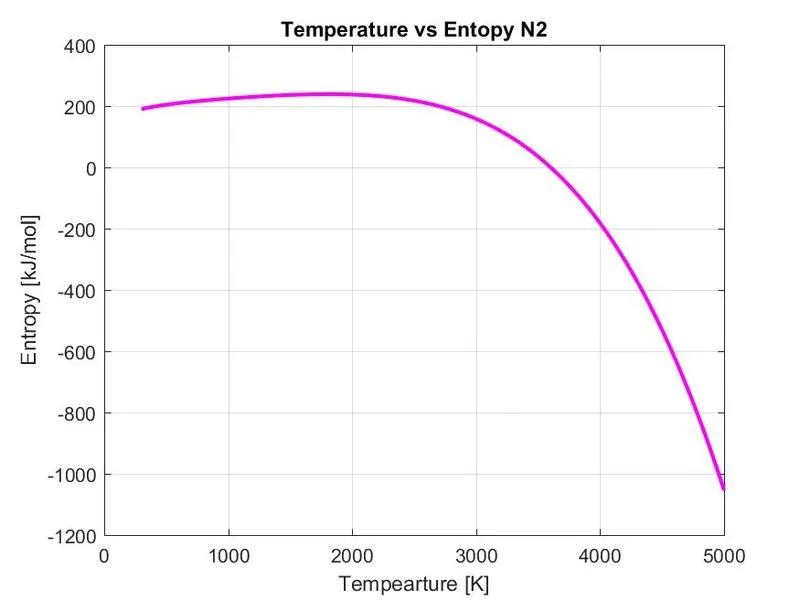
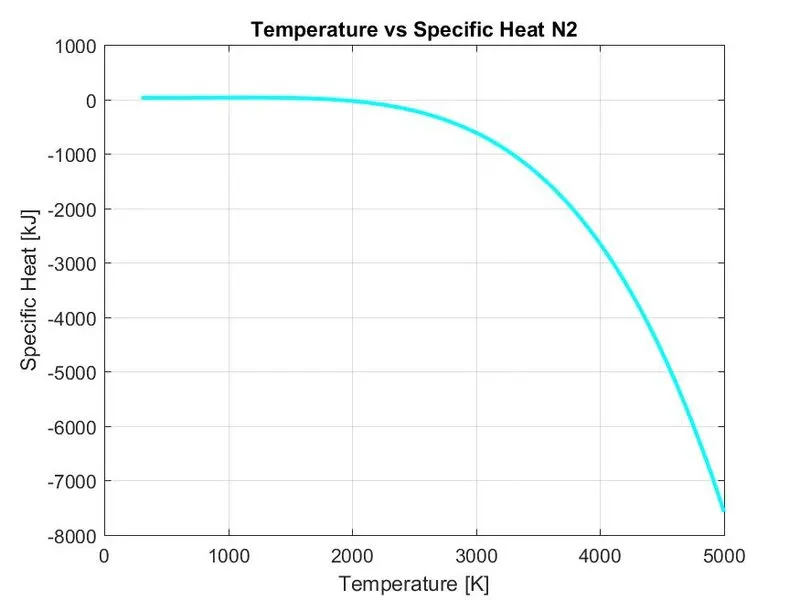
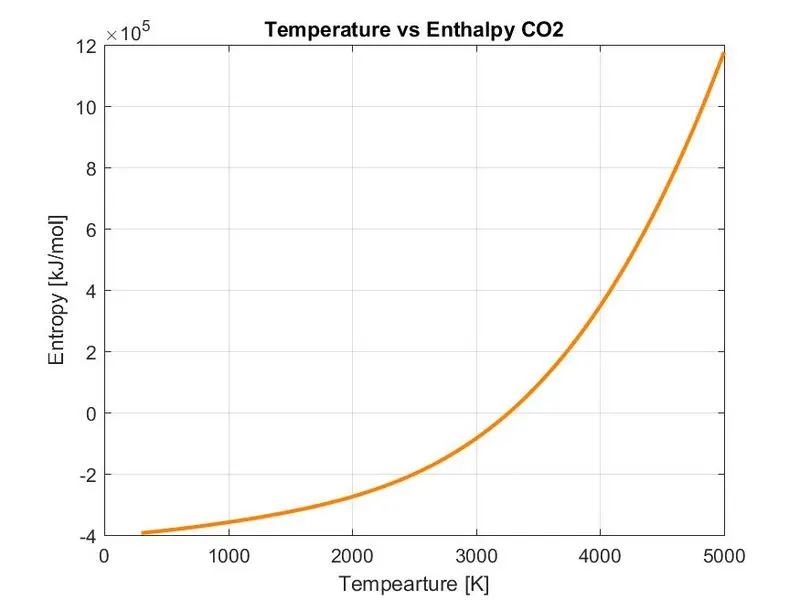
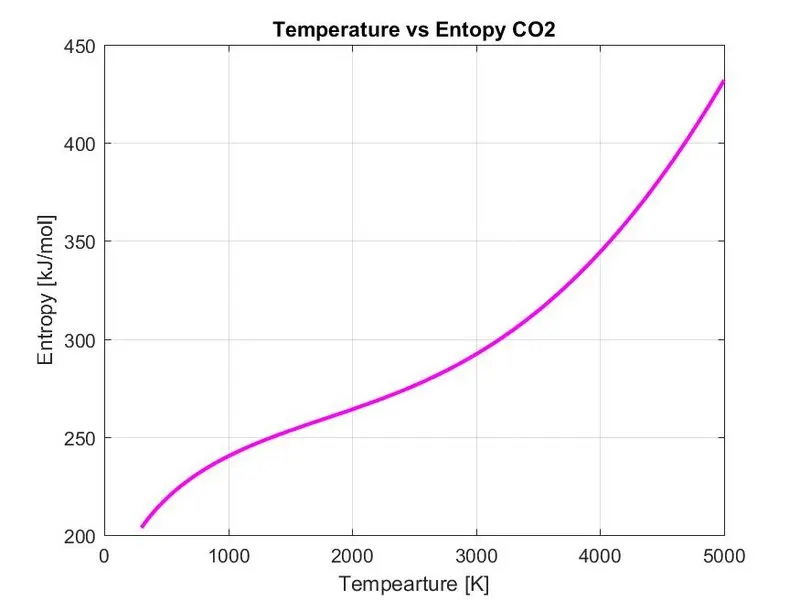
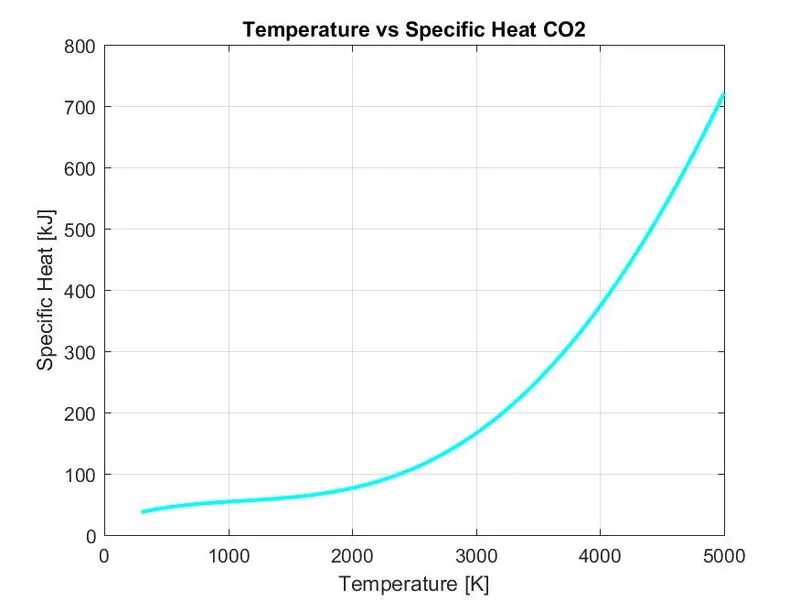
Plotting graph and saving each graph inside corresponding folder. ‘plot’ command is used to plot the corresponding graph and ‘xlabel’ and ‘ylabel’ is used to label the X and Y axis respectively. ‘saveas’ command is used to save the plot in corresponding directory. The plots are saved in ‘.jpg’ format
%Graph T vs cp, Save in species folder
figure(1)
plot(T,cp,'color',[0 1 1], 'linewidth',2);
xlabel('Temperature [K]'); ylabel('Specific Heat [kJ]');
title(sprintf('Temperature vs Specific Heat %s', species));
grid on;
saveas(figure(1), 'T vs cp.jpg');
%Graph T vs s, Save in species folder
figure(2)
plot(T,s,'linewidth',2,'color',[1 0 1]);
xlabel('Tempearture [K]'); ylabel('Entropy [kJ/mol]');
title(sprintf('Temperature vs Entopy %s', species));
grid on;
saveas(figure(2),'T vs s.jpg');
%Graph T vs H, Save in species folder
figure (3)
plot(T,h,'color',[1 0.5 0], 'linewidth', 2);
xlabel('Tempearture [K]'); ylabel('Entropy [kJ/mol]');
title(sprintf('Temperature vs Enthalpy %s', species));
grid on;
saveas(figure(3),'T vs E.jpg')
%keep at current directry
cd(cur_dir);
end
closing the ‘THERMO.dat’ file.
fclose(f1);
Result
Molecular Weight
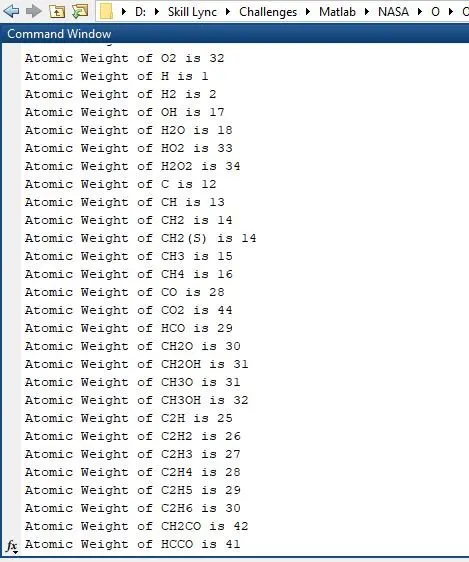
Screenshot of the window.

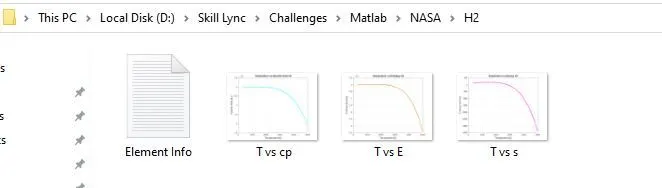
Plots
O2 – Temperature vs Enthalpy, Entropy and Specific Heat
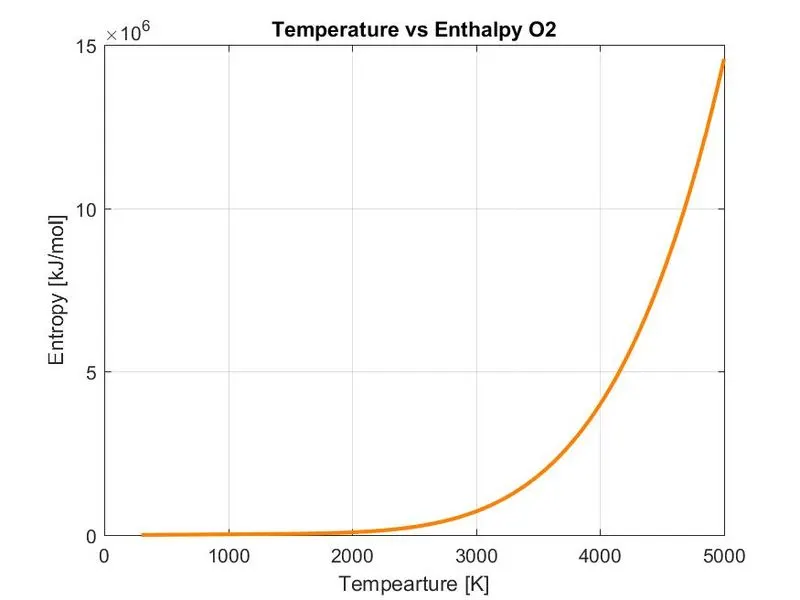
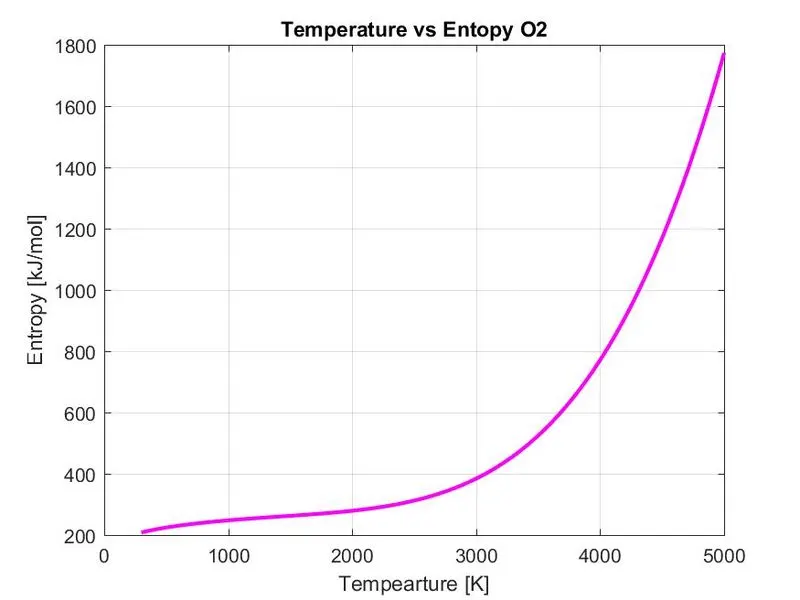
N2 – Temperature vs Enthalpy, Entropy, and Specific Heat.
CO2 – Temperature vs Enthalpy, Entropy and Specific Heat
Error
1) Error in defin9ng title.
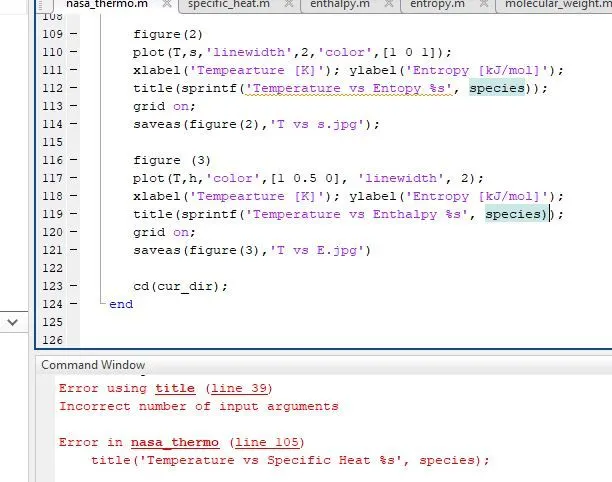
Solution: The command ‘sprintf’ is used to define the title with variable ‘species’.
2) Invalid color definintion.
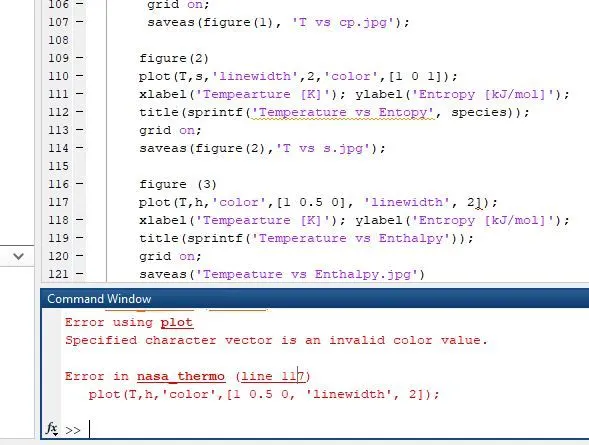
Solution: The square bracket was not closed properly.
3) Infinit loop problem.
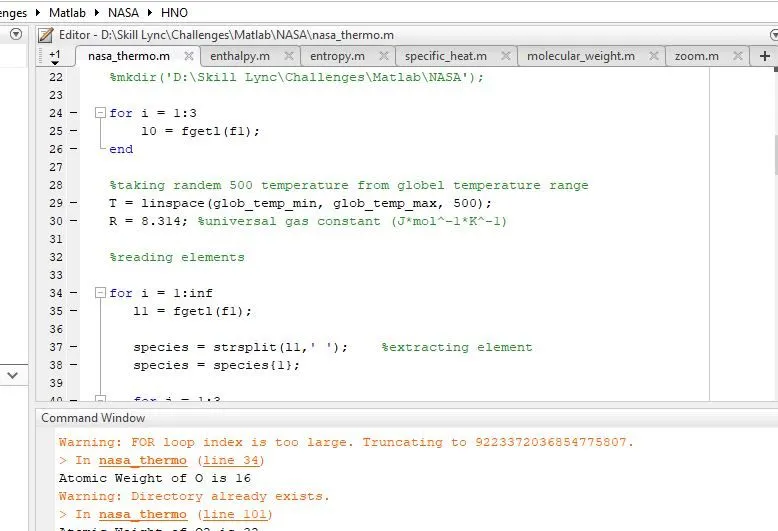
Solution: Cout the total number of elements and replaced with 'inf' command.
4) Other errors
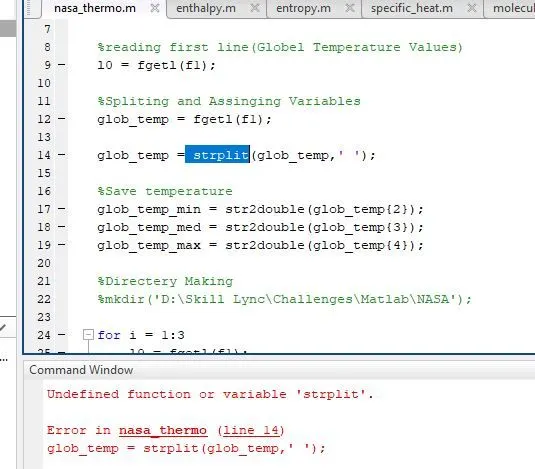
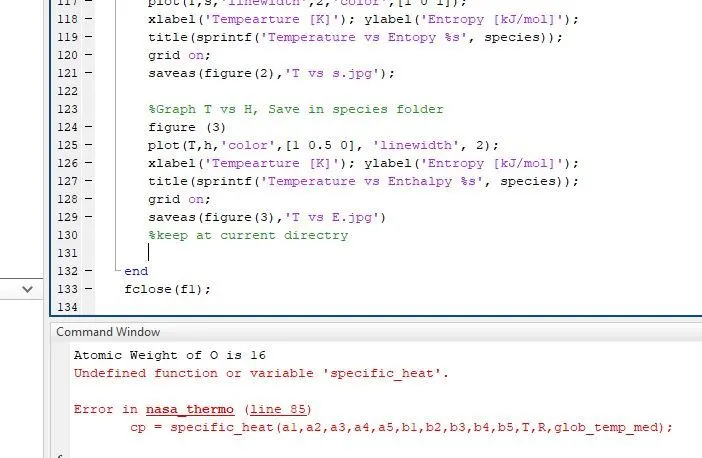
Solution: Most of the errors were due to improper definition of command or variable(around 8 errors), which are fixed by properly defining and spelling. Some errors are due to directory change or path change of saved functions, which are redirected.
Reference:
1) https://www.mathworks.com/matlabcentral/answers/65697-save-in-a-folder?s_tid=prof_contriblnk
2) https://in.mathworks.com/help/matlab/ref/addpath.html
3) https://in.mathworks.com/matlabcentral/answers/331241-saving-as-of-a-figure-with-current-folder-name
4) https://in.mathworks.com/matlabcentral/answers/65697-save-in-a-folder
5) https://www.youtube.com/watch?v=5IGe9t5Y4Ig
6) https://www.youtube.com/watch?v=z1SmcrQIORU
7) https://www.youtube.com/watch?v=T_ekAD7U-wU
8) https://www.youtube.com/watch?v=t0oNbYJn2Mw