Project 1 - Parsing NASA thermodynamic data
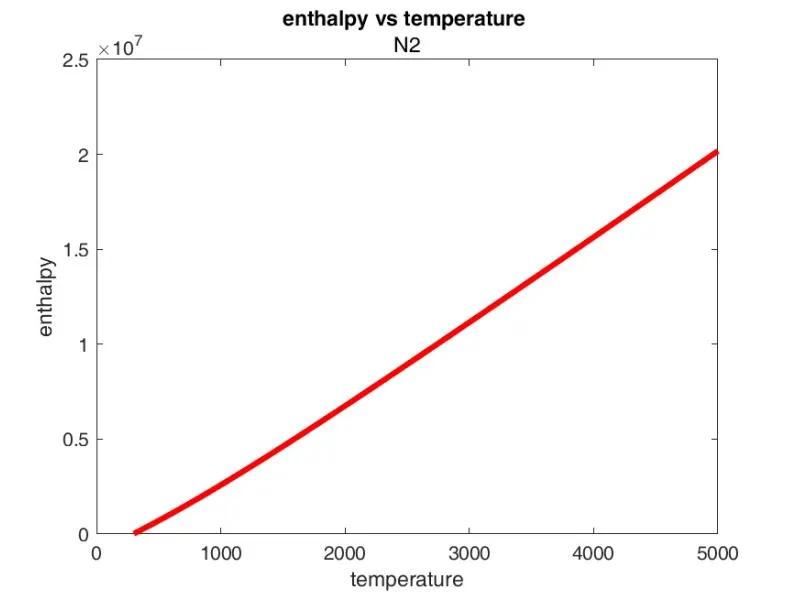
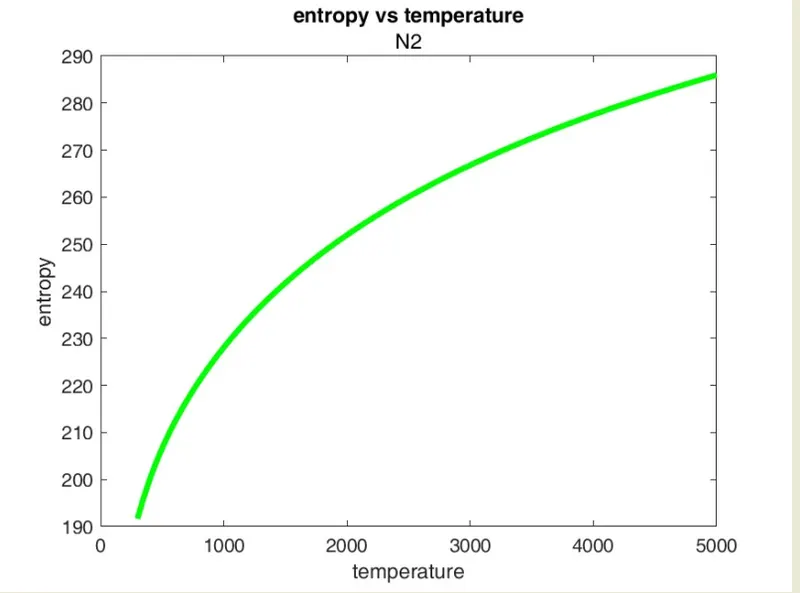
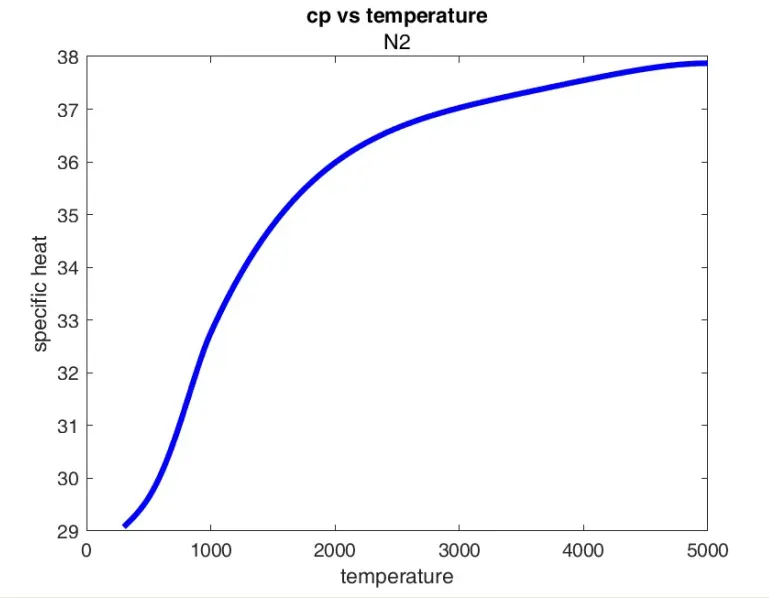
Aim : write a code in matlab to read NASA thermodynamic data and calculate the specific heat, entropy and enthalpy of the various gas species and plotting the graph of enthalpy,entropy and Cp vs temperature graph .
Theory:
specific heat: it is the quantity of heat required to raise the temperature of one gram of a substance by one Celsius degree. The units of specific heat are usually calories or joules per gram per Celsius degree.
Enthalpy: enthalpy is a property of a thermodynamic system, is the sum of the system's internal energy and the product of its pressure and volume.
Entropy: Entropy associated with a state of disorder, randomness, or uncertainty. Entropy is the measure of a system’s thermal energy per unit temperature that is unavailable for doing useful work. Because work is obtained from ordered molecular motion, the amount of entropy is also a measure of the molecular disorder, or randomness, of a system.
Objective:
- A thermodynamic data file of NASA consisting of coefficients for polynomials that can be used to evaluate thermodynamic properties such as Cp, H and S is given.
- Data consist of coefficients for 53 different gas molecules
- 14 coefficients of respective gas species are to be extracted from the file
- Using this data Cp ,H and S of various gas species are to be calculated
- graph of CP,H, and S vs temperature is to be plotted
Equation:
Specific heat:
high temperature ( temperature above mid temperature):
`Cp = (a1 + a2*t+ a3*(t^2) + a4*(t^3) + a5*(t^4))*R`
low temperature ( temperature below mid temperature):
`Cp = (a8 + a9*t+ a10*(t^2) + a11*(t^3) + a12*(t^4))*R`
Entropy:
high temperature:
`E = (a8*ln(t) + a9*t+ a10*(t^2)/2 + a11*(t^3)/3 + a12*(t^4)/4 +a14)*R`
low temperature:
`E = (a1*ln(t) + a2*t+ a3*(t^2)/2 + a4*(t^3)/3 + a5*(t^4)/4 + a7)*R`
Enthalpy:
high temperature:
`H = (a8 + a9*t/2+ a10*(t^2)/3 + a11*(t^3)/4 + a12*(t^4)/5+a13/t)*R*t`
low temperature:
`H = (a1 + a2*t/2+ a3*(t^2)/3 + a4*(t^3)/4 + a5*(t^4)/5 +a6/t)*R*t`
CODE:
function code:
1) enthalpy calculation:
function H = enthalpy_fn(a,temperature,mid_temperature,R)


for i = 1: length(temperature)
% enthalpy calculation
if (temperature(i) <= mid_temperature)   % when low temperature(i)
    % enthalpy = (a8 + a9*t/2+ a10*(t^2)/3 + a11*(t^3)/4 + a12*(t^4)/5+a13/t)*R*t

    H(i) = R*temperature(i)*(a(8) + a(9)*(temperature(i))/2 + a(10)*(temperature(i)^2)/3 + a(11)*(temperature(i)^3)/4 +a(12)*(temperature(i)^4)/5 + a(13)/temperature(i));


else     % high temperature(i)
     % enthalpy = (a1 + a2*t/2+ a3*(t^2)/3 + a4*(t^3)/4 + a5*(t^4)/5 +a6/t)*R*t

    H(i) = R*temperature(i)*(a(1) + ((a(2)*temperature(i))/2) + ((a(3)*(temperature(i)^2))/3) + ((a(4)*(temperature(i)^3))/4) + ((a(5)*(temperature(i)^4))/5) + (a(6)/temperature(i)));

end
end
end
explanation:
- The function requires 4 arguments.
- input arguments are a,temperature , mid temperature and R
- a is an array consisting of 14 coefficients of respective gas molecule
- temperature is an array constisting of 1000 different temperatures from low temperature to high temperature obtained from data
- mid temperature is the also obtained from data
- R is universal gas coefficient
- we use if loop for enthalpy calculation for low temperature and high temperature
entropy function:
function S = entropy_fn(coef,temperature,mid_temperature,R)

a = coef;

for i = 1: length(temperature)
% specific heat calculation
if temperature(i) > mid_temperature   % high temperature(i)

    % entropy = (a1*ln(t) + a2*t+ a3*(t^2)/2 + a4*(t^3)/3 + a5*(t^4)/4 + a7)*R

    S(i) = (a(1).*log(temperature(i)) + a(2).*temperature(i) + a(3).*(temperature(i).^2)/2 + a(4).*(temperature(i).^3)/3 +a(5).*(temperature(i).^4)/4 + a(7) )*R;

else    % when low temperature(i)

     % entropy = (a8*ln(t) + a9*t+ a10*(t^2)/2 + a11*(t^3)/3 + a12*(t^4)/4 +a14)*R

    S(i) = (a(8).*log(temperature(i)) + a(9).*temperature(i) + a(10).*(temperature(i).^2)/2 + a(11).*(temperature(i).^3)/3 +a(12).*(temperature(i).^4)/4 + a(14) )*R;
end
end
end
Explanation:
- Input arguments are similar to enthalpy function
- similarly entropy for high temperature and low temperature is calculated using if conditioning
- a1,a2,a3,a4,a5,a6,a7 are coefficient for low temperature condition
- a8,a9,a10,a11,a12,a13,a14 are coefficient for high temperature condition
specific heat function:
function Cp = specific_heat_fn(coef,temperature,mid_temperature,R)
a = coef;
for i = 1: length(temperature)

% specific heat calculation
if temperature(i) > mid_temperature   % high temperature(i)

    % specific heat = (a1 + a2*t+ a3*(t^2) + a4*(t^3) + a5*(t^4))*R

    Cp(i) = (a(1) + a(2)*temperature(i) + a(3)*(temperature(i)^2) + a(4)*(temperature(i)^3) +a(5)*(temperature(i)^4) )*R;

else     % when low temperature(i)

     % specific heat = (a8 + a9*t+ a10*(t^2) + a11*(t^3) + a12*(t^4))*R

    Cp(i) = (a(8) + a(9)*temperature(i) + a(10)*(temperature(i)^2) + a(11)*(temperature(i)^3) +a(12)*(temperature(i)^4) )*R;
end
end
end
explanation:
- input arguments are similar to above cases
- specific heat for respective gas species are calculated for low temperature and high temperature conditions
Molecular weight function:
function mol_wt = molecular_wt_fn(species,atm_wt,elements)

for i = 1:length(species)
    for j = 1:length(elements)
         n = str2num(species(i));
        if strcmp(species(i),elements(j))
            atom_wt(i) = atm_wt(j);

            elseif ( n > 1)

            atom_wt(i) =  (n-1)*atom_wt(i-1);

        end
    end
end
mol_wt = sum(atom_wt);
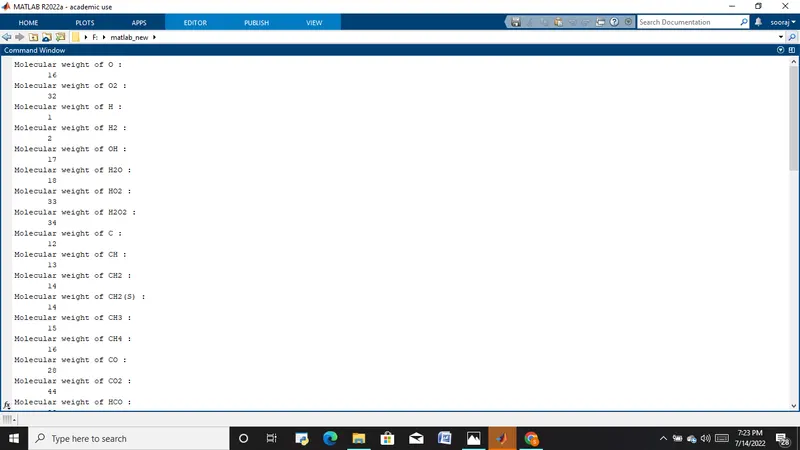
fprintf('Molecular weight of %s : \n       %d \n', species, mol_wt);
disp('')
end
explanation:
- input arguments are species ,atm_wt and elements
- species is the molecule for which weight is calculated
- atm_wt is the array consisting of atomic weight for elements O,C,H,N and Ar
- element is an array consisting of the string of elements O,C,H,N and Ar
- here 2 for loop is used . then strcmp is used to check whether species(i) and elements(j) are same. If same the if condition is true and atom_ wt at position i is given value atm_wt(j)
- elseif is also used . the condition is that n is greater than 1 . the str2num is used to convert string to number .
- then sum of atom_wt array is taken to calculate molecular weight.
Main code:
clear
close all
clc


elements = {'O','H','C','N','A'};
atomic_wt = [16,1,12,14,39];

% reading the NASA data file
f1 = fopen('THERMO.dat','r');

% skipping the header
fgetl(f1);

% reading the global temperature ranges from 1st line
A = fgetl(f1);
A = strsplit(A,' ');
global_low_temperature = str2double(A{2});
global_mid_temperature = str2double(A{3});
global_high_temperature = str2double(A{4});
R = 8.314; % universal gas constant


% to ignore next 3 header lines
for i = 1:3
    fgetl(f1);
end


% creating a for loop to read datas of each species

for j = 1:53

% reading the first line to get species name and temperature ranges
B = fgetl(f1);
C = strsplit(B,' ');
species = char(C{1});


% local temperature ranges
low_temperature = str2double(C{end-3});
mid_temperature = str2double(C{end-1});
high_temperature = str2double(C{end-2});

temperature = linspace(low_temperature,high_temperature,1000);

n = 1;
% reading the next 3 lines to obtain 14 coefficients
for k = 1:3
    line = fgetl(f1);
    loc = strfind(line, 'E');


    l1 = loc(1)+3;
    l2 = loc(2)+3;
    l3 = loc(3)+3;
    l4 = loc(4)+3;


    % a is an array consisting of 14 coeffiecients values of each species
    %a1,a2,a3,a4,a5,a6,a7,a8,a9,a10,a11,a12,a13,a14
    % teking the coefficient values from the respective line

    b = line(1:l1);
    a(n) = str2double(b);
    b = line(l1+1:l2);
    a(n+1) = str2double(b);
    b = line(l2+1:l3);
    a(n+2) = str2double(b);
    b = line(l3+1:l4);
    a(n+3) = str2double(b);
    if  (k ~= 3)

    l5 = loc(5)+3;
    b = line(l4+1:l5);
    a(n+4) = str2double(b);
    n = n+5;
    end

end


% enthalpy of the species
enthalpy = enthalpy_fn(a,temperature,R,mid_temperature);
%entropy of species
entropy = entropy_fn(a,temperature,mid_temperature,R);
% specific heat of species
Cp = specific_heat_fn(a,temperature,mid_temperature,R);


% plot of entropy, enthalpy and specific heat vs temperature
% saving as a folder


 % to open the directory


figure(1)
% plot of enthalpy vs temperature
plot(temperature,enthalpy,'linewidth',3,'color','r')
xlabel('temperature')
ylabel('enthalpy')
title('enthalpy vs temperature ',species)
figure(2)
% plot of entropy vs temperature
plot(temperature,entropy,'linewidth',3,'Color','g')
xlabel('temperature')
ylabel('entropy')
title('entropy vs temperature',species)

figure(3)
%plot of specific heat vs temperature
plot(temperature,Cp,'linewidth',3,'color','b')
xlabel('temperature')
ylabel('specific heat')
title('cp vs temperature',species)


cur_dir = pwd;
mkdir(species) ;% to make a new directory
cd(species);
% saving the image in directory
saveas(figure(1),'enthalpy vs temperature.jpg');
saveas(figure(2),'Entropy vs temperature.jpg');
saveas(figure(3),'specific_heat vs temperature.jpg');
cd(cur_dir)


% calculating the molecular weight of each species and saving the values in
% text file
molecular_weight = molecular_wt_fn(species,atomic_wt,elements);
f2 = fopen('molecular weight.txt','w');
fprintf(f2,'Molecular weight of %s : \n       %d \n', species,molecular_weight);
fclose(f2);
end

fclose(f1);
explanation:
- fopen('THERMO.dat' , 'r') code is used to open the file THERMO.dat for reading
- tline = fgetl(obj)reads one line of text from the instrument connected to obj , and returns the data to tline . running this command again reads the next line
- starting from sixth line contains useful data . the data contains 53 molecular datas .
- strsplit(tline, pattern) is used to split the string based on a particular pattern . pattern- to split the string at a particular pattern
- to parse 14 coefficients for the respective molecules 2 for loop are used . the coefficient is saved is an array named 'a' .
- An array named temperature containing 1000 different temperatures between the low temperature and high temperature for respective gas molecule is made
- then enthalpy,entropy and specific heat is calculated using respective function
- plot of specific heat , entropy and enthalpy vs temperature is made.
- this plot is saved in folder using mkdir() ,cd and saveas command
- mkdir - to create a folder
- cd- to open the folder
- then molecular weight of the molecule is calculated
- the fclose is used to close the THERMO.dat
plot:
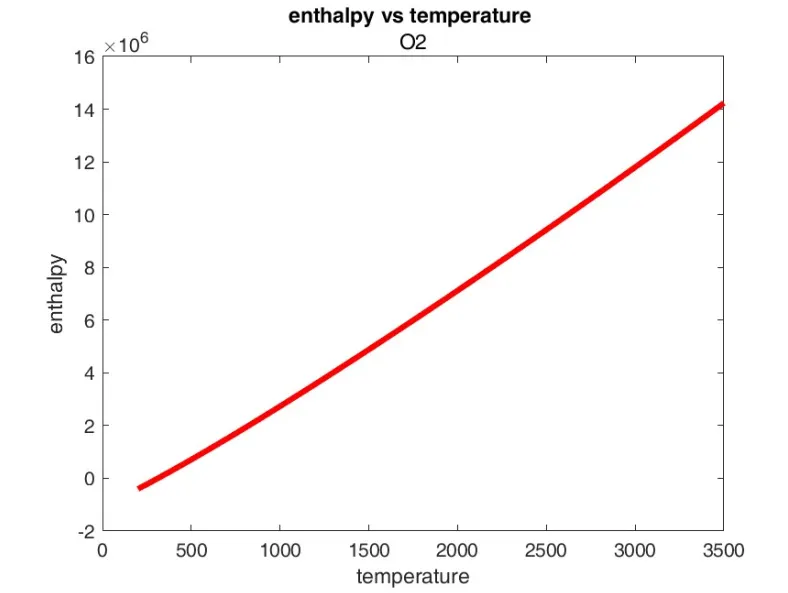
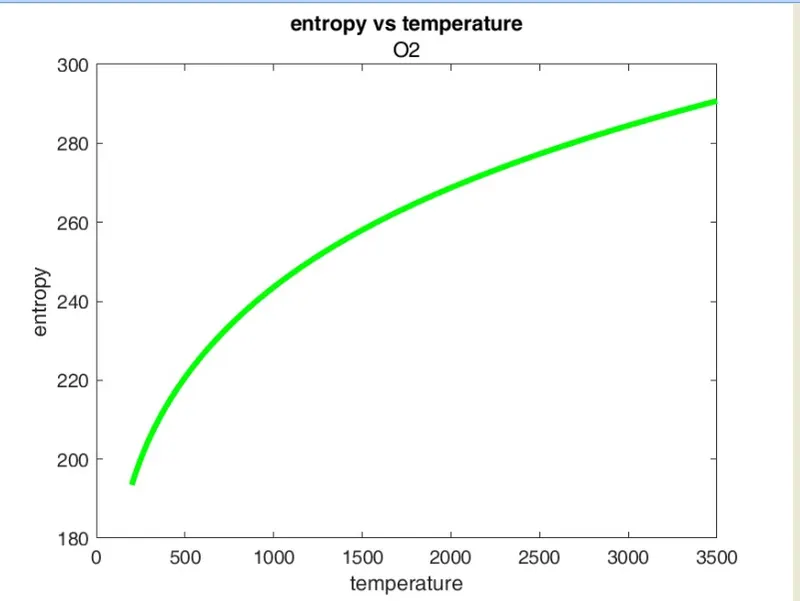
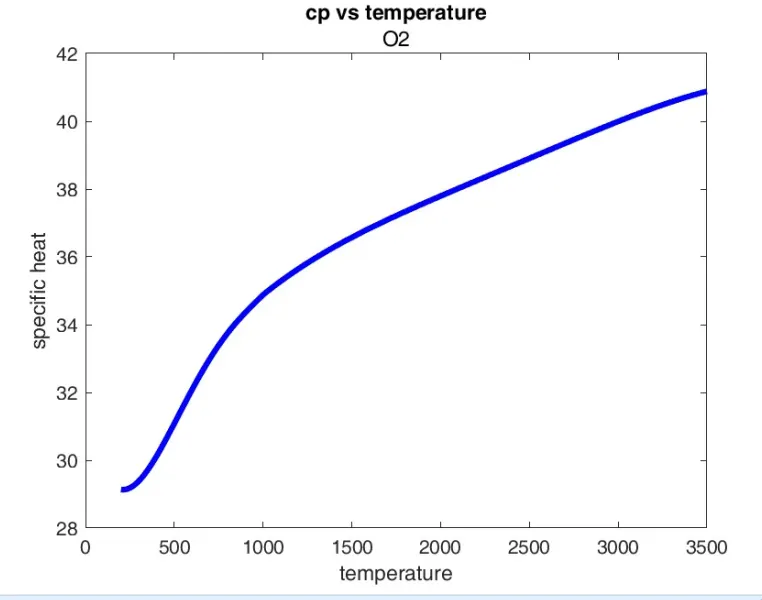
Enthalpy , Entropy and specific heat vs temperature of O2
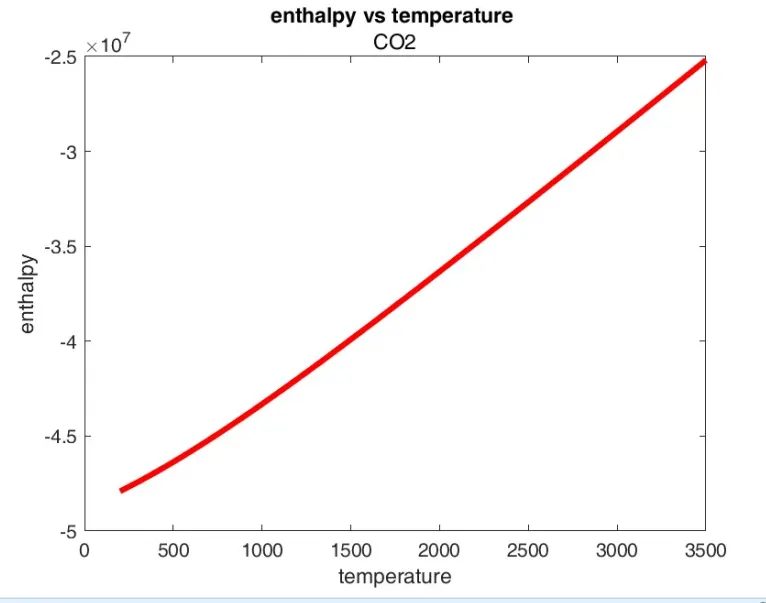
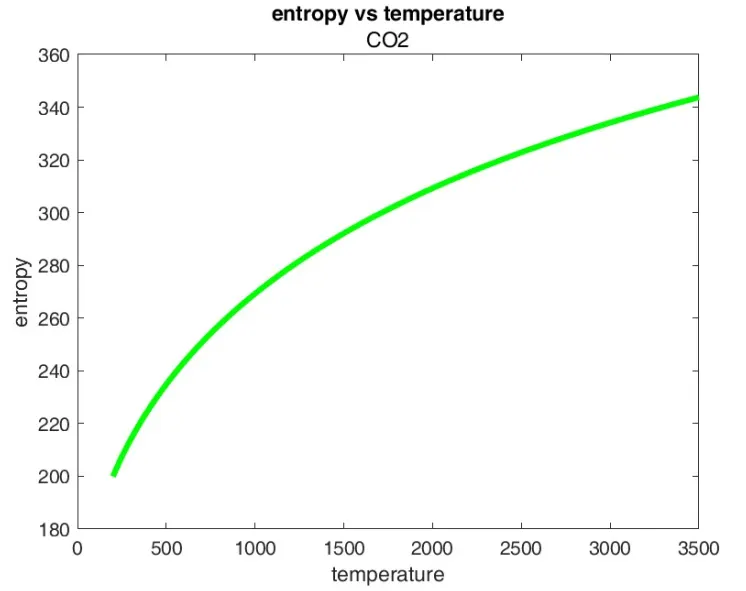
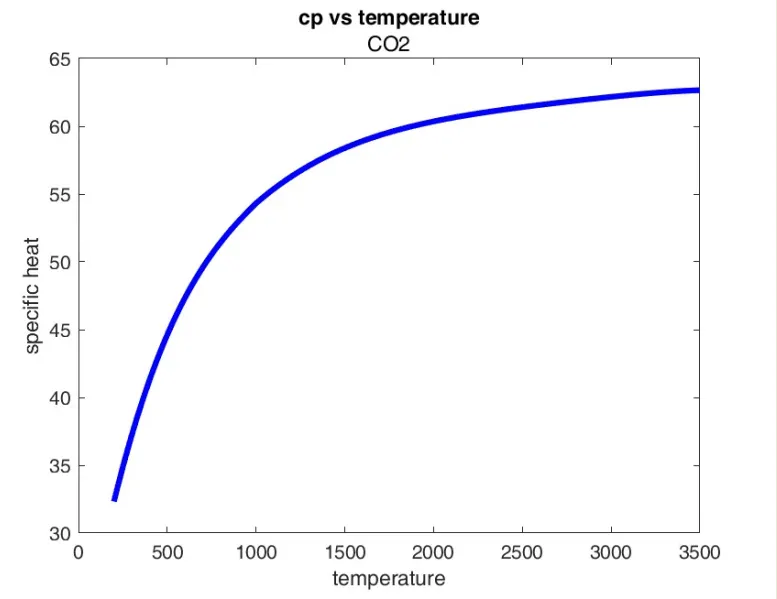
Enthalpy , Entropy and specific heat vs temperature of CO2:
Enthalpy , Entropy and specific heat vs temperature of N2:
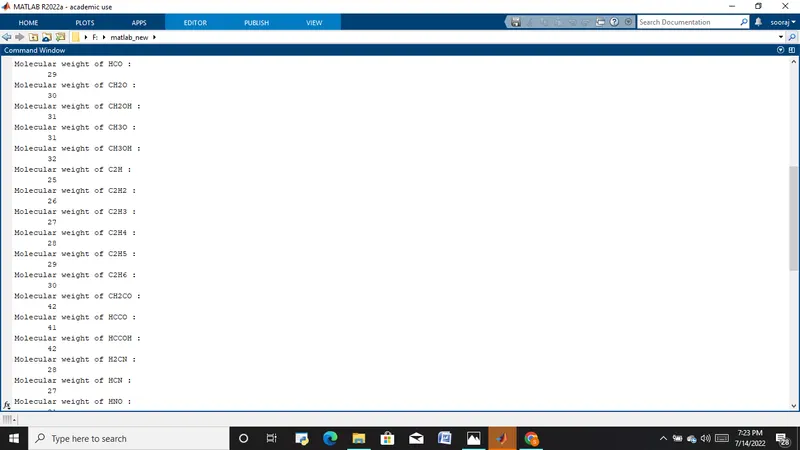
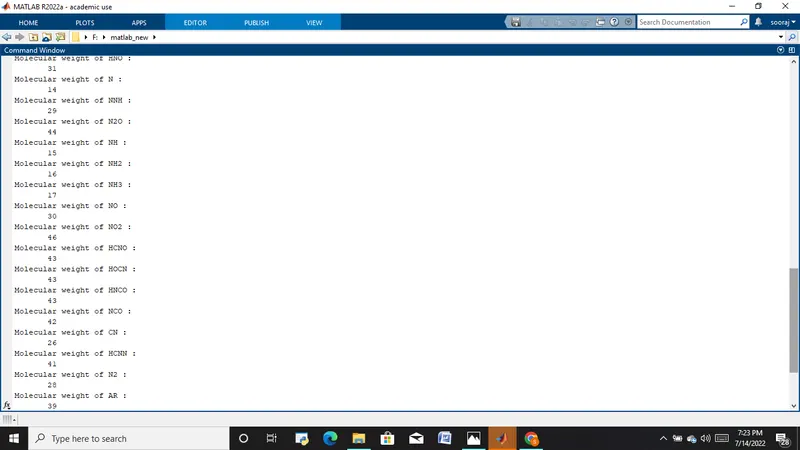
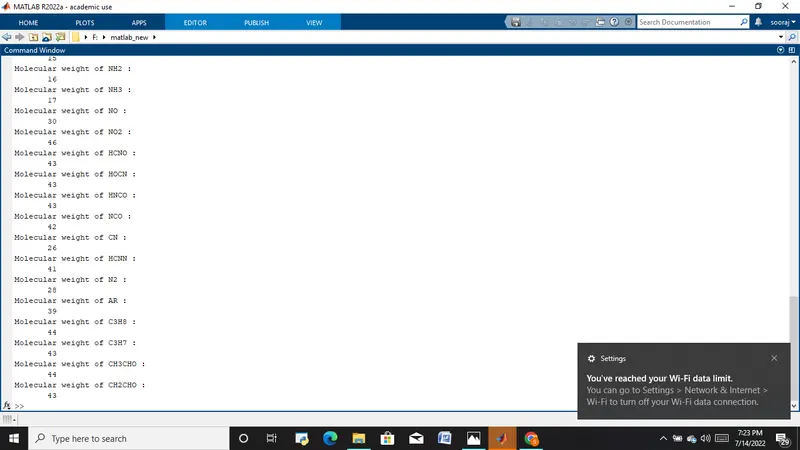
Molecular weight output:
Result:
the parsing of the NASA Thermodynamic data is done. the coefficients of polynomial of respective gas molecules are extracted and Enthalpy , entropy and specific heat are calculated and graph of enthalpy , entropy and specific heat vs temperature is made The change in H, S, and Cp with temperature for different gas can be observed in the plot.screenshot of plots of O2 ,Co2 and N2 are pasted above. molecular weight is also calculated.
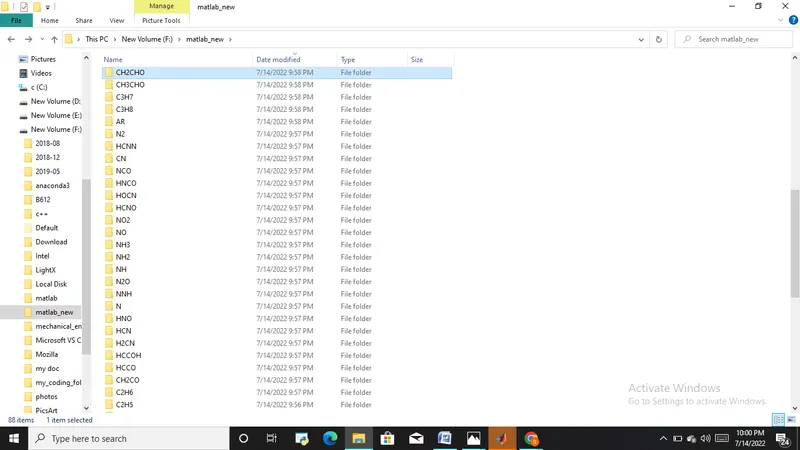
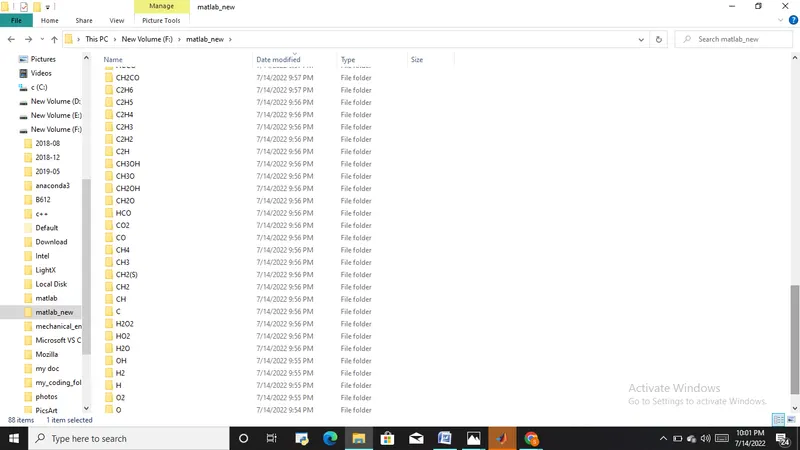
plots of all gas species are saved in folder 'matlab_new' , and screenshot of folder is shown below.
Reference:
- https://www.mathworks.com/help/matlab/ref/fprintf.html
- https://www.mathworks.com/help/matlab/ref/mkdir.html
- https://www.mathworks.com/help/matlab/ref/strcmp.html
- https://www.mathworks.com/matlabcentral/answers/513173-strtok-is-only-using-the-first-character-of-my-delimiter-instead-of-the-full-character-vector
- https://skill-lync.com/student-projects/Nasa-File-Parsing-11825
- https://skill-lync.com/student-projects/nasa-file-parsing-79131
Google drive link for plot folder:https:https://drive.google.com/drive/folders/1Ss4NOF6i_jKCad_DEwmNW2p-KyDMqvOy?usp=sharing
Screen shot of folder containing the plots