Project 1 - Parsing NASA thermodynamic data
PROGRAM: Parsing NASA thermodynamic data
AIM:
To write a code,
- That extracts the 14 co-efficients and calculates the enthalpy, entropy and specific heats for all the species in the data file.
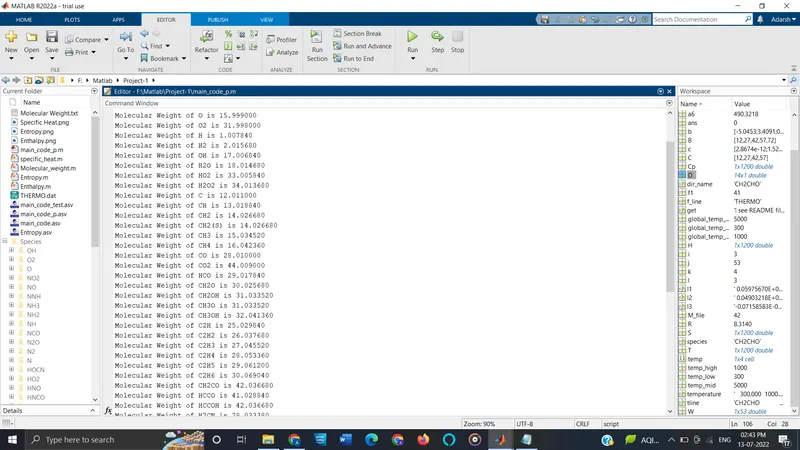
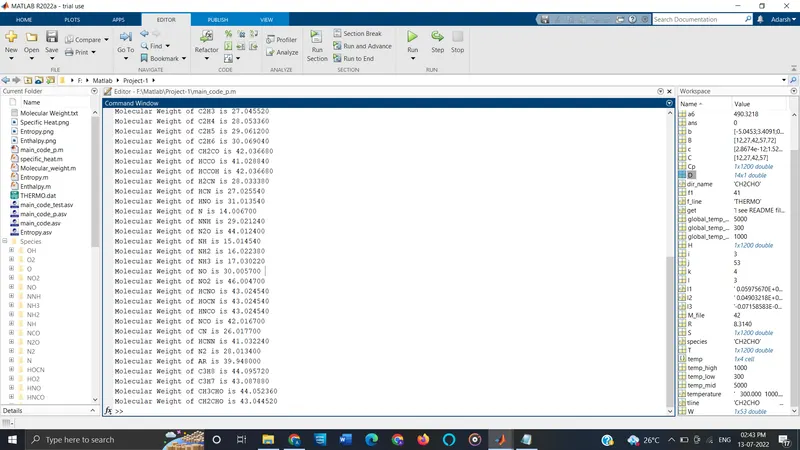
- That calculate the molecular weight of each species and display it in the command window.
- Plot the Cp, Enthalpy and Entropy for the local temperature range specific for each species and save the plots as images with appropriate names and dump them in separate folders for each species with suitable name. (Add Plots for o2, N2 and Co2 species in the result).
OBJECTIVE:
- To understand about different data extraction commands and also File writing, file reading and data parsing.
- To evaluate thermodynamic properties such as Cp, H and S using NASA's polynomial.
- To analyse the plots of Cp, Enthalpy and Entropy for the local temperature range specific for each species.
GOVERNING EQUATION:
The NASA thermochemical polynomials have the form given below. Here R is the universal gas constant, T is the temeprature.
`C_P/R=a_1+a_2 *T+a_3*T^2+a_4*T^3+a_5*T^4`
`H/(RT)=a_1+a_2*T/2+a_3*T^2/3+a_4*T^3/4+a_5*T^4/5+a_6/T`
`S/R=a_1*lnT+a_2*T+a_3*T^2/2+a_4*T^3/3+a_5*T^4/4+a_7`
Where,
`C_p = "Specific Heat (KJ)"`
`S = " Entropy (KJ/mol-K)"`
`H="Enthalpy (KJ/mol)"`
NASA came up with polynomials that can be used to evaluate thermodynamic properties such as Cp, H and S. They have also documented the co-efficients that are required to evaluate these polynomials for 1000+ species. Here we take 53 such species (File name: THERMO.dat). Each species have 14 coefficients a1 to a14. The first 7 coefficients are High-temperature coefficients and the second 7 coefficients are Low-temperature coefficients.
THEORY:
- File Parsing:
Parsing a file means reading in a data stream and building a memory model of the content of that data. This aims at facilitating perfoming some kind of transformation on the data. Parsing splits a file or other input into pieces of data that can be easily stored or manipulated.
Here we split the given data for the calculation of thermodynamic properties. - Specific Heat:
The specific heat is the amount of heat per unit mass required to raise the temperature by one degree Celsius. The relationship between heat and temperature change is usually expressed in the form shown below where Cp is the specific heat.
Cp = R*(a1 + (a2*T) + (a3*(T).^2) + (a4*(T).^3) + (a5*(T).^4)) - Entropy (S):
Entropy, the measure of a system's thermal energy per unit temperature that is unavailable for doing useful work. Because work is obtained from ordered molecular motion, the amount of entropy is also a measure of the molecular disorder, or randomness, of a system.
S = R*(a1.*log(T) + (a2*T) + ((a3*(T).^2)/2) + ((a4*(T).^3)/3) + ((a5*(T).^4)/4) + a7) - Enthalpy (H):
Enthalpy is the measurement of energy in a thermodynamic system. The quantity of enthalpy equals to the total content of heat of a system, equivalent to the system’s internal energy plus the product of volume and pressure.
H = R*T.*(a1 + ((a2*T)/2) + ((a3*(T).^2)/3) + ((a4*(T).^3)/4) + ((a5*(T).^4)/5) + ((a6./T)))
STEPS:
- Defining function code for finding Specific Heat, Entropy, Enthalpy and Molecular weight.
- Creating Main code- Reading data file and parsing the data as needed.
- Creating 'for' loop for getting coefficients, Cp, H, S and Molecular weight for each species seperately.( Parsing data, Calling function and plot command)
- Plotting graphs and saving each in different folder with species name.
- Analysing the result.
FUNCTION CODE:
Note: Here in main code the 14 coefficients are stored in a column matrix (14×1) 'D'. So the terms for coefficients are taken accordingly in the function code.
- Specific Heat:
function Cp = specific_heat(D,T,R,temp_mid)
% Calculating specific heat for higher and lower temperature
if (T <= temp_mid)
Cp = R*(D(8) + (D(9)*T)+(D(10)*(T).^2)+(D(11)*(T).^3)+(D(12)*(T).^4));
else
Cp = R*(D(1) + (D(2)*T)+(D(3)*(T).^2)+(D(4)*(T).^3)+(D(5)*(T).^4));
end
end
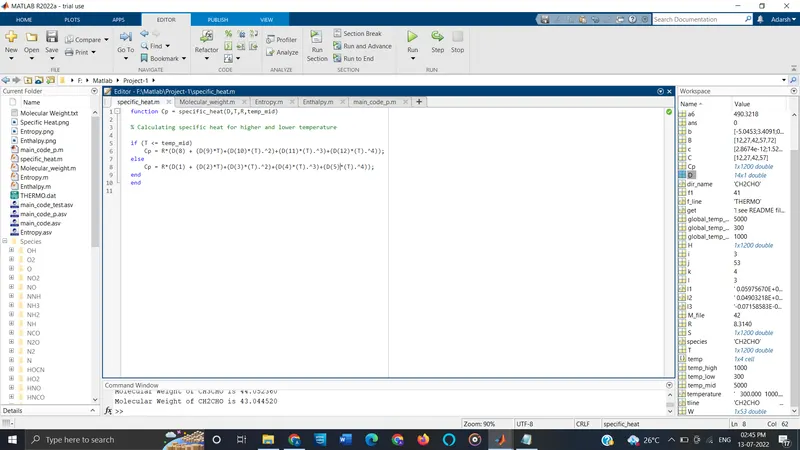
The above function code is saved in the same folder of main code with name 'specific_heat.m'. The NASA's thermochemical polynomials to find Cp is given in this function. It take inputs whenever it is called in a code and gave the output.
- Enthalpy:
function H = Enthalpy(D,T,R,temp_mid)

% Calculating enthalpy for higher and lower temperature
if (T <= temp_mid)
    H = R*T.*(D(8)+((D(9)*T)/2)+((D(10)*(T).^2)/3)+((D(11)*(T).^3)/4)+((D(12)*(T).^4)/5)+(D(13)./T));
else
    H = R*T.*(D(1)+((D(2)*T)/2)+((D(3)*(T).^2)/3)+((D(4)*(T).^3)/4)+((D(5)*(T).^4)/5)+(D(6)./T));
end
end
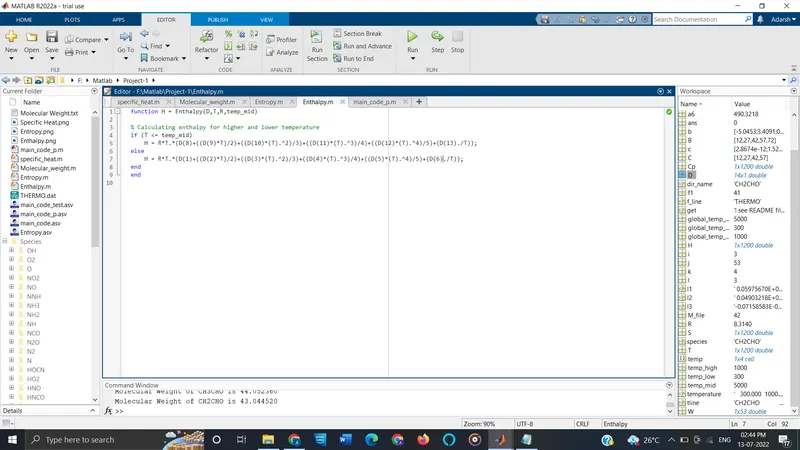
The above function code is saved in the same folder of main code with name 'Enthalpy.m'. The NASA's thermochemical polynomials to find H is given in this function. It take inputs whenever it is called in a code and gave the output.
- Entropy:
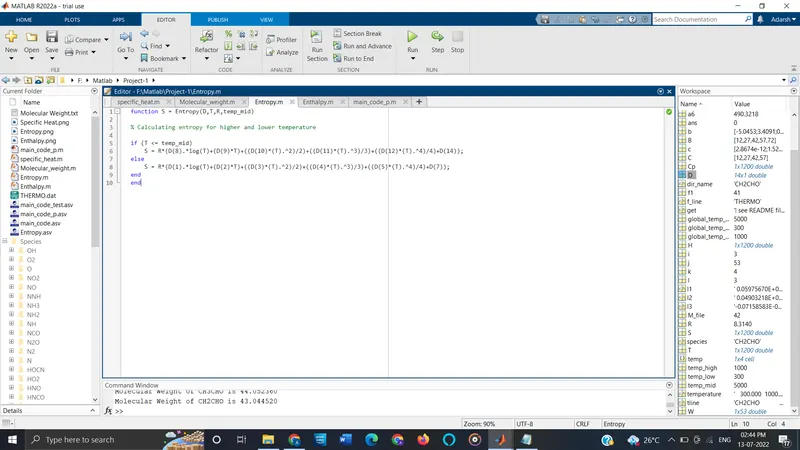
function S = Entropy(D,T,R,temp_mid)

% Calculating entropy for higher and lower temperature

if (T <= temp_mid)
    S = R*(D(8).*log(T)+(D(9)*T)+((D(10)*(T).^2)/2)+((D(11)*(T).^3)/3)+((D(12)*(T).^4)/4)+D(14));
else
    S = R*(D(1).*log(T)+(D(2)*T)+((D(3)*(T).^2)/2)+((D(4)*(T).^3)/3)+((D(5)*(T).^4)/4)+D(7));
end
end
The above function code is saved in the same folder of main code with name 'Entropy.m'. The NASA's thermochemical polynomials to find S is given in this function. It take inputs whenever it is called in a code and gave the output.
- Molecular Weight:
function W = Molecular_weight(species)
% Defining Atomic name of the species
atomic_name = ['H','C','O', 'N','Ar'];

% Defining Atomic masses of main species
atomic_weight = [1.00784 12.011 15.999 14.0067 39.948];

W=0; % starting range

for i=1:length(species)
    for j=1:length(atomic_name)
        if strcmp(species(i), atomic_name(j)) % comparing two strings
            W = W + atomic_weight(j);
            position = j;
        end
    end
    n = str2num(species(i));
    if n>1
        W = W + atomic_weight(position)*(n-1);
    end
end
% Command to print molecular weight in command window
fprintf('Molecular Weight of %s is %f n',  species, W);
disp('')
end
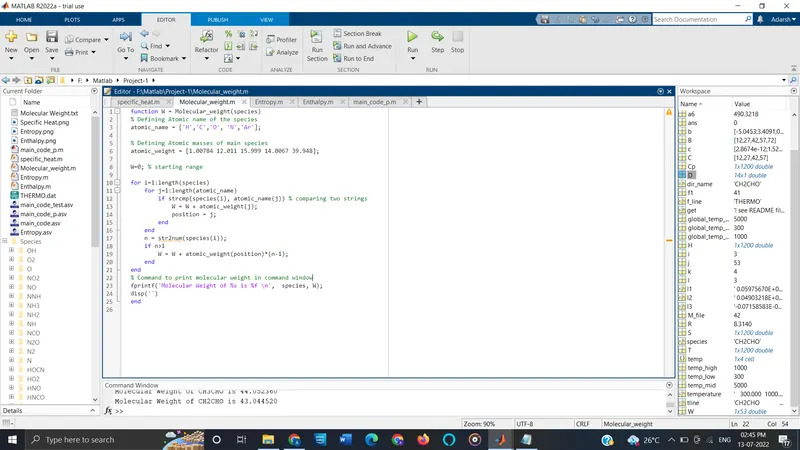
The above function code is saved in the same folder of main code with name 'Molecular_weight.m'. It take inputs whenever it is called in a code and gave the output.
In this function code, intially we define the atomic weight of different Atomic species. Here we take two 'for loop' for comparing the Atomic name we given in the function with the input data character. This is done by using the command strcmp(a,b) within the 'if' statement. If the statement is true then it will add the atomic weight. The code to display the molecular weight of each species in the command window is also provided.
MAIN CODE:
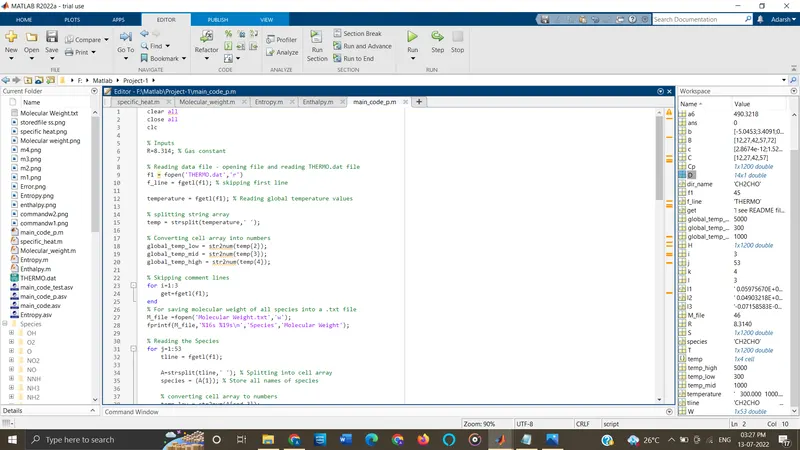
clear all
close all
clc

% Inputs
R=8.314; % Gas constant

% Reading data file - opening file and reading THERMO.dat file
f1 = fopen('THERMO.dat','r')
f_line = fgetl(f1); % skipping first line

temperature = fgetl(f1); % Reading global temperature values

% splitting string array
temp = strsplit(temperature,' ');

% Converting cell array into numbers
global_temp_low = str2num(temp{2});
global_temp_mid = str2num(temp{3});
global_temp_high = str2num(temp{4});

% Skipping comment lines
for i=1:3
    get=fgetl(f1);
end
% For saving molecular weight of all species into a .txt file
M_file =fopen('Molecular Weight.txt','w');
fprintf(M_file,'%16s %19sn','Species','Molecular Weight');

% Reading the Species
for j=1:53
    tline = fgetl(f1);

    A=strsplit(tline,' '); % Splitting into cell array
    species = (A{1}); % Store all names of species

    % converting cell array to numbers
    temp_low = str2num(A{end-3});
    temp_high = str2num(A{end-2});
    temp_mid = str2num(A{end-1});
    % Creating local temperature range
    T =linspace(temp_low,temp_high,1200);

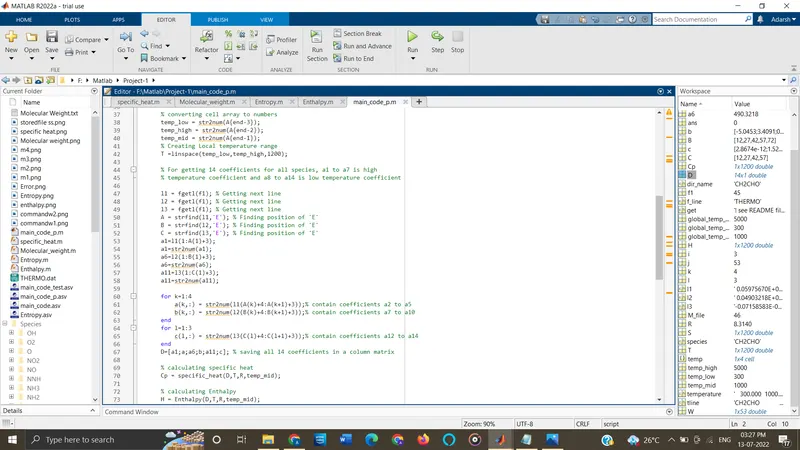
    % For getting 14 coefficients for all species, a1 to a7 is high
    % temperature coefficient and a8 to a14 is low temperature coefficient

    l1 = fgetl(f1); % Getting next line
    l2 = fgetl(f1); % Getting next line
    l3 = fgetl(f1); % Getting next line
    A = strfind(l1,'E'); % Finding position of 'E'
    B = strfind(l2,'E'); % Finding position of 'E'
    C = strfind(l3,'E'); % Finding position of 'E'
    a1=l1(1:A(1)+3);
    a1=str2num(a1);
    a6=l2(1:B(1)+3);
    a6=str2num(a6);
    a11=l3(1:C(1)+3);
    a11=str2num(a11);

    for k=1:4
        a(k,:) = str2num(l1(A(k)+4:A(k+1)+3));% contain coefficients a2 to a5
        b(k,:) = str2num(l2(B(k)+4:B(k+1)+3));% contain coefficients a7 to a10
    end
    for l=1:3
        c(l,:) = str2num(l3(C(l)+4:C(l+1)+3));% contain coefficients a12 to a14
    end
    D=[a1;a;a6;b;a11;c]; % saving all 14 coefficients in a column matrix

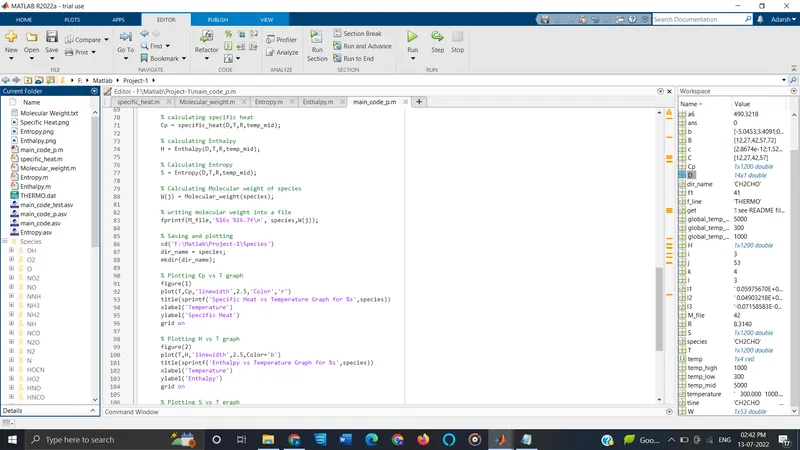
    % calculating specific heat
    Cp = specific_heat(D,T,R,temp_mid);

    % calculating Enthalpy
    H = Enthalpy(D,T,R,temp_mid);

    % Calculating Entropy
    S = Entropy(D,T,R,temp_mid);

    % Calculating Molecular weight of species
    W(j) = Molecular_weight(species);

    % writing molecular weight into a file
    fprintf(M_file,'%16s %16.7fn', species,W(j));

    % Saving and plotting
    cd('F:MatlabProject-1Species')
    dir_name = species;
    mkdir(dir_name);

    % Plotting Cp vs T graph
    figure(1)
    plot(T,Cp,'linewidth',2.5,'Color','r')
    title(sprintf('Specific Heat vs Temperature Graph for %s',species))
    xlabel('Temperature')
    ylabel('Specific Heat')
    grid on

    % Plotting H vs T graph
    figure(2)
    plot(T,H,'linewidth',2.5,Color='b')
    title(sprintf('Enthalpy vs Temperature Graph for %s',species))
    xlabel('Temperature')
    ylabel('Enthalpy')
    grid on

    % Plotting S vs T graph
    figure(3)
    plot(T,S,'linewidth',2.5,'Color','g')
    title(sprintf('Entropy vs Temperature Graph for %s',species))
    xlabel('Temperature')
    ylabel('Entropy')
    grid on

    % Saving each species's plots within seperate folder
    cd(dir_name);
    saveas(1,'Specific Heat.png');
    saveas(2,'Enthalpy.png');
    saveas(3,'Entropy.png');
    cd('F:MatlabProject-1')
end
fclose(M_file);
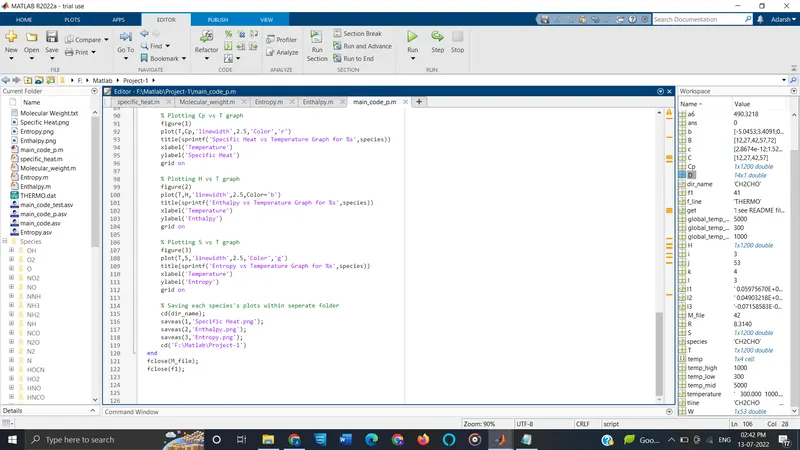
fclose(f1);- Explanation:
- Initially we inputs the value Universal gas constant 'R' and the command to open (fopen) and read the data file THERMO.dat is given. Also the command which extract the global temperature line of the data is given by skipping the first line and is stored under variable called 'temperature'.
clear allclose allclc% InputsR=8.314; % Gas constant% Reading data file - opening file and reading THERMO.dat filef1 = fopen('THERMO.dat','r')f_line = fgetl(f1); % skipping first linetemperature = fgetl(f1); % Reading global temperature values - The character array stored in 'temperature' then split into different cell array. These cell arrays then convert into numbers for using these values for computation. str2num() command helps to convert data into numbers. The command to skip the 3 comment lines also given.
% splitting string arraytemp = strsplit(temperature,' ');% Converting cell array into numbersglobal_temp_low = str2num(temp{2});global_temp_mid = str2num(temp{3});global_temp_high = str2num(temp{4});% Skipping comment linesfor i=1:3get=fgetl(f1);end - The command to write the molecular weight in a text file is given. For reducing the time of writing code for each species, here we use 'for loop'. Now, we will run the loop to find 53 element in the data file by assigning fgetl command and then spliting into the cell array to find the species line and then find the species name and then find the local temperatures in the species line. The local temperature range is also given.
tline = fgetl(f1);A=strsplit(tline,' '); % Splitting into cell arrayspecies = (A{1}); % Store all names of species% converting cell array to numberstemp_low = str2num(A{end-3});temp_high = str2num(A{end-2});temp_mid = str2num(A{end-1});% Creating local temperature rangeT =linspace(temp_low,temp_high,1200); - The next step is to find the 14 coefficients. For each species data - first and second line contain 5 coefficients each. But third line contain 4 coefficients. Two 'for loops' are used for finding these coefficients from each line. In order to read the coefficient in the data file we will first find the 'E' string using 'strfind' command to find before and after numbers of the coefficients then we will find remaining 14 coefficients and convert them to numbers from strings.
% For getting 14 coefficients for all species, a1 to a7 is high% temperature coefficient and a8 to a14 is low temperature coefficientl1 = fgetl(f1); % Getting next linel2 = fgetl(f1); % Getting next linel3 = fgetl(f1); % Getting next lineA = strfind(l1,'E'); % Finding position of 'E'B = strfind(l2,'E'); % Finding position of 'E'C = strfind(l3,'E'); % Finding position of 'E'a1=l1(1:A(1)+3);a1=str2num(a1);a6=l2(1:B(1)+3);a6=str2num(a6);a11=l3(1:C(1)+3);a11=str2num(a11);for k=1:4a(k,:) = str2num(l1(A(k)+4:A(k+1)+3));% contain coefficients a2 to a5b(k,:) = str2num(l2(B(k)+4:B(k+1)+3));% contain coefficients a7 to a10endfor l=1:3c(l,:) = str2num(l3(C(l)+4:C(l+1)+3));% contain coefficients a12 to a14end - The 14 coefficient that we extracted then stored in a (14×1) column matrix 'D'.
D=[a1;a;a6;b;a11;c]; % saving all 14 coefficients in a column matrix - Then code call all 4 functions to compute specific heat, entropy, enthalpy and molecular weight. Also the code to write the molecular weight of each species into the file 'Molecular weight.txt' is given.
% calculating specific heatCp = specific_heat(D,T,R,temp_mid);% calculating EnthalpyH = Enthalpy(D,T,R,temp_mid);% Calculating EntropyS = Entropy(D,T,R,temp_mid);% Calculating Molecular weight of speciesW(j) = Molecular_weight(species);% writing molecular weight into a filefprintf(M_file,'%16s %16.7fn', species,W(j)); - Now we change the directory using 'cd' command to species folder. By using the 'mkdir' commnad we create 53 folders each having name of different species.
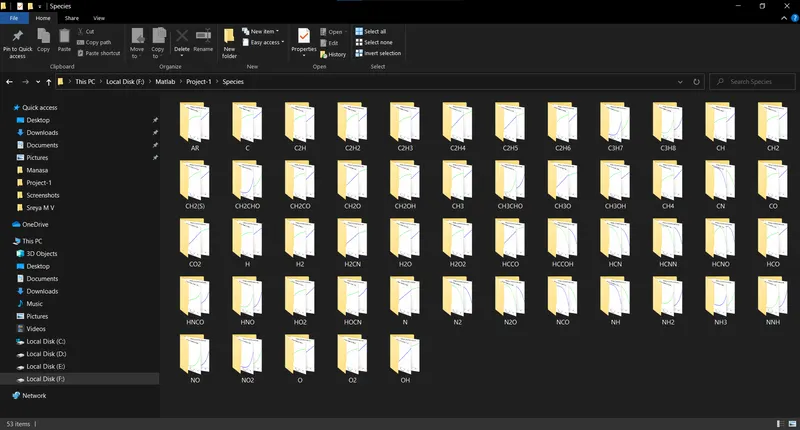
% Saving and plottingcd('F:MatlabProject-1Species')dir_name = species;mkdir(dir_name); - We gave the command to plot all three graphs (Cp vs T, S vs T and H vs T). Then the command to store (saveas command) these three graphs of different species automatically in the individual folder created is given.
% Plotting Cp vs T graphfigure(1)plot(T,Cp,'linewidth',2.5,'Color','r')title(sprintf('Specific Heat vs Temperature Graph for %s',species))xlabel('Temperature')ylabel('Specific Heat')grid on% Plotting H vs T graphfigure(2)plot(T,H,'linewidth',2.5,Color='b')title(sprintf('Enthalpy vs Temperature Graph for %s',species))xlabel('Temperature')ylabel('Enthalpy')grid on% Plotting S vs T graphfigure(3)plot(T,S,'linewidth',2.5,'Color','g')title(sprintf('Entropy vs Temperature Graph for %s',species))xlabel('Temperature')ylabel('Entropy')grid on% Saving each species's plots within seperate foldercd(dir_name);saveas(1,'Specific Heat.png');saveas(2,'Enthalpy.png');saveas(3,'Entropy.png'); - So before ending the 'for loop' we should give a code to change the directory as in initial condition to avoid getting error.
cd('F:MatlabProject-1')endfclose(M_file);fclose(f1);
- Command used while coding:
- fopen(filename) - To open a file or obatain information about open files
- fgetl(fileID) - Read a line from file
- strsplit(str , delimiter) - Split string or character vector at specified delimiter
- str2num(txt) - Convert character array or string to number array
- fprintf(fileID, formatSpec, A1,...An) - Write formatted data to file
- linspace(a,b,n) - To create linearly spaced vectors
- strfind(str,pat) - To find one string within another
- cd(newFolder) - To change working directory
- mkdir(___) - To make new directory
ERROR OCCURED DURING CODING:
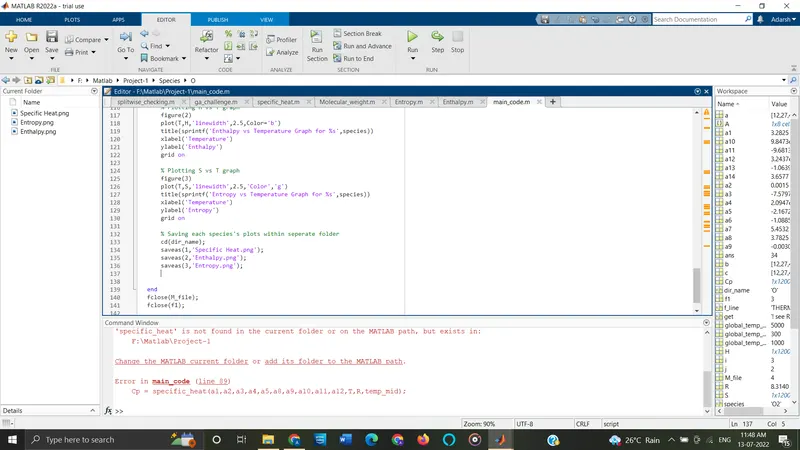
While the code RUN I got the above error. This is because of the change in working directory. For j=1, the loop will RUN and calculate all value for 'O' (Oxygen) and stores the plot in the folder O . i.e.
F: → Matlab → Project-1 → Species → O. But the function code, data file and main code are in the folder Project-1. So due to change in working directory the function won't work. It will shows error message.
So to avoid this situation I added command to change the working directory (as Project-1) at the end of for loop. So at the end of every for loop the working directory will change to the intial condition. So the code will RUN successfully.
- FUNCTION CODE:
- Specific Heat:
- Molecular weight:
- Enthalpy:
- Entropy:
- MAIN CODE:
- MOLECULAR WEIGHT IN COMMAND WINDOW:
- `ul("GRAPHS FOR "O_2," "N_2" "&" "CO_2)`
- `ul(O_2)`
Specific heat vs Temperature: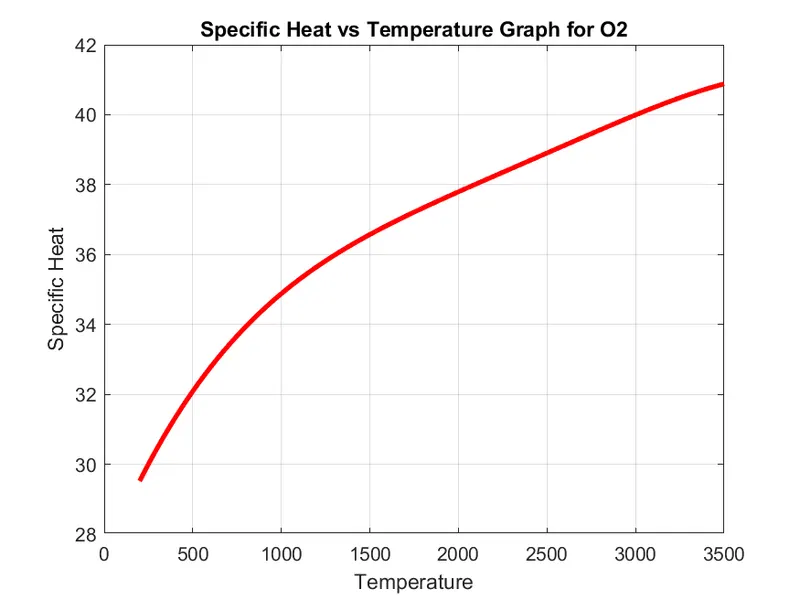
Enthalpy vs Temperature: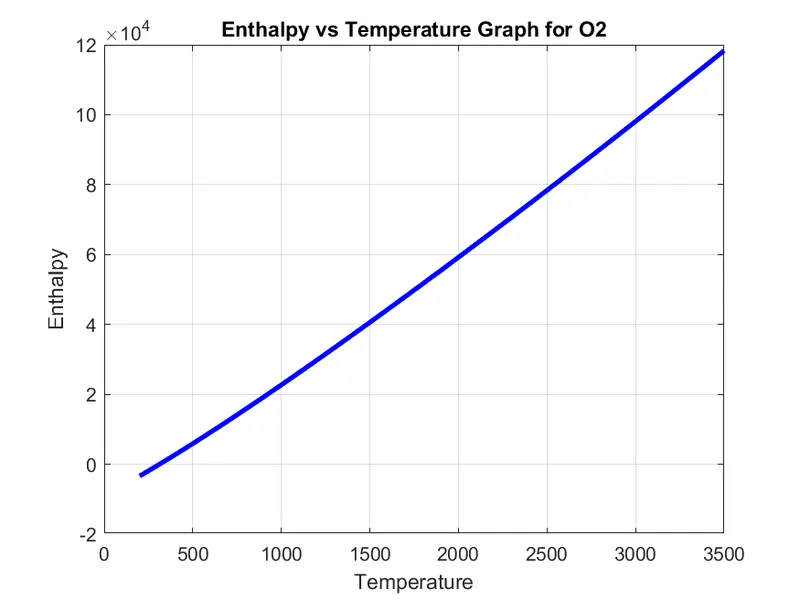
Entropy vs Temperature: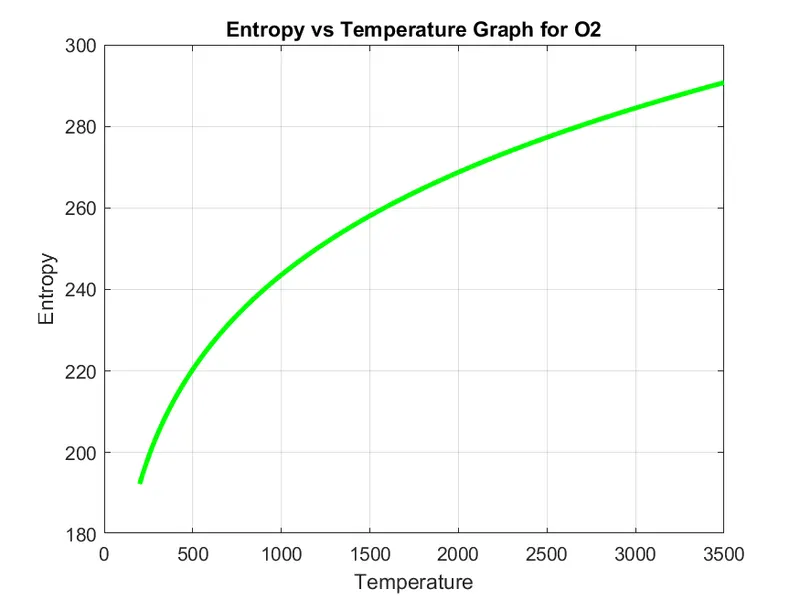
- `ul(N_2)`
Specific heat vs Temperature: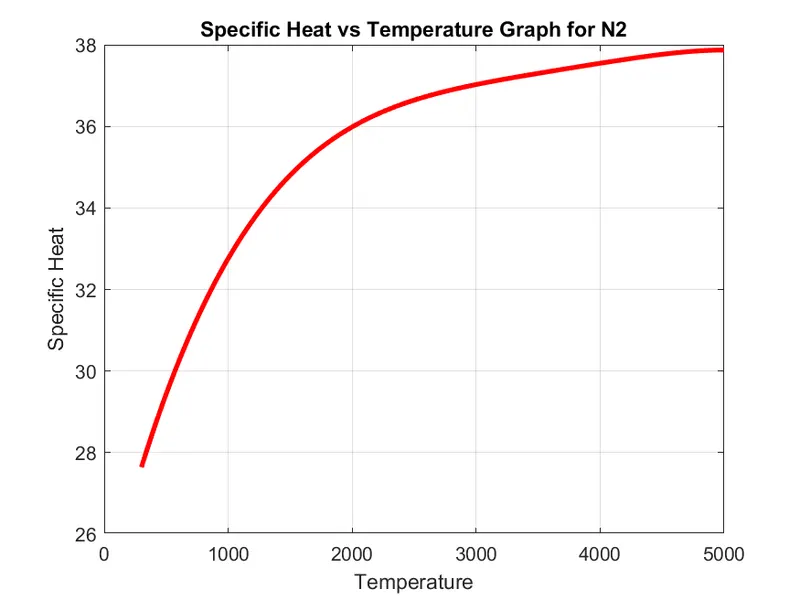
Enthalpy vs Temperature: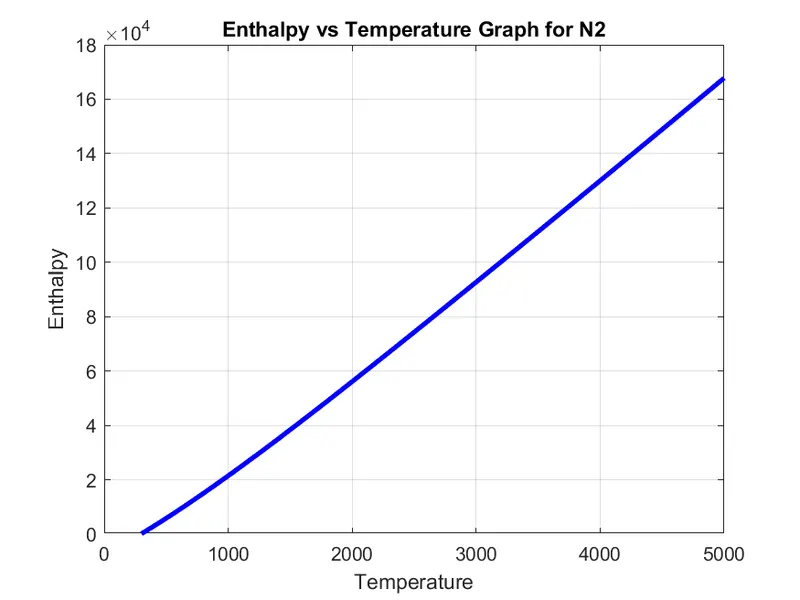
Entropy vs Temperature: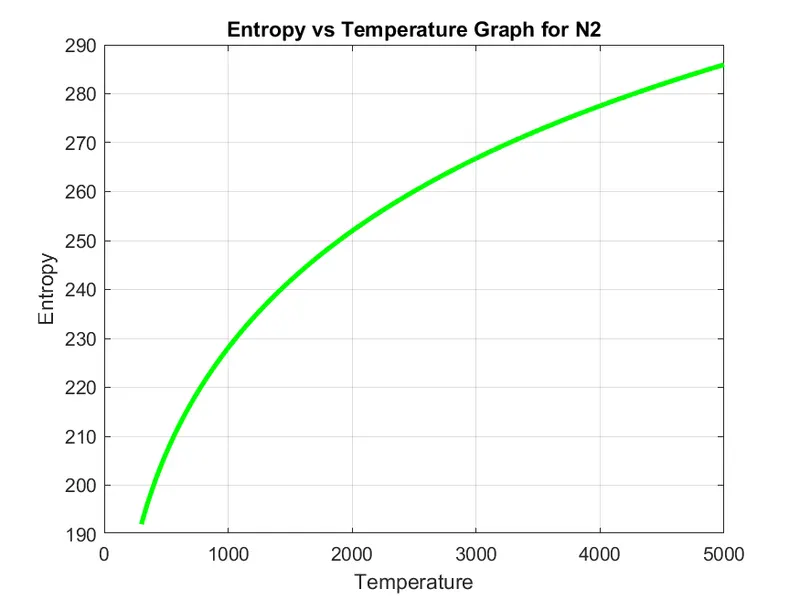
- `ul(CO_2)`
Specific heat vs Temperature: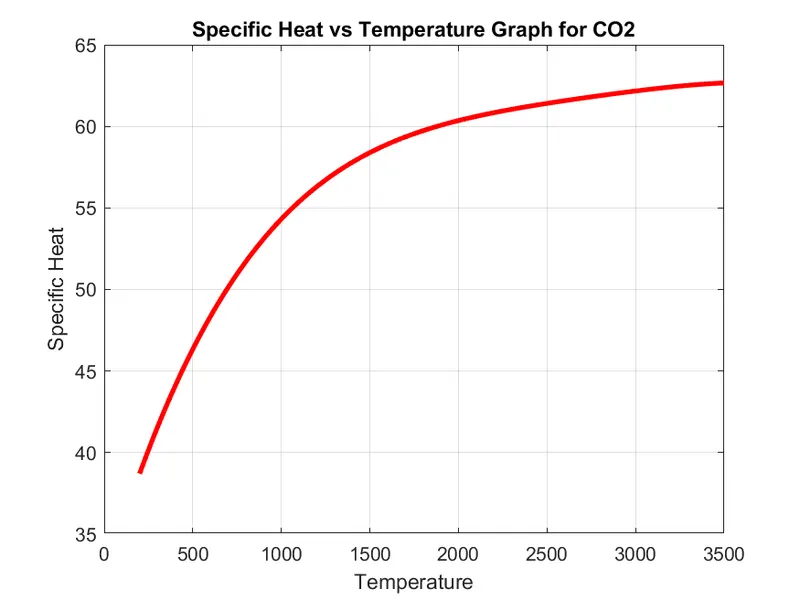
Enthalpy vs Temperature: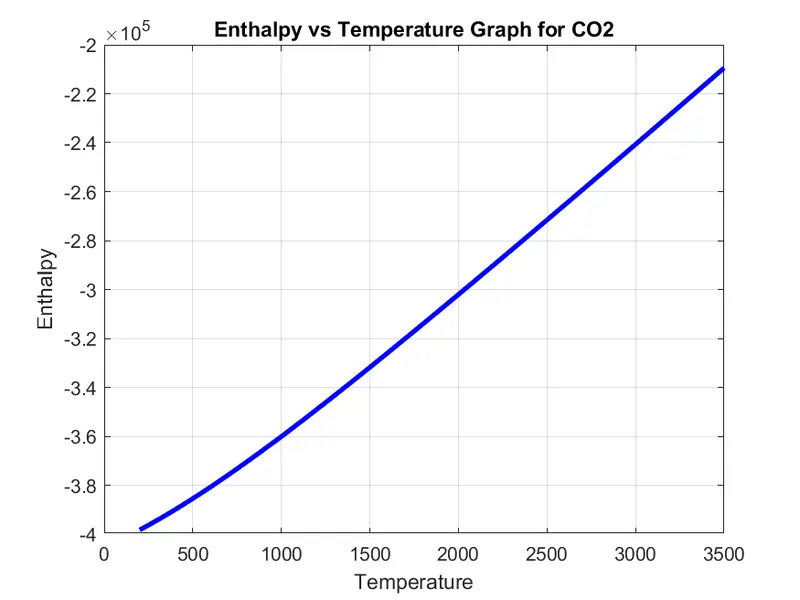
Entropy vs Temperature: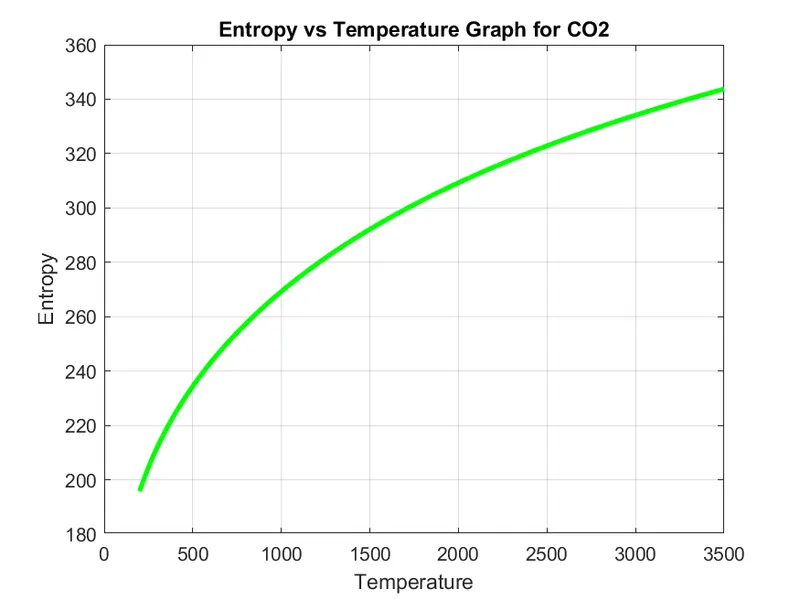
- DIFFERENT SPECIES SAVED DIRECTORY SCREENSHOT
Google Drive Link: https://drive.google.com/drive/folders/1YGzZFFpeMwud4xrvl9Te2P0UKvQWJYdN?usp=sharing
RESULT:
- The code to extracts the 14 co-efficients of NASA's thermodynamic file and calculates the enthalpy, entropy and specific heats for all the species in the data file is created.
- The code which calculate the molecular weight of each species and displays it in the command window is successfully RUN.
- The variation of Cp, Enthalpy and Entropy with respect to local temperature range specific for each species were plotted and saved the plots as images with appropriate names and dump them in separate folders for each species with suitable name.
CONCLUSION:
The project helps me to understand about data parsing using MATLAB and how this data can be used for other MATLAB operation. It also give a better idea about file reading and writing. This project explains how a big data can be processed with MATLAB.
On successful parsing of data from NASA's Thermodynamic Data file, variation of thermodynamic properties with temperature of certain species of molecules are plotted and studied.
REFERENCE:
- https://link.springer.com/content/pdf/bbm%3A978-1-4684-0186-8%2F1.pdf
- https://in.mathworks.com/help/matlab/referencelist.html?type=function&category=printing-and-exporting
- https://in.mathworks.com/help/matlab/ref/saveas.html
- https://in.mathworks.com/help/matlab/ref/mkdir.html
- https://in.mathworks.com/help/matlab/ref/fopen.html?s_tid=srchtitle_fopen_1