Project 1 - Parsing NASA thermodynamic data
Aim :-
1. Write a function that extracts the 14 co-efficients and calculates the enthalpy, entropy and specific heats for all the species in the data file. This file NASA thermodynamic data ?? was provided. The formulae for Specific Heat, Enthalpy and Entropy was given and it was stated that R is the universal gas constant, T is the temeprature. In addition it was also stated that, The FIRST 7 coefficients are HIGH-temperature coefficients and the SECOND 7 coefficients are LOW-temperature coefficients.Also use the LOCAL TEMPERATURE RANGES which is unique for each individual species, not the GLOBAL TEMPERATURE RANGE.
2. Calculate the molecular weight of each species and display it in the command window.
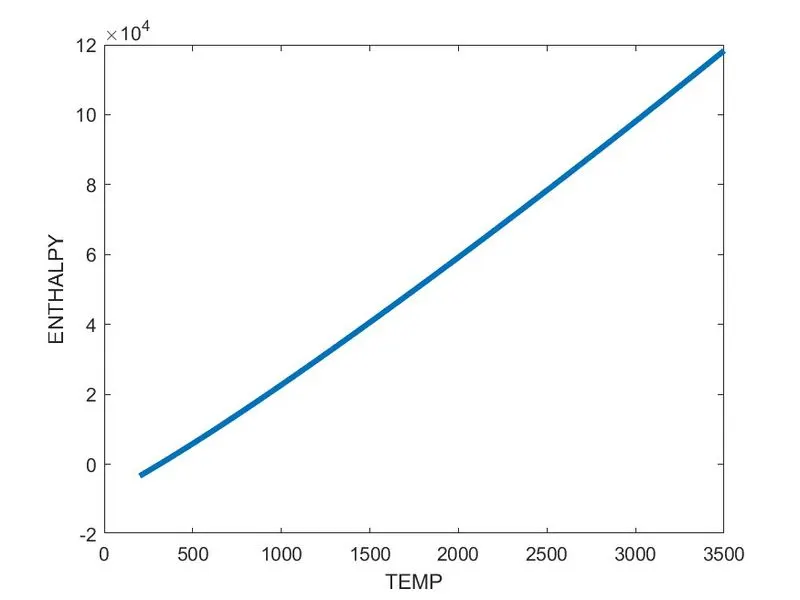
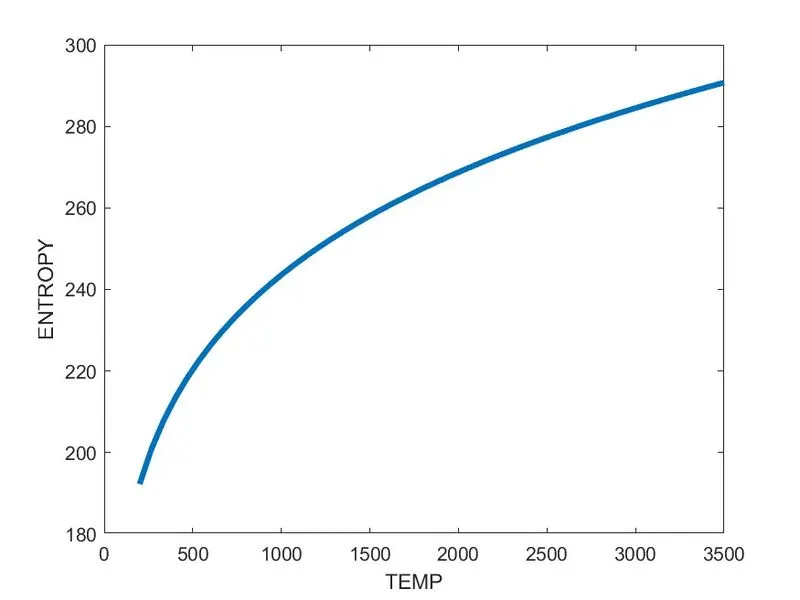
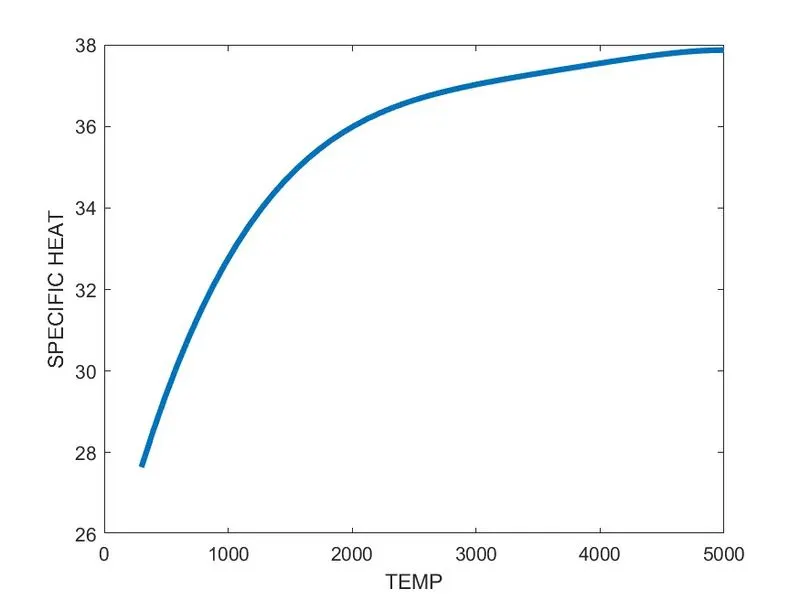
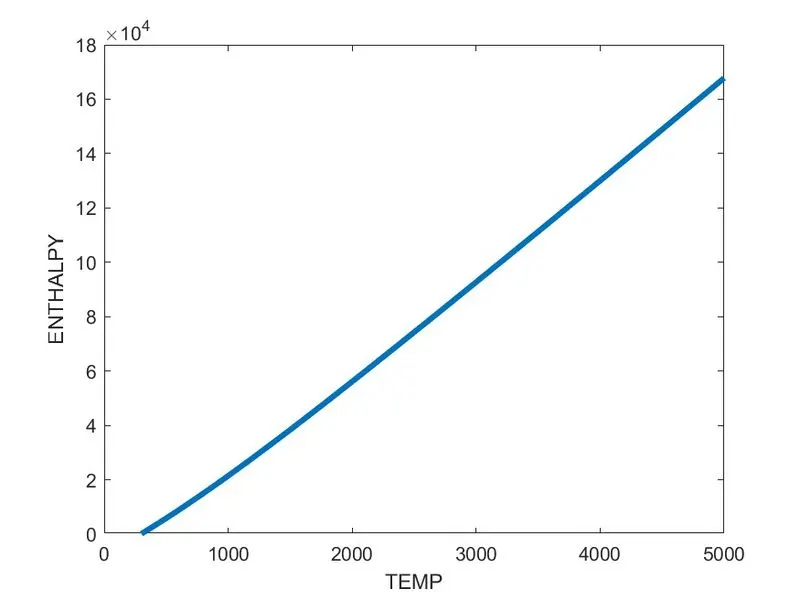
3. Plot the Cp, Enthalpy and Entropy for the local temperature range (low temperature : high temperature) specific for each species.
4. Save the plots as images with appropriate names and dump them in separate folders for each species with suitable name. All these should be generated automatically.
5. The main program that you will submit will just take the "THERMO.dat" file as an input and generate Cp, H and S plots.
6. Please write a detailed report to describe your logic.
THEORY :-
1. File THERMO.DAT was provided and it was instructed to extract 14 coefficients from the DAT file. The extracted coefficients were to be used to calculate the SPECIFIC HEAT, ENTHALPY and ENTROPY for 53 particular species given in the 'THERMO.DAT'.
2. Based on the Algo, following codes were used while processing the code :-
CLEAR ALL :- Erases the un necessary variables from the memory.
CLOSE ALL :- Closing all the unnecessary windows poped out from previous codes.
CLC :- It clears all the comments from the command window.
FOPEN :- Open files and obtain the informations.
FCLOSE :- Closes one or all open file from which the informations are being taken.
FGETL :- Read from the Line removing new ine character.
STRSPLIT :- Split a character vector that contains comma-separated values.
STR2NUM :- Convert String to a Numerical value.
STRFIND :- Find the corresponding string the given string array.
LINSPACE :- Used to generate an array of Numbers.
IF ELSE :- For comparing the statement.
XLABEL\YLABEL :- For labeling the axis in plot.
PLOT :- To generate the graph of desired data.
MKDIR:- To create a directory in the ROM.
CD :- To change the directory from the current folder.
SAVEAS :- to save the plot generated during coding
FORMULA USED :-
`cp=(a1+a2*t+a3*t^2+a4*t^3+a5*t^4)*R`
`H=(a1+a2*(t/2)+a3*(t^2)/3+a4*(t^3)/4+a5*(t^4)/5+a6/t)*R*t`
`S=(a1*ln(t) +a2*t+a3*(t.^2)/2+a4*(t^3)/3+a5*(t^4)/4+a7)*R`
CODE
clear all
close all
clc
%Creating a seperate folder as ATOM1
mkdir('ATOM1')
f1=fopen('thermo.dat','r');
fgetl(f1);
a=fgetl(f1);
header=strsplit(a,' ');
GTL=str2num(header{2});
GTM=str2num(header{3});
GTH=str2num(header{4});
for i=1:3
    fgetl(f1);
end
for i=1:53
b=fgetl(f1);
header=strsplit(b,' ');
species=header{1};
x=length(header);
ltl=str2num(header{x-3});
ltm=str2num(header{x-1});
lth=str2num(header{x-2});

coefficient=fgetl(f1);
c=strfind(coefficient,'E'); % annotation of syntax to be remembered
%finding the coefficient
a1=str2num(coefficient(1:c(1)+3));
a2=str2num(coefficient(c(1)+4:c(2)+3));
a3=str2num(coefficient(c(2)+4:c(3)+3));
a4=str2num(coefficient(c(3)+4:c(4)+3));
a5=str2num(coefficient(c(4)+4:c(5)+3));

coefficient=fgetl(f1);
c=strfind(coefficient,'E'); % annotation of syntax to be remembered
%finding the coefficient
a6=str2num(coefficient(1:c(1)+3));
a7=str2num(coefficient(c(1)+4:c(2)+3));
a8=str2num(coefficient(c(2)+4:c(3)+3));
a9=str2num(coefficient(c(3)+4:c(4)+3));
a10=str2num(coefficient(c(4)+4:c(5)+3));

coefficient=fgetl(f1);
c=strfind(coefficient,'E'); % annotation of syntax to be remembered
%finding the coefficient
a11=str2num(coefficient(1:c(1)+3));
a12=str2num(coefficient(c(1)+4:c(2)+3));
a13=str2num(coefficient(c(2)+4:c(3)+3));
a14=str2num(coefficient(c(3)+4:c(4)+3));


R=8.314;
t=linspace(ltl,lth,50);
 for i=1:length(t)
     if (t(i)>ltm)
         %high temp coeff
cp=(a1+a2.*t+a3.*t.^2+a4.*t.^3+a5.*t.^4)*R;
H=(a1+a2.*(t./2)+a3.*(t.^2)./3+a4.*(t.^3)./4+a5.*(t.^4)./5+a6./t)*R.*t;
S=(a1.*log(t) +a2.*t+a3.*(t.^2)./2+a4.*(t.^3)./3+a5.*(t.^4)./4+a7)*R;
     else
         %low temp coeff
 cp=(a8+a9.*t+a10.*t.^2+a11.*t.^3+a12.*t.^4)*R;
 H=(a8+a9.*(t./2)+a10.*(t.^2)./3+a11.*(t.^3)./4+a12.*(t.^4)./5+a13./t)*R.*t;
 S=(a8.*log(t) +a9.*t+a10.*(t.^2)./2+a11.*(t.^3)./3+a12.*(t.^4)./4+a14)*R;
     end
 end

    figure(1)
    plot(t,cp,'LineWidth',3)
    xlabel('TEMP')
    ylabel('SPECIFIC HEAT')
    figure(2)
    plot(t,H,'LineWidth',3)
    xlabel('TEMP')
    ylabel('ENTHALPY')
    figure(3)
    plot(t,S,'LineWidth',3)
    xlabel('TEMP')
    ylabel('ENTROPY')
%Creating the folder to save the plots
mkdir('C:\Users\praba\OneDrive\Documents\ATOM1',species)
save=['C:\Users\praba\OneDrive\Documents\ATOM1\',species];
cd(save)
saveas(1,'specific heat','jpg')
saveas(2,'Enthalpy','jpg')
saveas(3,'Entropy','jpg')
% MOLAR MASS CALCULATION
[k] = mol_wt(species);
t=sprintf('Molar mass of %s is  %f',species,k);
disp(t)
end

fclose(f1)
function k = mol_wt(species)
elements=['H','C','O','N','A'];
atomic_mass= [1.0079,12.0107,15.999,14.0067,39.948];
mol_mass=0;
for (i=1:length(species))
for j=1:length(elements)
if strcmp(species(i),elements(j))
mol_mass=mol_mass+atomic_mass(j);
pos=j;
end
end
d=str2double(species(i));
if d>1
mol_mass=mol_mass+atomic_mass(pos)*(d-1);
end
k=mol_mass;
end
CODE EXPLAINATION
1. The code has been divide into 3 segments. First segment is the to read the data given in the file Thermo.DAT. Prior running the code a Paremt File named as " ATOM1" is created in the currnet directory. The data in the file will be taken into the memory with the help of fopen command and File ID will be assigned to it. In here two loops were declared for obtaining the value of coefficient. in first loop fgetl(f1) was declared so as to move the pointer to the relevant line of the file. in second loop was coded to run for 53 time to extract every data from the species. In this loop the strin was separated with the help of 'strsplit' and cell array was created to obtain the numbering of each string. In this line of code the Local temperature for the particular species was obtained with the command as follows:-
4. In the second Segment the code for changing the directory is decleared so as to save the plots in the species wise folder. after creating the folder the directory of the current folder is changed. code for generating the graph for CP vs TEMP, H vs TEMP & S vs TEMP is decleared for each species. it is to be noted that different plots for respective species are bein saved in the corresponding species folder. the command used were as follows :-
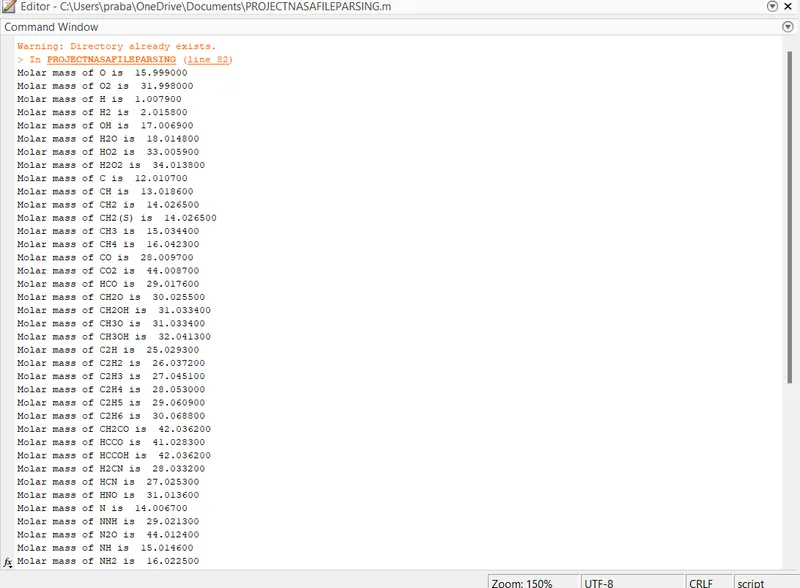
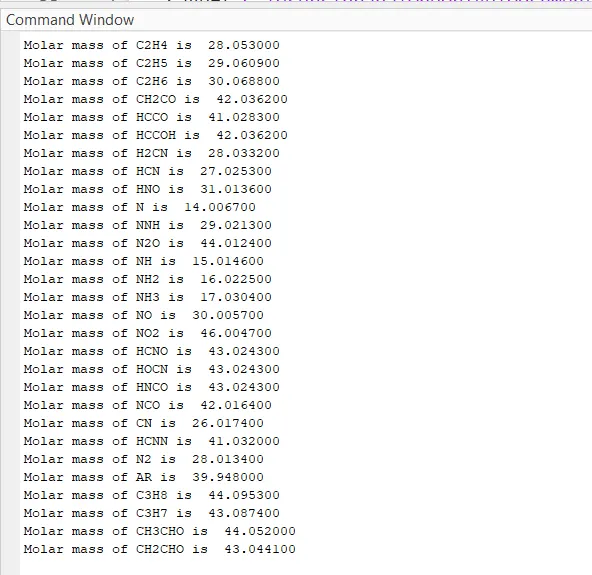
6. In the final segment of the code molecular mass of all 53 elements. The was calculated using the function Mol_wt while coding.
OUTPUT
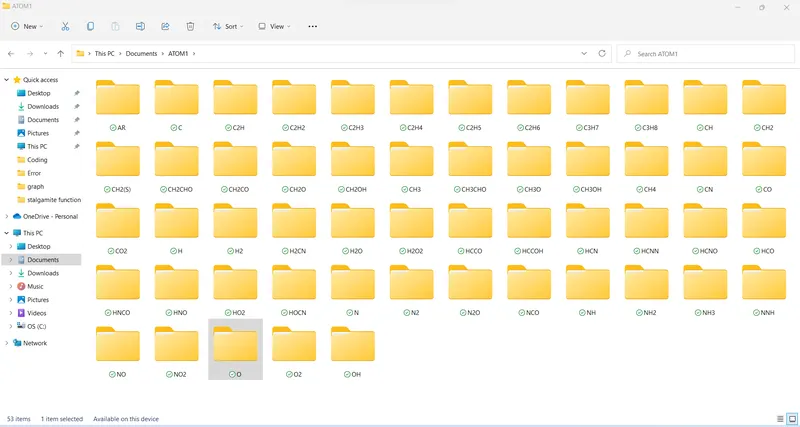
1. FILE OF EACH SPECIES
EXPLAINATION OF OUTPUT
The code is generated to extract the data from Thermo. Dat file and use it for plotting graph for CP Vs T, H vs T, S vs T & saving the JPGs of all graph automatically in the desired directory. From above it can be seen that the aim has been achieved.
2. MOLAR MASS OF SPECIES OF ALL SPECIES
EXPLAINATION OF OUTPUT
The code is generated to extract the data from Thermo. Dat file and use it for calculating the molecular mass of all 53 species. From above it can be seen that the aim has been achieved.
GRAPH
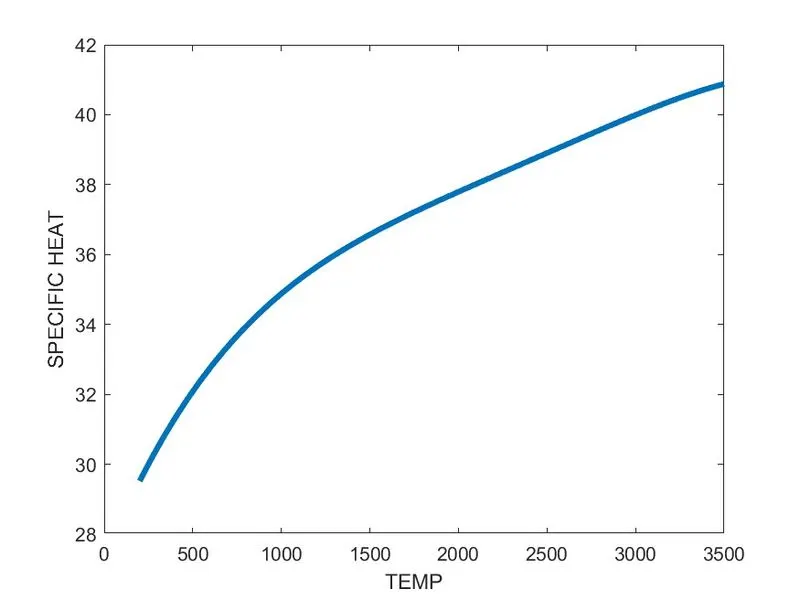
1. O2
CP vs TEMP
H vs TEMP
S vs TEMP
2. N2
CP vs TEMP
H vs TEMP
S vs TEMP
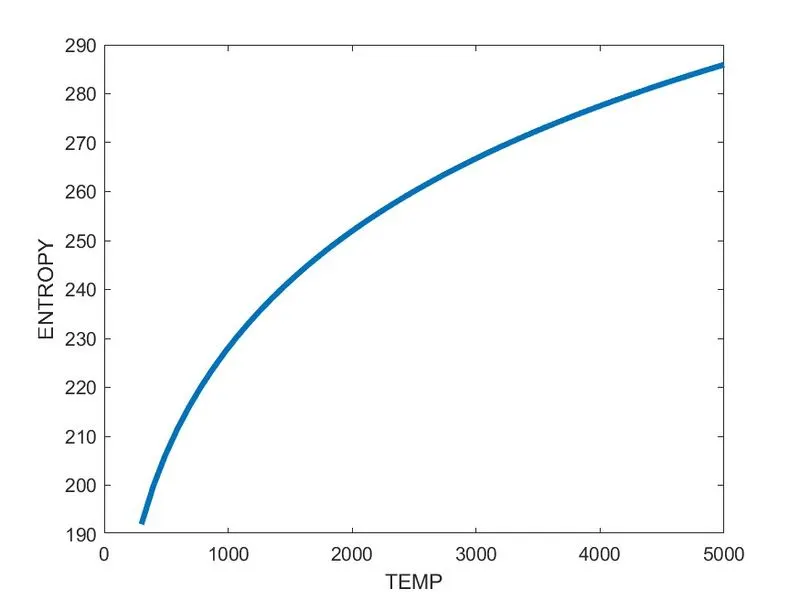
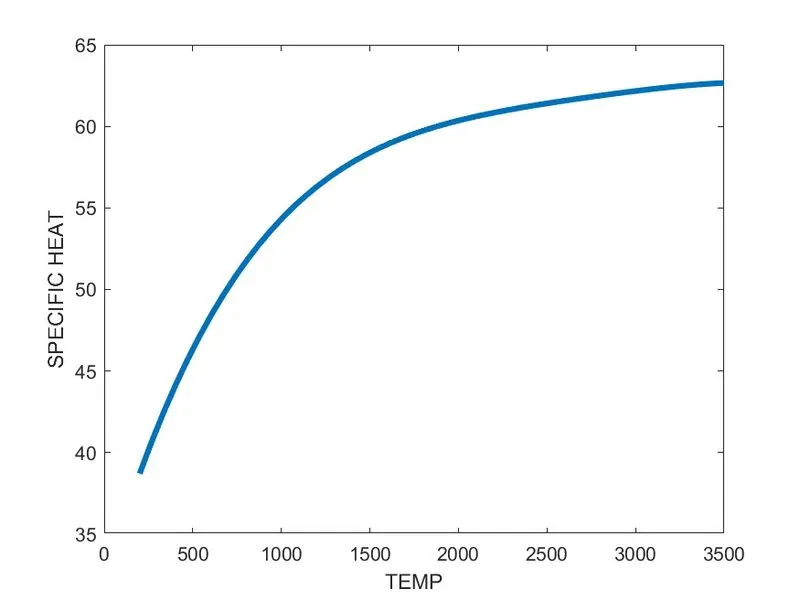
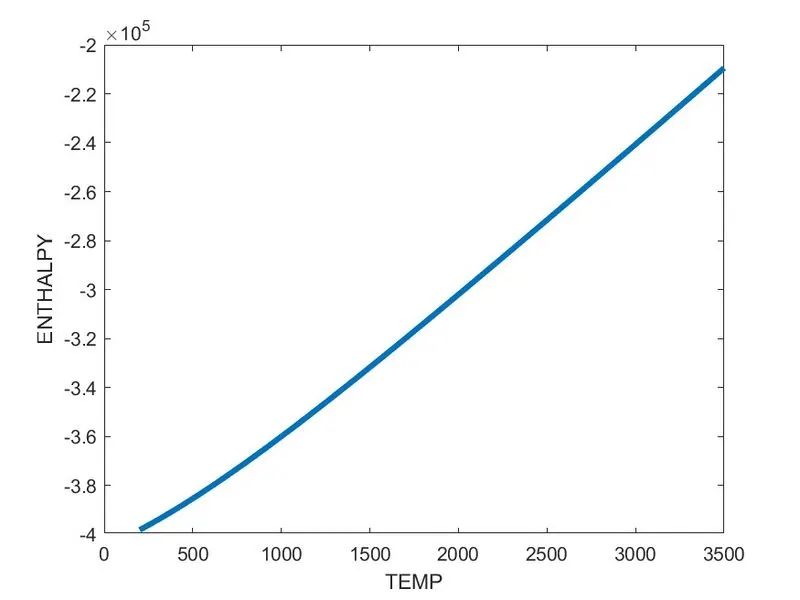
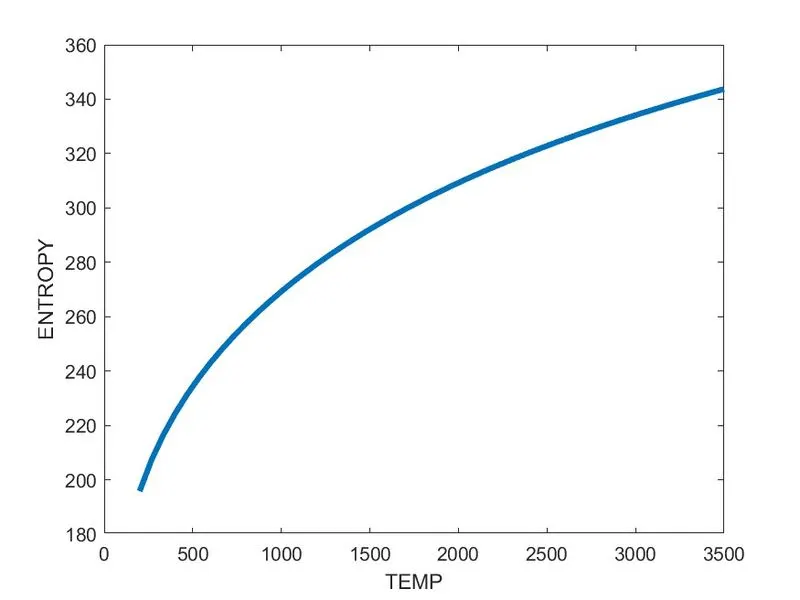
3. CO2
CP vs TEMP
H vs TEMP
S vs TEMP
EXPLAINATION OF OUTPUT
The code is generated to extract the data from Thermo. Dat file and use it for plotting graph for CP Vs T, H vs T, S vs T & saving the JPGs of all graph as per respective species automatically in the desired directory. in the aim it was required to show the graph for O2, N2,& CO2. From above it can be seen that the aim has been achieved.
ERROR INCURRED DURING CODING
1. Used 'ln' instead for 'log' for calculating the natural LOG in the Entropy formula.
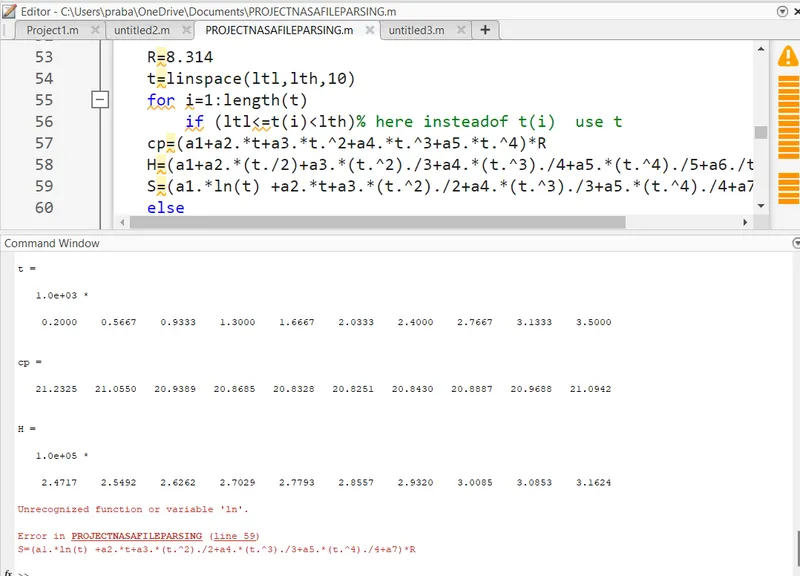
Rectification The mathematical annotaion given in Mathwork. com was refered to correct error.