Project 1 - Parsing NASA thermodynamic data
PROJECT 1 - PARSING NASA THERMODYNAMIC DATA
AIM
To write a code in MATLAB to parse the NASA thermodynamic data file and then calculate the thermodynamic properties for various gas species.
Objective
- Write a function that extracts the 14 coefficients and calculates the enthalpy, entropy and specific heats for all the species in the data file.
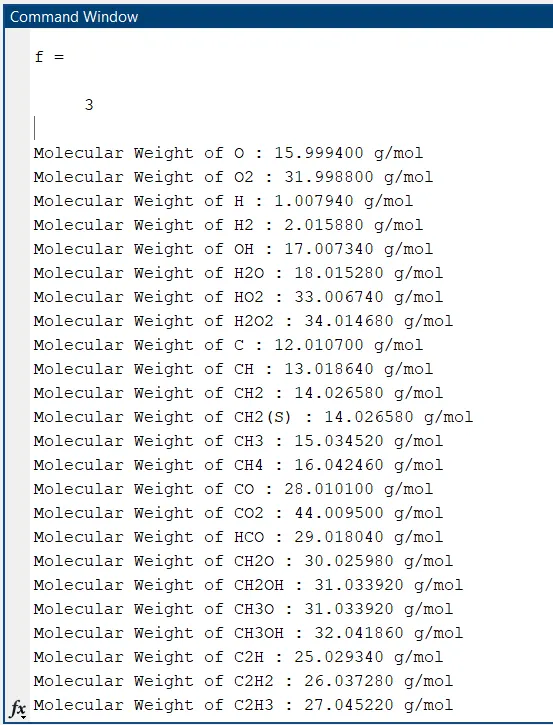
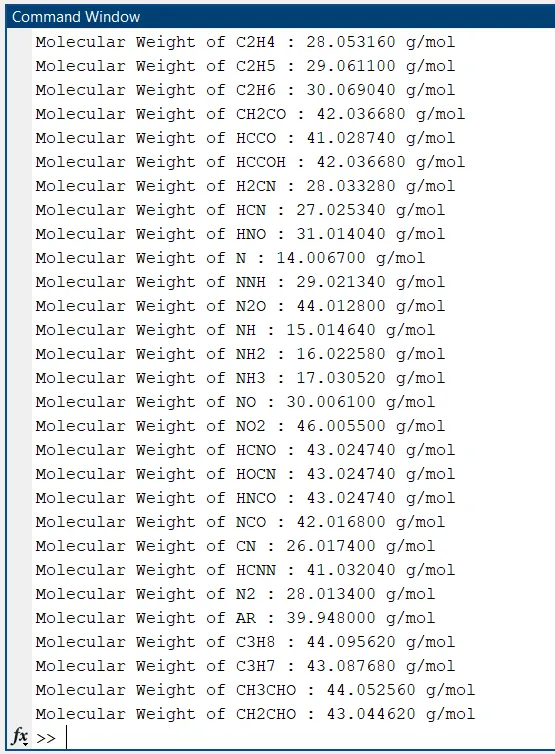
- Calculate the molecular weight of each species and display it in the command window.
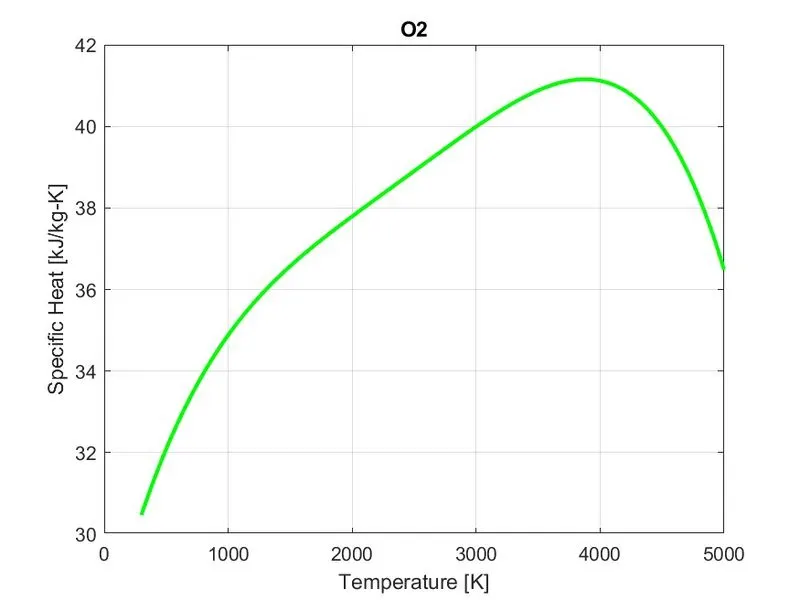
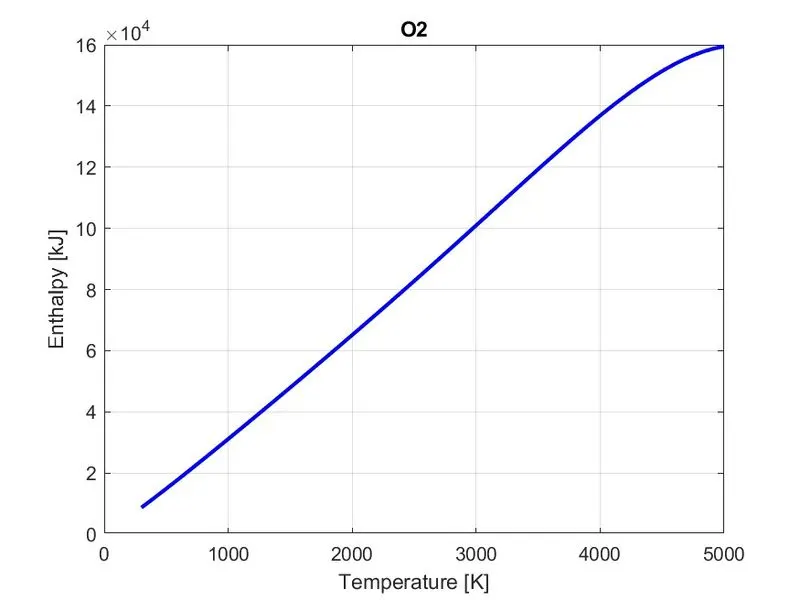
- Plot the Cp, Enthalpy and Entropy for the local temperature range (low temperature : high temperature) specific for each species.
- Save the plots as images with appropriate names and dump them in separate folders for each species with suitable name automatically.
FILE PARSING
Parsing a file means reading in a data stream of some sort and building an in memory model of the semantic content of that data aiming at performing transformation on the data.
NASA Thermodynamic Data
NASA came up with polynomials that can be used to evaluate thermodynamic properties such as Specific Heat [Cp], Enthalpy [H] and Entropy [S]. NASA thermodynamic datafile contains 14 coefficients for 53 different elements for which the properties are calculated. The polynomial have the form as given below:
Here R is the universal gas constant, T is the temperature. The first 7 coefficients are high-temperature coefficients and the second 7 coefficients are low-temperature coefficients.
Thermodynamic properties to evaluate:
- Specific Heat (Cp) : The quantity of heat required to raise the temperature of one gram of a substance by one unit.
- Enthalpy (H) : This property of a thermodynamic system is the sum of the system's internal energy and the product of its pressure and volume.
- Entropy (S) : A measure of the unavailable energy in a closed thermodynamic system that is also usually considered to be a measure of the system's disorder. Broadly it is the degree of disorder or uncertainty in a system.
PROCEDURE
- The thermodynamic data file which is stored in the same path is opened using fopen command and stored in to a variable.
- The global temperature range in the header of the file is read for temperature limits and converted in to string using the fgetl, strsplit and str2num commands respectively.
- To identify the coefficients of the polynomial for each species a for loop is employed ranging to 53 values. A species contains 14 co-effs in 3 lines. Using the fgetl command the species name is derived and stored.
- Then the next line is scanned for the Exponent (E) using the strfind command for the first coefficient and corresponding spaces are added to differentiate remaining species which is also derived using the same method.
- By employing the same to line 2 and 3, all the 14 coefficients are identified.The first seven coefficients are High temperature coefficients and the remaining are low temperature coefficients.
- Assuming Universal gas constant R = 8.314 J/mol-K and temperature range between 100 and 5000, Specific Heat, Enthalpy, Entropy are calculated. Forein, calculations for the thermodynamic properties are defined as separate functions and are later called into the primary code when required.
- The graph between thermodynamic properties and temperature is plotted into three figures and stored for each species in a folder using saveas command. The file directory is defined beforehand using mkdir command.
- Molecular weight of the species is calculated using functions and is displayed in the command window.
Functions Code
1). Specific Heat
Governing Equation : Cp=(a1+a2T+a3T^2+a4T^3+a5T^4)*R
function [Cp] = specific_heat(c1,c2,c3,c4,c5,c8,c9,c10,c11,c12,T,R,global_med_temp);

% for temperature <= global temperature, minimum coefficients are taken
% else maximum coefficients are taken

if T <= global_med_temp
    Cp = (c8 + (c9*T) + (c10*T.^2) + (c11*T.^3) + (c12*T.^4))*R;
else
    Cp = (c1 + (c2*T) + (c3*T.^2) + (c4*T.^3) + (c5*T.^4))*R;

end
2). Enthalpy
Governing Equation : H=(a1+a2T/2+a3T^2/3+a4T^3/4+a5T^4/5+a6/T)*R*T
function [H] = enthalpy(c1,c2,c3,c4,c5,c6,c8,c9,c10,c11,c12,c13,T,R,global_med_temp)

% for temperature <= global temperature, minimum coefficients are taken
% else maximum coefficients are taken

if T <= global_med_temp
    H = R*T.*(c8 + (c9*T/2) + ((c10*T.^2)/2) + ((c11*T.^3)/2) +((c12*T.^4)/2) + (c13./T));
else
    H = R*T.*(c1 + (c2*T/2) + ((c3*T.^2)/2) + ((c4*T.^3)/2) +((c5*T.^4)/2) + (c6./T));

end
3). Entropy
Governing Equation : S =(a1lnT+a2T+a3T^2/2+a4T^3/3+a5T^4/4+a7)*R
function [S] = entropy(c1,c2,c3,c4,c5,c7,c8,c9,c10,c11,c12,c14,T,R,global_med_temp)

% for temperature <= global temperature, minimum coefficients are taken
% else maximum coefficients are taken

if T <= global_med_temp
   S = (c8*log(T) + (c9*T/2) + (c10*T.^2/2) + (c11*T.^3/3) + (c12*T.^4/4) + c14)*R;
else
   S = (c1*log(T) + (c2*T/2) + (c3*T.^2/2) + (c4*T.^3/3) + (c5*T.^4/4) + c7)*R;

end
4). Molecular Weight
Molecular weight is a measure of the sum of the atomic weight values of the atoms in a molecule.
function [MW] = molecular_weight(species);

species1 = upper(species);
elements = ['H','C','N','O','A'];
Atomic_weight = [1.00794 12.0107 14.0067 15.9994 39.948];

MW = 0;
for i = 1:length(species1)
    for j = 1:length(elements)
        if strcmp(species1(i),elements(j))
            MW = MW + Atomic_weight(j);
            u = j;
        end
    end
    n = str2num(species1(i));
    if n>1
        MW = MW + Atomic_weight(u)*(n-1);
    end
end

fprintf('Molecular Weight of %s : %f g/mol\n',species1,MW);

end
PRIMARY CODE
%% NASA THERMODYNAMIC DATA PARSING

clear all
close all
clc

% Making Directory
mkdir('D:\Documents\Data Parsing\Species')

% Reading the thermodynamic datafile
f = fopen('THERMO.dat','r')
gt = fgetl(f);

% Deriving global temperature range
global_temp = fgetl(f);
t = strsplit(global_temp);
global_low_temp = str2num(t{2});
global_med_temp = str2num(t{3});
global_high_temp = str2num(t{4});

% Defining temperature
T = linspace(global_low_temp,global_high_temp,1000);

% Universal Gas Constant
R = 8.314;

% To read the header lines
for i = 1:3
    gt = fgetl(f);
end

% To read the data and identify coefficients
for i = 1:53
    gt = fgetl(f);
    A  = strsplit(gt,' ');
    species = (A{1});

    % The first 7 are High Temperature Coefficients and remaining 7 are Low Temperature Coeficients

    line1 = fgetl(f);
    a = strfind(line1,'E');

    c1 = str2num(line1(1:a(1)+3));
    c2 = str2num(line1(a(1)+4:a(2)+3));
    c3 = str2num(line1(a(2)+4:a(3)+3));
    c4 = str2num(line1(a(3)+4:a(4)+3));
    c5 = str2num(line1(a(4)+4:a(5)+3));

    line2 = fgetl(f);
    b = strfind(line2,'E');

    c6 = str2num(line1(1:b(1)+3));
    c7 = str2num(line1(b(1)+4:b(2)+3));
    c8 = str2num(line2(b(2)+4:b(3)+3));
    c9 = str2num(line2(b(3)+4:b(4)+3));
    c10 = str2num(line2(b(4)+4:b(5)+3));

    line3 = fgetl(f);
    c = strfind(line3,'E');

    c11 = str2num(line3(1:c(1)+3));
    c12 = str2num(line3(c(1)+4:c(2)+3));
    c13 = str2num(line3(c(2)+4:c(3)+3));
    c14 = str2num(line3(c(3)+4:c(4)+3));

    % Calculation of Thermodynamic properties
    % Calculation of Specific Heat [kJ/kg-K]
    Cp = specific_heat(c1,c2,c3,c4,c5,c8,c9,c10,c11,c12,T,R,global_med_temp);

    % Calculation of Enthalpy [kJ]
    H = enthalpy(c1,c2,c3,c4,c5,c6,c8,c9,c10,c11,c12,c13,T,R,global_med_temp);

    % Calculation of Entropy [kJ/kmol-K]
    S = entropy(c1,c2,c3,c4,c5,c7,c8,c9,c10,c11,c12,c14,T,R,global_med_temp);

    % Calculation of molecular weights [g/mol]
    MW = molecular_weight(species);

    % Saving Plots as folder

    current_directory=pwd;
    mkdir(species);
    cd(species);

    % PLOTTING OF VALUES

    % Specific Heat vs Temperature
    figure(1)
    plot(T,Cp,'linewidth',2,'color','g')
    xlabel('Temperature [K]')
    ylabel('Specific Heat [kJ/kg-K]')
    title(species)
    grid on
    saveas(1,'Specific Heat.jpg');

    % Enthalpy vs Temperature
    figure(2)
    plot(T,H,'linewidth',2,'color','b')
    xlabel('Temperature [K]')
    ylabel('Enthalpy [kJ]')
    title(species)
    grid on
    saveas(2,'Enthaply.jpg')

    % Entropy vs Temperature
    figure(3)
    plot(T,S,'linewidth',2,'color','r')
    xlabel('Temperature [K]')
    ylabel('Entropy [kJ/kmol-K]')
    title(species)
    grid on
    saveas(3,'Entropy.jpg')

    cd(current_directory);

end
OUTPUT
1. Molecular weight of gas species displayed in COMMAND WINDOW
2. Screenshot of the window where all the folders are saved.

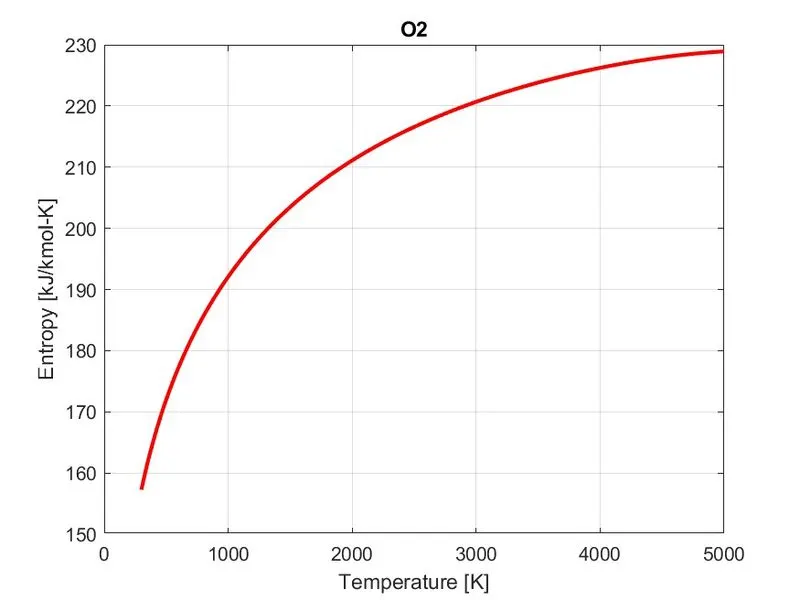
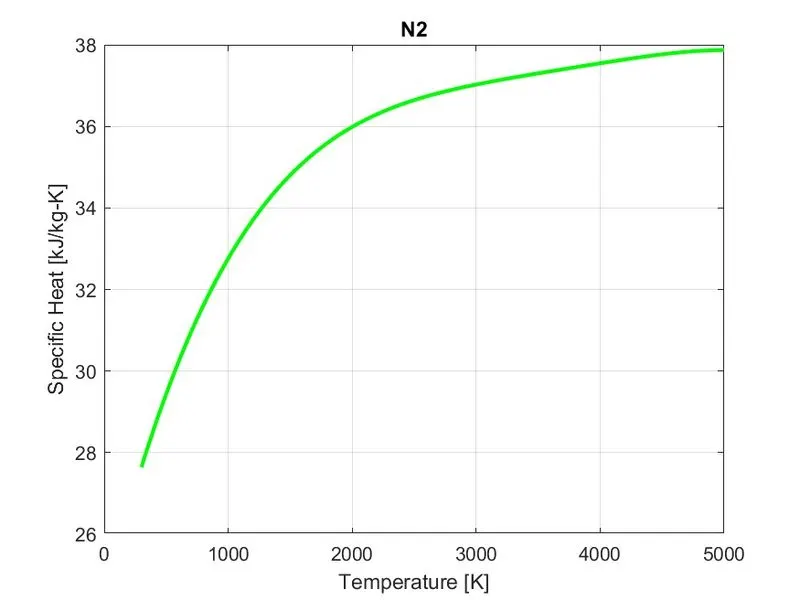
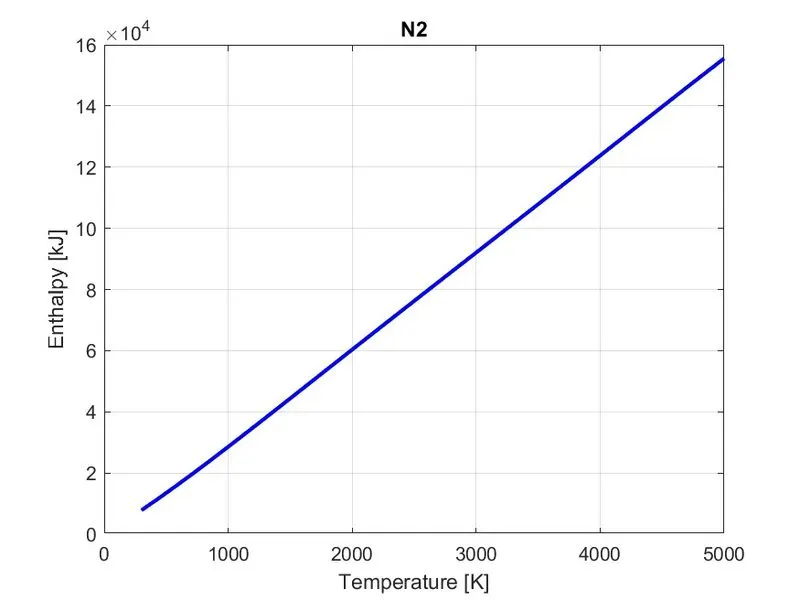
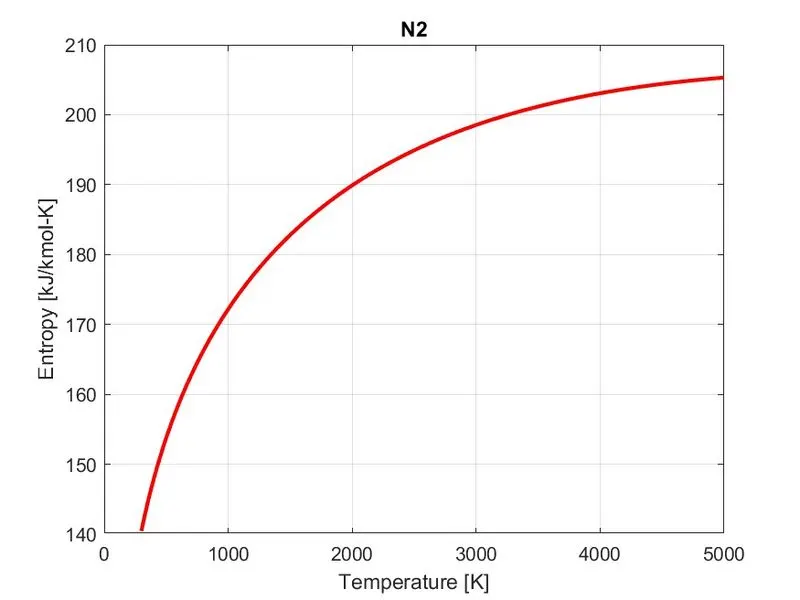
3. Plots for O2, N2 and CO2.
Plots for O2
a) Specific Heat vs Temperature
b) Enthaply vs Temperature
c) Entropy vs Temperature
Plots for N2
a) Specific Heat vs Temperature
b) Enthalpy vs Temperature
c) Entropy vs Temperature
Plots for CO2
a) Specific Heat vs Temperature
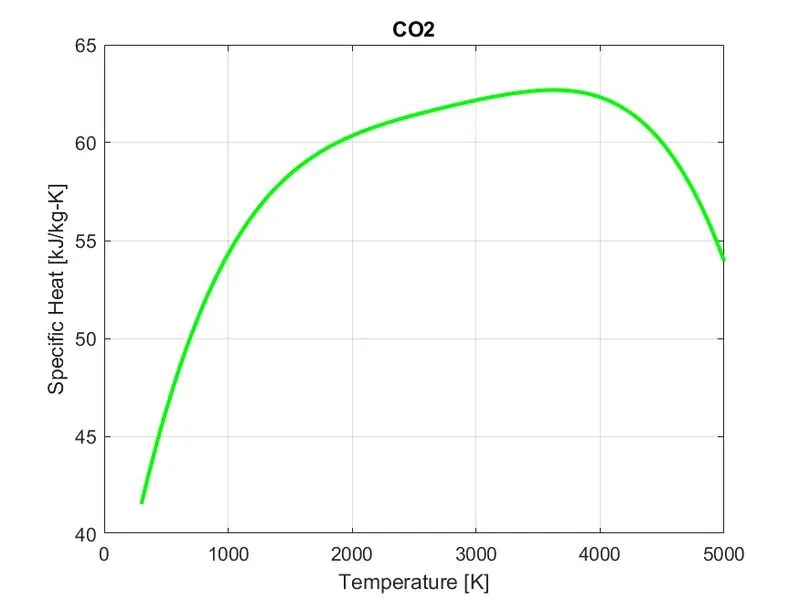
b) Enthalpy vs Temperature
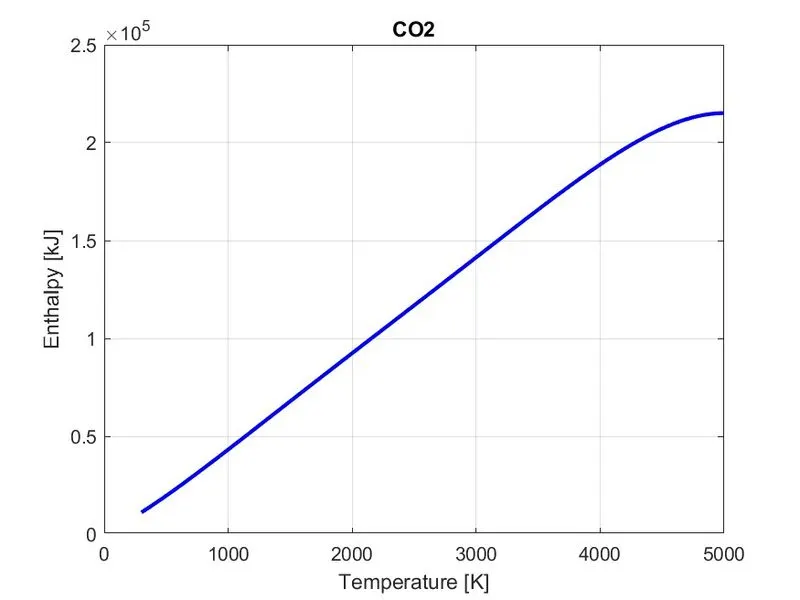
c) Entropy vs Temperature
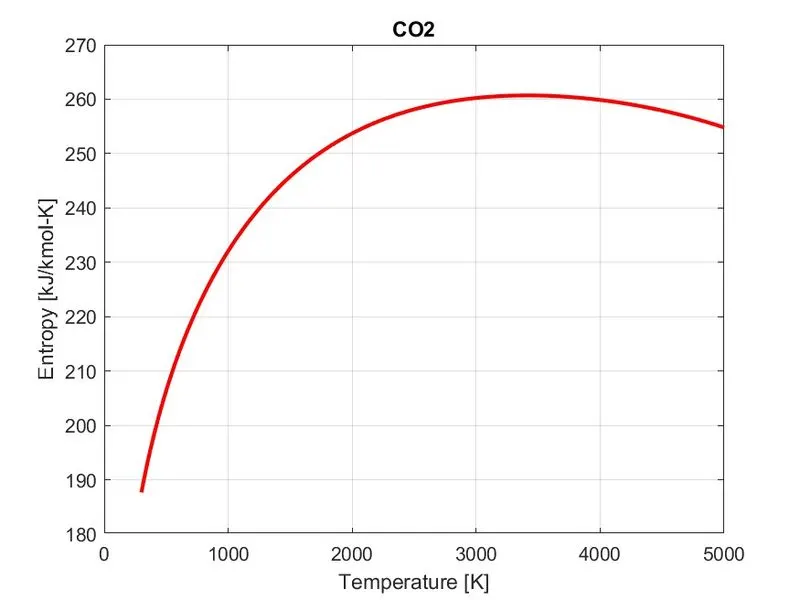
Errors faced and steps taken to overcome
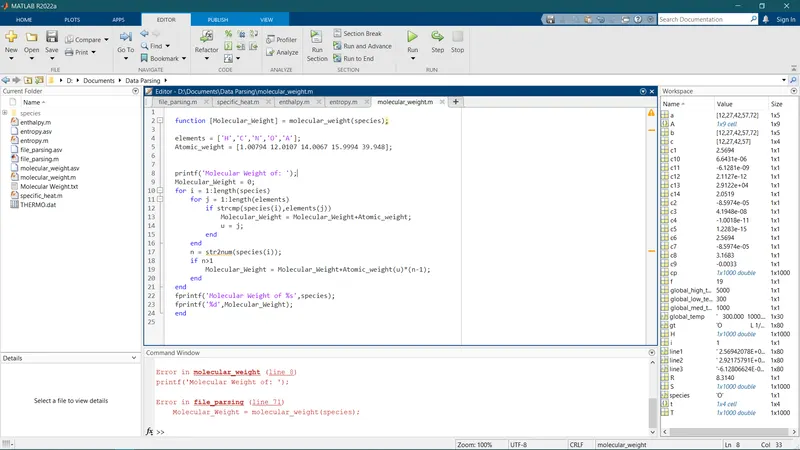
- In the code for function Molecular weight, initially an error was thrown as in the below image. The error was found out to be in the line 13 of code in the image, as the iterant 'j' inside the for loop was not assigned to the variable 'Atomic_weight'. The error was cleared to 'Atomic_weight(j)' .
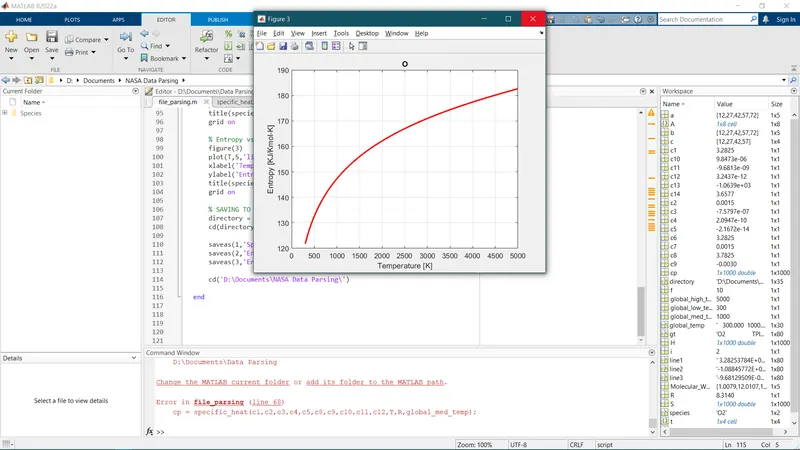
- While running the code, the below shown error appeared, which was later identified as a difference in the coefficients defined for Specific heat (Cp) inside the primary code and the separately defined function for specific heat. The error was rectified by unifying the coefficients.
FOLDER LINK TO SPECIES PROPERTIES PLOT :
REFERENCES
https://www.quora.com/What-does-it-means-to-parse-a-file
https://ntrs.nasa.gov/citations/19940013151
https://in.mathworks.com/help/
https://skill-lync.com/challen%20ges/question/78288/56/337046