Project 1 - Parsing NASA thermodynamic data
1. AIM :
To write a program in MATLAB for paraing NASA thermodynamics data.
2. GOVERNING EQUATIONS :
Specific heat (Cp) :

Enthalpy (H) :

Entropy (S) :

where,
R = Universal gas constant (8.314 J/mol.K)
T = Temperature (K)
The FIRST 7 coefficients are HIGH-temperature coefficients and the SECOND 7 coefficients are LOW-temperature coefficients.
3. OBJECTIVES :
1. To write a function that extracts the 14 coefficients and calculates Specific Heat, Enthalpy and Entropy.
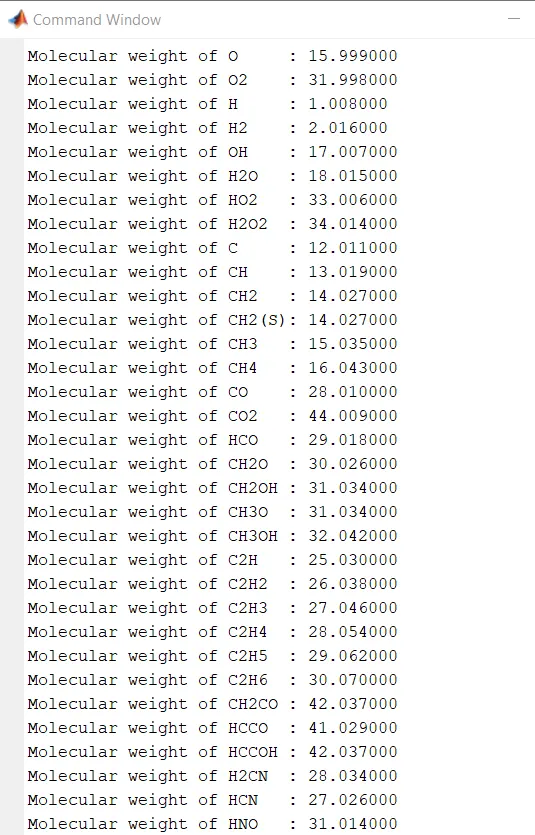
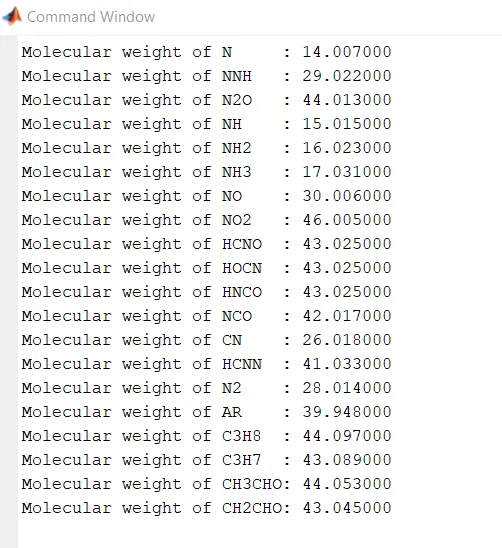
2. To catculate the molecular weight of each species and display it in the command window.
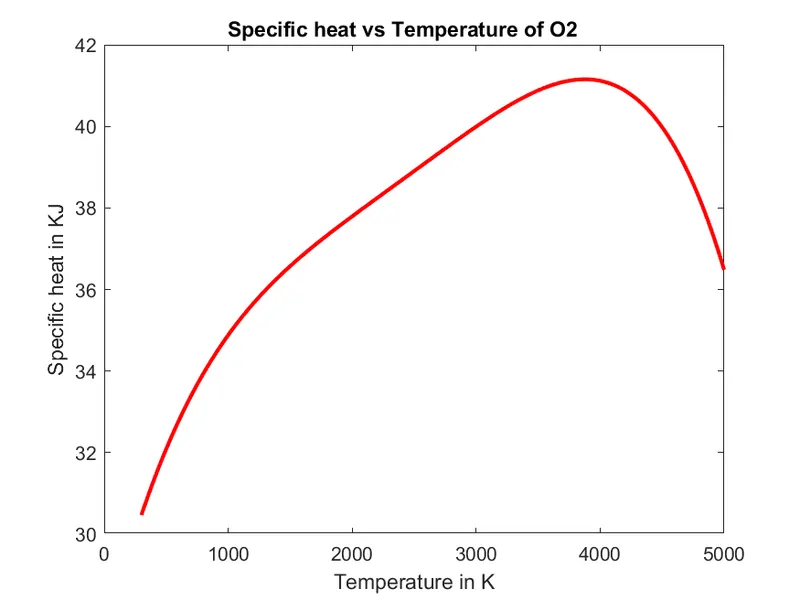
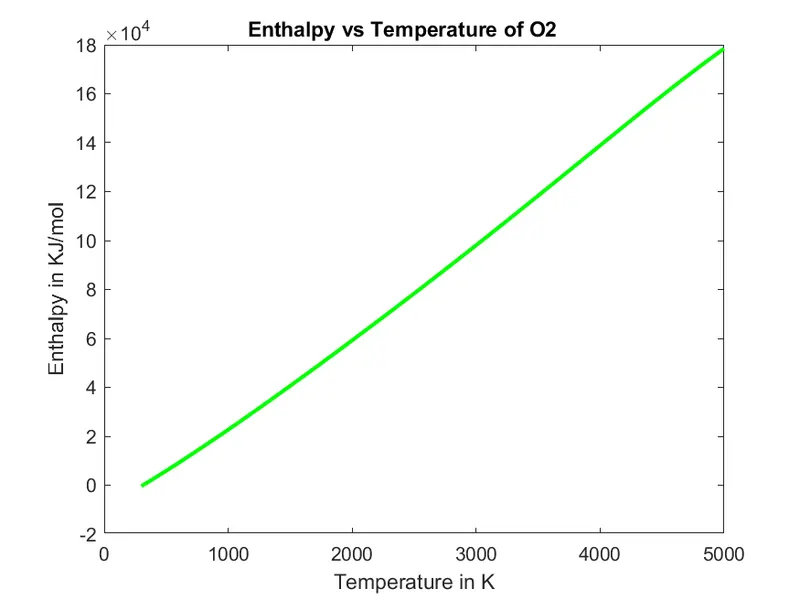
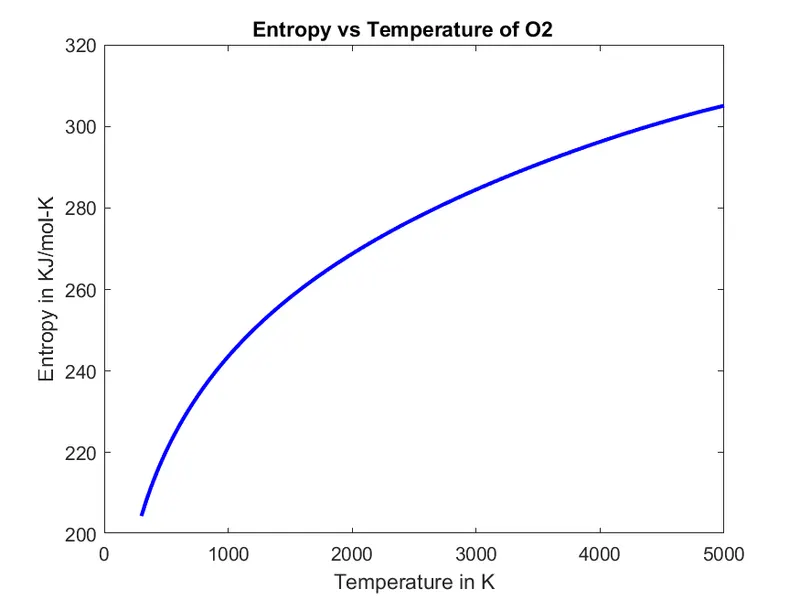
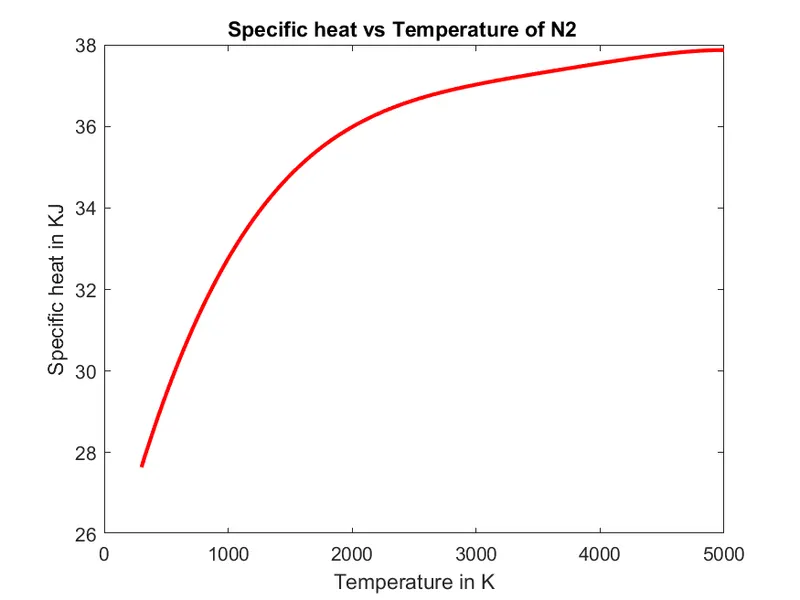
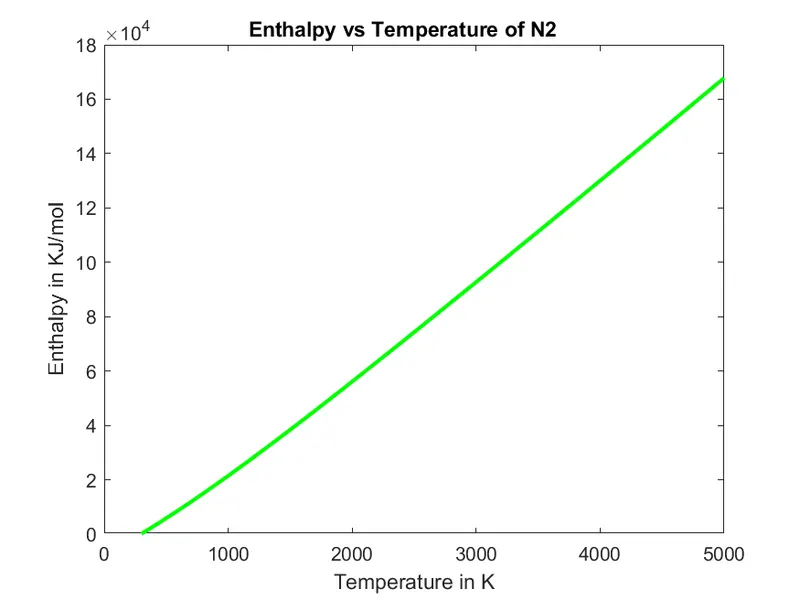
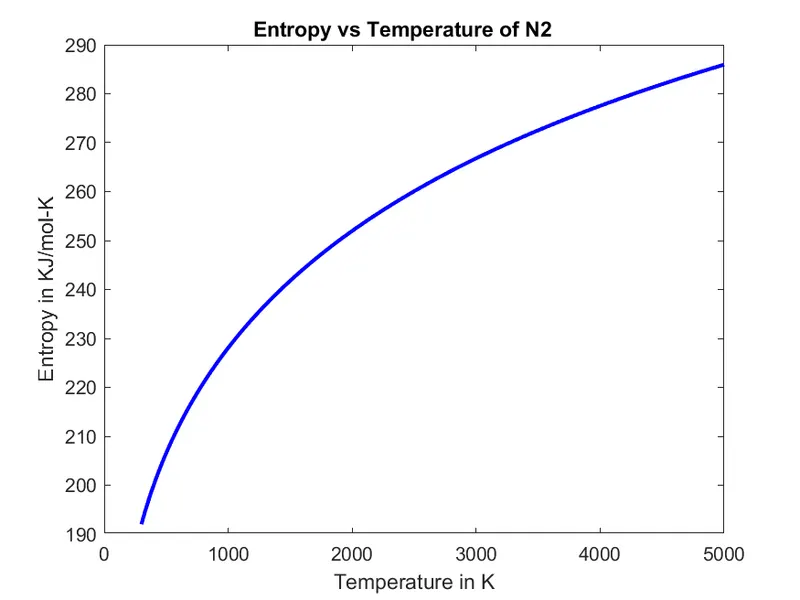
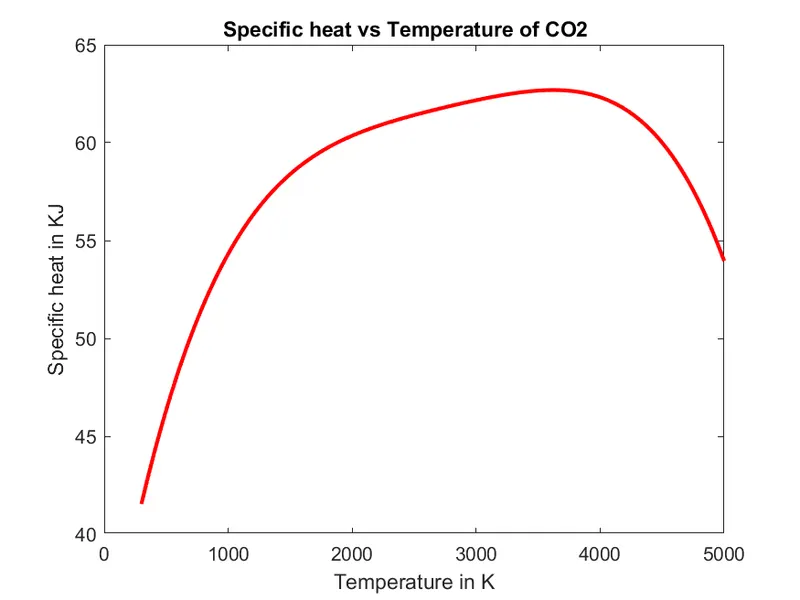
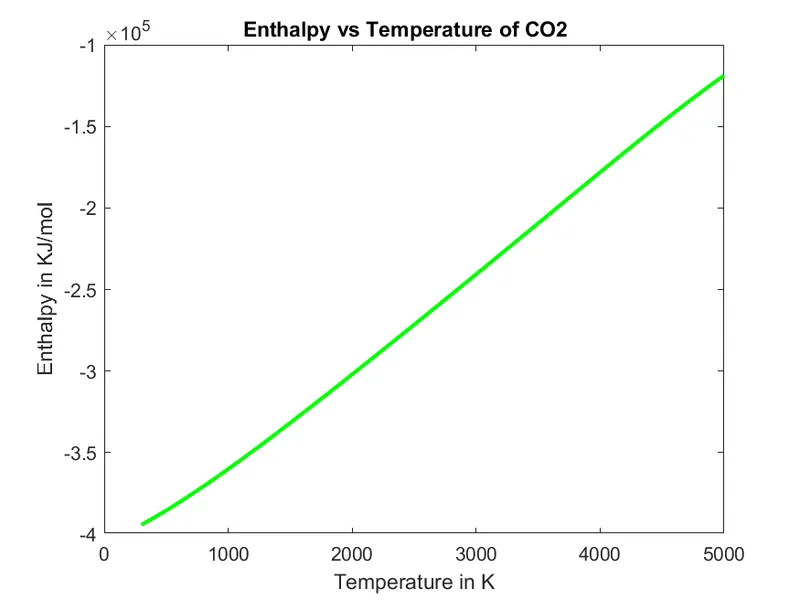
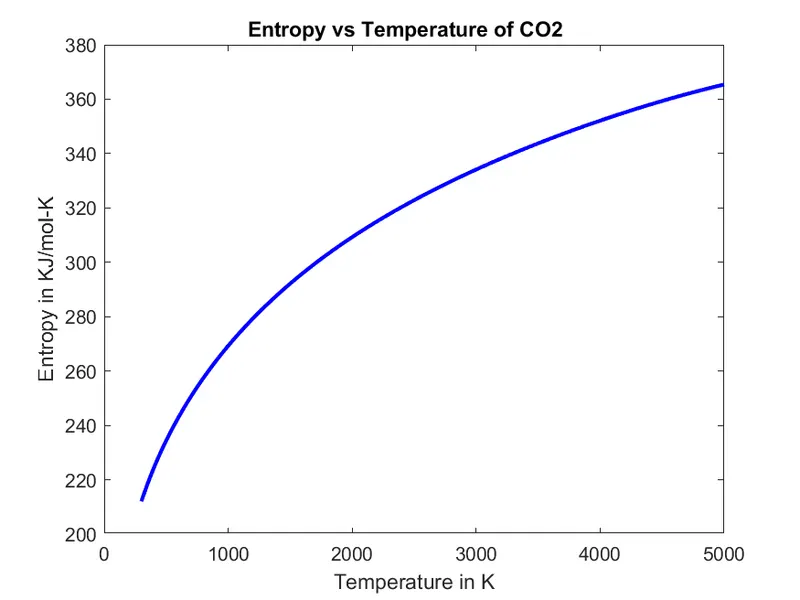
3. Plot the Specific heat, Enthalpy and Entropy with Temperature for each species and save in a separate folder.
4. BODY OF THE CONTENT :
Thermodynamic data for individual species are necessary for performing equilibrium chemistry and finite-rate chemical kinetics calculations. These data typically provide the thermodynamic properties of a species as a function of temperature. The thermodynamic values at different temperatures has been stored by NASA in the form of polynomials with specified constants ranging from one to fourteen for various species. The polynomials that can be used to evaluate thermodynamic properties such as Specific heat, Enthalpy and Entropy.
Parsing is the process of splitting file into pieces of data that can be easily stored or manipulated.so we are spliting string into parts then recoagnizing the part to convert it into something simpler than string.
Thermodynamic properties,
1. Specific Heat:
Specific Heat is a ratio of the quantity of heat required to raise the temperature of a body one degree to that required to raise the temperature of an equal mass of water one degree.
2. Enthalpy:
Enthalpy of a thermodynamic system is defined as the sum of its internal energy and the work required to achieve its presure and volume.
3. Entropy:
Entropy is a property of a thermodynamic system that expresses the direction or outcome of spontaneous changes in the system. It predicts that certain processes are irreversible or impossible, despite not violating the conservation of energy.
CODE :
% To parsing of NASA thermodynamic data
clear all
close all
clc

% To reading the thermodynamic data file
f1 = fopen('THERMO.dat', 'r');

heading = fgetl(f1);
tline = fgetl(f1);

% Global temperature values
global_values = strsplit(tline, ' ');
global_low_temp = str2double(global_values{2});
global_mid_temp = str2double(global_values{3});
global_high_temp = str2double(global_values{4});

% Range of temperature
T = linspace(global_low_temp,global_high_temp,1000);

% Skipping three comment lines in the file
for i = 1:3
    comment = fgetl(f1);
end

% Extracting all species data
for i = 1:53
    species = fgetl(f1);
    species_name = species(1:6);

    % Extracting higher and lower temperature coefficients
    % Extracting first 7 - High temperature coefficient
    line_1 = fgetl(f1);
    a = strfind(line_1,'E');

    a1 = str2double(line_1(1:a(1)+3));
    a2 = str2double(line_1(a(1)+4:a(2)+3));
    a3 = str2double(line_1(a(2)+4:a(3)+3));
    a4 = str2double(line_1(a(3)+4:a(4)+3));
    a5 = str2double(line_1(a(4)+4:a(5)+3));

    line_2 = fgetl(f1);
    b = strfind(line_2,'E');

    a6 = str2double(line_2(1:b(1)+3));
    a7 = str2double(line_2(b(1)+4:b(2)+3));

    % Extracting second 7 - LOW temperature coefficient
    a8 = str2double(line_2(b(2)+4:b(3)+3));
    a9 = str2double(line_2(b(3)+4:b(4)+3));
    a10 = str2double(line_2(b(4)+4:b(5)+3));

     line_3 = fgetl(f1);
    c = strfind(line_3,'E');

    a11 = str2double(line_3(1:c(1)+3));
    a12 = str2double(line_3(c(1)+4:c(2)+3));
    a13 = str2double(line_3(c(2)+4:c(3)+3));
    a14 = str2double(line_3(c(3)+4:c(4)+3));

    % Thermodynamic properties clculation function
    [Cp, H, S] = co_efficient(a1,a2,a3,a4,a5,a6,a7,a8,a9,a10,a11,a12,a13,a14,T,global_mid_temp);

    % Molecular weight calculation function
    [molecular_weight] = weight(species_name);

    % Plotting and saving
    cur_dir = pwd;

    % Making new folder for each species
    mkdir(species_name);
    cd(species_name);

    % Plot 1, Temperature and Specific heat

    figure(1)
    plot(T, Cp,'linewidth',2,'Color','r')
    xlabel('Temperature in K')
    ylabel('Specific heat in KJ')
    title(sprintf('Specific heat vs Temperature of %s',species_name))

    % Saving plot
    saveas(1,'Specific_heat.png')

    % Plot 2, Temperature and Enthalpy
    figure(2)
    plot(T, H,'linewidth',2,'Color','g')
    xlabel('Temperature in K')
    ylabel('Enthalpy in KJ/mol')
    title(sprintf('Enthalpy vs Temperature of %s',species_name))
    saveas(2,'Enthalpy.png')

    % Plot 3, Temperature and Entropy
    figure(3)
    plot(T, S,'linewidth',2,'Color','b')
    xlabel('Temperature in K')
    ylabel('Entropy in KJ/mol-K')
    title(sprintf('Entropy vs Temperature of %s',species_name))
    saveas(3,'Entropy.png')

    cd(cur_dir);

end

fclose(f1)
FUNCTION CODE :
1. Function for calculating thermodynamic properties of each species.
% Thermodynamic properties calculation function
function [Cp, H, S] = co_efficient(a1,a2,a3,a4,a5,a6,a7,a8,a9,a10,a11,a12,a13,a14,T,global_mid_temp)

R = 8.314;
for i = 1:length(T)
    if T(i) >= global_mid_temp

        Cp = (a1 + a2.*T + a3.*T.^2 + a4.*T.^3 + a5.*T.^4).*R;

        H = (a1 + (a2.*T)./2 + (a3.*T.^2)./3 + (a4.*T.^3)./4 + (a5.*T.^4)./5 + (a6./T)).*R.*T;

        S = (a1.*log(T) + a2.*T + (a3.*T.^2)./2 + (a4.*T.^3)./3 + (a5.*T.^4)./4 + a7).*R;

    else

        Cp = (a8 + a9.*T + a10.*T.^2 + a11.*T.^3 + a12.*T.^4).*R;

        H =  (a8 + (a9.*T)./2 + (a10.*T.^2)./3 + (a11.*T.^3)./4 + (a12.*T.^4)./5 + (a13./T)).*R.*T;

        S =  (a8.*log(T) + a9.*T + (a10.*T.^2)./2 + (a11.*T.^3)./3 + (a12.*7.^4)./4 + a14).*R;

    end
end

end
2. Function for calculating molecular weight for each species.
% Molecular weight calculation function
function[molecular_weight] = weight(species_name)

constituents = ['H','C','N','O','A'];
atomic_mass = [1.008 12.011 14.007 15.999 39.948];

% Assign molecular weight is 0
molecular_weight = 0;
for i= 1:length(species_name)
    for j = 1:length(constituents)

        if strcmp(species_name(i),constituents(j))
            molecular_weight = molecular_weight + atomic_mass(j);
            a = j;
        end
    end

    b = str2double(species_name(i));

    if b>1
        molecular_weight = molecular_weight + atomic_mass(a)*(b-1);
    end
end

% Print molecular weight of each species
fprintf('Molecular weight of %s: ',species_name);
fprintf('%f',molecular_weight);
disp(' ');

end
EXPLANATION :
- fopen command used to open a file or obtain information about open file. Reading the text file 'Thermo.dat' file and opening it by using 'fopen' and 'r' as reading command.
- fgetl command used to read line from file.
- strsplit command used to split string or character vector at specified delimiter.
- str2double command which converts the text in string of numerical value in string to double precision value and use {} instead of ().
- strfind command used to find one string within another.
- for loop is initiated because the process is repeated for every species.
- If loop is used because theiris a condition that first 7 coefficient are high temperature coefficient and second 7 coefficient are low temperature coefficient.Hence the function is coded as above.
- linspace command used to generate linearly spaced vectors.
- fprintf command used to write formatted data to file. '%f' command is used to get the floating value of molecular weight of species.
- disp( ) command used to display the values of molecular weight in command window.
- pwd command used to identify current directory.
- mkdir command used to make new directory.
- plot command is used to plotting the values for the temperature and thermodynamic properties.
- label commandis used to label the X & Y axis.
- title command is used to give the title for the plot.
- saveas command is used to save the plot as jpg format.
- cd command used to change working directory.
OUTPUT :
1. Molecular weight of each species, display it in the command window.
2. Specific heat, Enthalpy and Entropy with Temperature.
a) Plots of O2
b) Plots of N2
c) Plots of CO2
3. Screenshot of the window where all the folder are saved.

5. CONCLUSION
The data has been extracted and thermodynamic property such as Specific heat, Enthalpy and Entropy and molecular weight of each species is calculated. Graphs has been plotted and the files of individual species and saved in a separate folder.