Project 1 - Parsing NASA thermodynamic data
AIM OF THE PROJECT
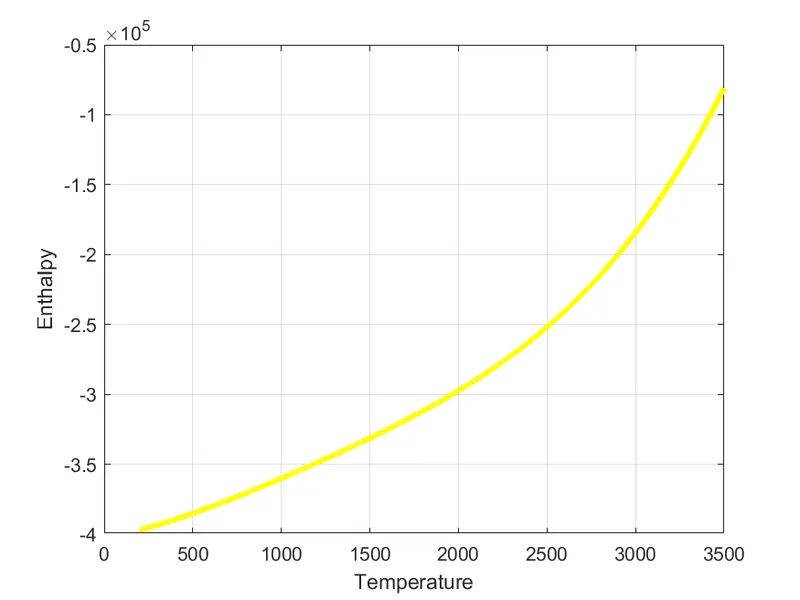
To read 'THERMO.DAT' file and extract data about various gas species from it to plot Cp Vs T , H Vs T, S vs T graph along with calculating the molecular mass of all species
About THERMO.DAT
NASA has given some polynomials that calculate values of some thermodynamic properties such as enthalpy, specific heat and entropy. THERMO.DAT contains the following information in text format
1.Global Temperature range
2. Species name
3.Local temperature range
4. 14 co-effiecients for the polynomials , 7 for high temp, 7 for low temperature
Polynomial -

METHADOLOGY
1- fopen and fgetl
fopen - opens a file using one specifier , here f1 is the specifier
fgetl - It is a command used to read the lines of the file , its index is auto governed by the number of times it appear on the program. It is the widely used through out the logic to reasd the lines of THERMO.DAT file
2-str2num - It is used to convert the string into numbers . It is used to convert temperature and co-efficient strings to numbers .
3.mkdir - It is used to create a folder in the base MATLAB directory
4. cd - It is used to change the current directory to save the file there.
5- Finding the species name -
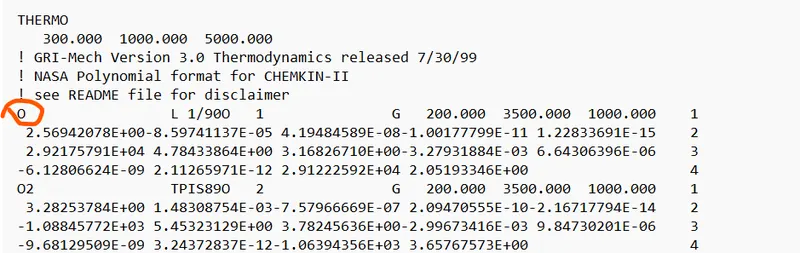
After reading the line containing the species name we saved it as a string and split it by using strsplit() at the ' ' (space charectar)
the 1st element of the string array was the species name
6. Finding the temperature -
After reading the temperature line it was required too find the temp
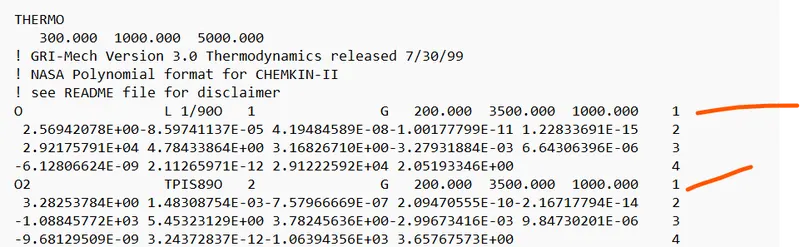
to find the temperature we searched for the '.' and saved the index position in an array
then we created a array by picking 4 charaectars to both left and right of the '.'
7-Finding the co-efficient
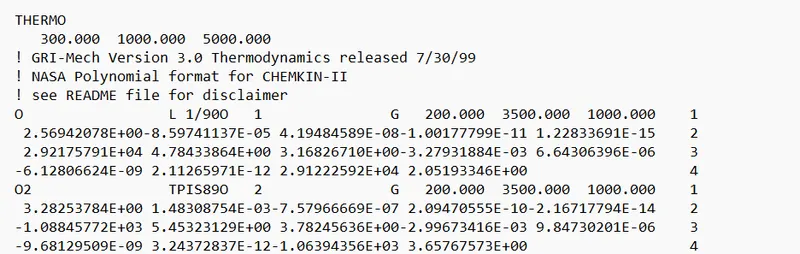
to find the co-efficient we searched for the 'E' and saved the index position in an array
then we created a array by picking 10 charaectars to left and 4 charectars to right of the 'E'.
8- CP , H ,S calculation
To calculate the value of H,S and CP we used 3 functions , as per the requirement the set of co-efiicients to be used was decided on the temperature range
9- Plotting the graphs
CP vs T , H vs T , S vs T all this was done using plot command with three different figures for all plots and different colours
10- Saving the results
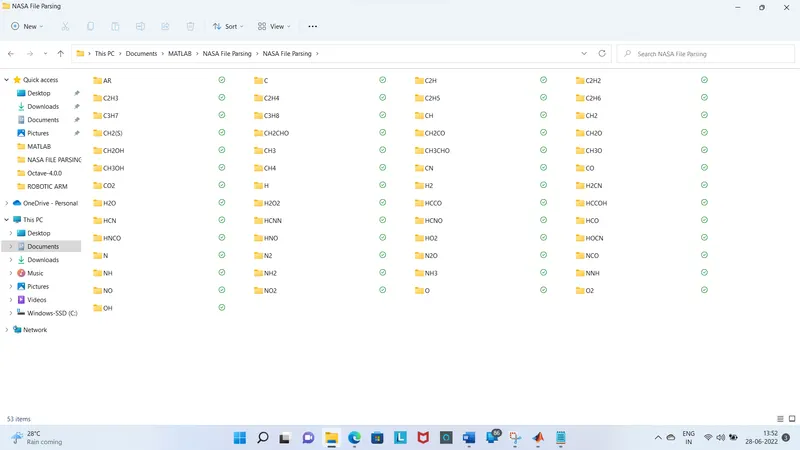
A new folder was created inside the MATLAB root directory . Inside that new folder by the corresponding species name has been created and it contains the graphs seperately.
MAIN CODE
R=8.314;
wt=0;
%open the DAT file
f1= fopen("THERMO (1).dat");
l1= fgetl(f1);
l2=fgetl(f1);
%read the global temperature
t_range=str2num(l2);
global_Temp_low=t_range(1);
global_Temp_mid=t_range(2);
global_Temp_high=t_range(3);
%skip the next 3 lines
for i=1:3
    l=fgetl(f1);
end

%repeating for 53 species
mkdir('NASA File Parsing')
cd("NASA File Parsing")
for i=1:53

%reading info about the species name and local temperature range
l5=fgetl(f1);
x=findstr(l5,'.');
nmm=strsplit(l5,' ');
species_name=nmm{1};

t_low=str2num(l5(x(1)-4:x(1)+3));
t_high=str2num(l5(x(2)-4:x(2)+3));
t_modr=str2num(l5(x(3)-4:x(3)+3));

%reading 1st line of co-efficients
l6=fgetl(f1);
y=strfind(l6,'E');
%extracting 1st 5 co-eeficients
a1=str2num(l6(y(1)-11:y(1)+3));
a2=str2num(l6(y(2)-11:y(2)+3));
a3=str2num(l6(y(3)-11:y(3)+3));
a4=str2num(l6(y(4)-11:y(4)+3));
a5=str2num(l6(y(5)-11:y(5)+3));

l7=fgetl(f1);
z=strfind(l7,'E');
%extracting next 5 co-efficients
a6=str2num(l7(z(1)-11:z(1)+3));
a7=str2num(l7(z(2)-11:z(2)+3));
a8=str2num(l7(z(3)-11:z(3)+3));
a9=str2num(l7(z(4)-11:z(4)+3));
a10=str2num(l7(z(5)-11:z(5)+3));

l8=fgetl(f1);
w=strfind(l8,'E');
%extracting next 4 co-efficients
a11=str2num(l8(w(1)-11:w(1)+3));
a12=str2num(l8(w(2)-11:w(2)+3));
a13=str2num(l8(w(3)-11:w(3)+3));
a14=str2num(l8(w(4)-11:w(4)+3));


T=linspace(t_low,t_high,5000);
cp= CP(a1,a2,a3,a4,a5,a8,a9,a10,a11,a12,T,8.314,global_Temp_mid);
h=H(a1,a2,a3,a4,a5,a6,a8,a9,a10,a11,a12,a13,T,8.314,global_Temp_mid);
s=S(a1,a2,a3,a4,a5,a7,a8,a9,a10,a11,a12,a14,T,8.314,global_Temp_mid);
%dispalying name and molecular weight
species_name
W=molecular_weight(species_name)
%creating a new file within the matlab folder
mkdir('NASA File Parsing')
cd("NASA File Parsing")
mkdir(species_name);   %create the directory within 'NASA file Parshing'
cd(species_name);
figure(1)
plot(T,cp,'linewidth',3,'Color','b')
grid on
xlabel('Temperature');
ylabel('Specific heat')
saveas(figure(1),'Specific_heat.png')
%saving 1st figure
figure(2)
plot(T,h,'linewidth',3,'Color','y')
grid on
xlabel('Temperature');
ylabel('Enthalpy')
saveas(figure(2),'enthalpy.png')
%saving 2nd figure
figure(3)
plot(T,s,'linewidth',3,'Color','r')
grid on
xlabel('Temperature');
ylabel('Entropy')
saveas(figure(3),'entropy.png')
%saving 3rd figure

cd('C:\Users\sukri\OneDrive\Documents\MATLAB\NASA File Parsing')
%coming back to base directory for new forlder
end
FUNCTION FOR SPECIFIC HEAT (CP)
function [cp] = CP (a1,a2,a3,a4,a5,a8,a9,a10,a11,a12,Temp,R,global_Temp_mid)

if(Temp<global_Temp_mid)
cp=R.*(a1+(a2.*Temp)+(a3.*Temp.^2)+(a4.*Temp.^3)+(a5.*Temp.^4));
else
 cp=R.*(a8+(a9.*Temp)+(a10.*Temp.^2)+(a11.*Temp.^3)+(a12.*Temp.^4));
end
FUNCTION FOR ENTHALPY (H)
function [H] = H(a1,a2,a3,a4,a5,a6,a8,a9,a10,a11,a12,a13,Temp,R,global_Temp_mid)

if (Temp<global_Temp_mid)
H= (a1+ (a2.*Temp)/2 + (a3.*Temp.^2)/3 + (a4.*Temp.^3)/4+(a5.*Temp.^4)/5+(a6./Temp))*R.*Temp;
else
H= (a8+ (a9.*Temp)/2 + (a10.*Temp.^2)/3 + (a11.*Temp.^3)/4+(a12.*Temp.^4)/5+(a13./Temp))*R.*Temp;
end
FUNCTION FOR ENTROPY (S)
function [s] = S(a1,a2,a3,a4,a5,a7,a8,a9,a10,a11,a12,a14,Temp,R,global_Temp_mid)
if (Temp<global_Temp_mid)
 s= (a1.*log(Temp)+(a2.*Temp)+(a3.*Temp.^2)/2+(a4.*Temp.^3)/3+(a5.*Temp.^4)+a7)*R;
else
 s= (a8.*log(Temp)+(a9.*Temp)+(a10.*Temp.^2)/2+(a11.*Temp.^3)/3+(a12.*Temp.^4)+a14)*R;
end
FUNCTION FOR WEIGHT CALCULATION
function [W] = molecular_weight (species_name)
Element_name=['C' 'O' 'H' 'N' 'A' 'S'];
Element_mass=[12 16 1 14 40 32 ];

W=0;

for i=1:length(species_name)
    for j=1:length(Element_name)
        if(species_name(i)==Element_name(j))
            W=W+Element_mass(j);
            position=j;
        end
    end
       n=str2double(species_name(i));
       if(n>1)
          W=((Element_mass(position))*(n-1))+W;

       end
    end

end
FOLDER CONTAING ALL THE SPECIES WISE FOLDER
H,S , CP vs T graph for O2
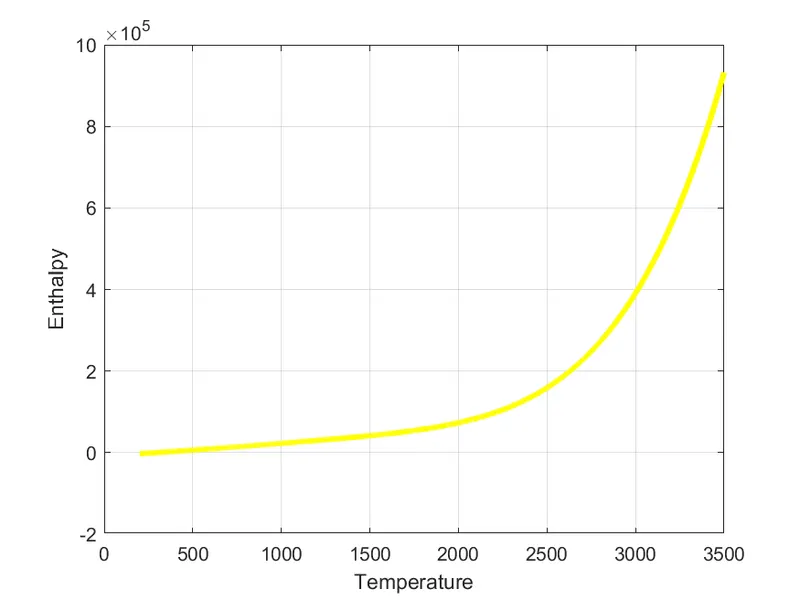
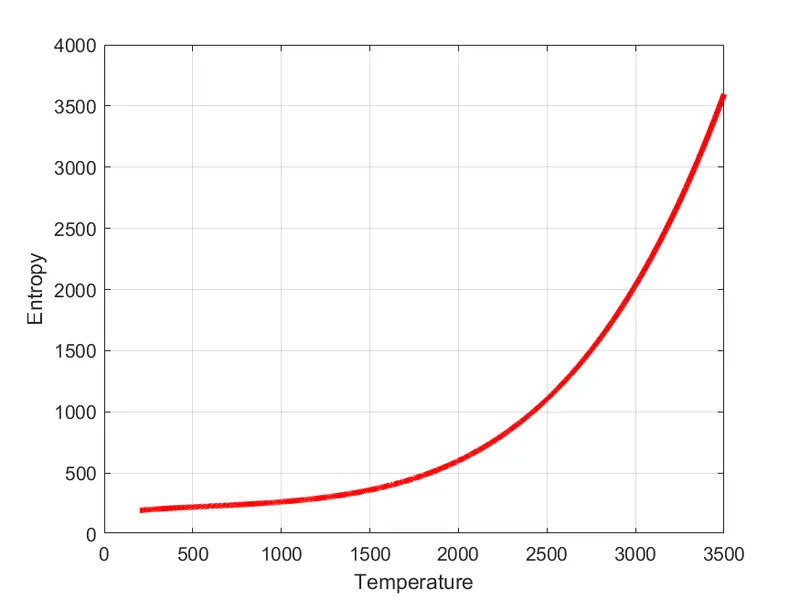
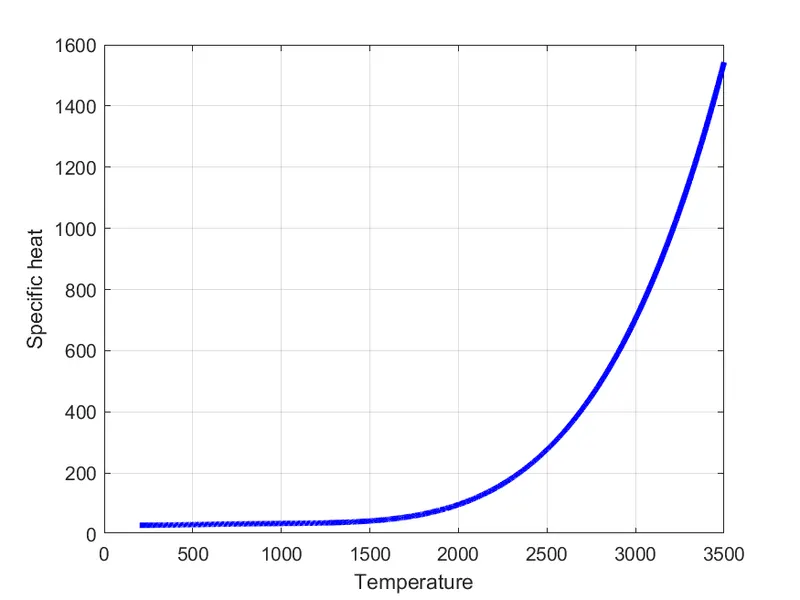
H,S , CP vs T graph for CO2
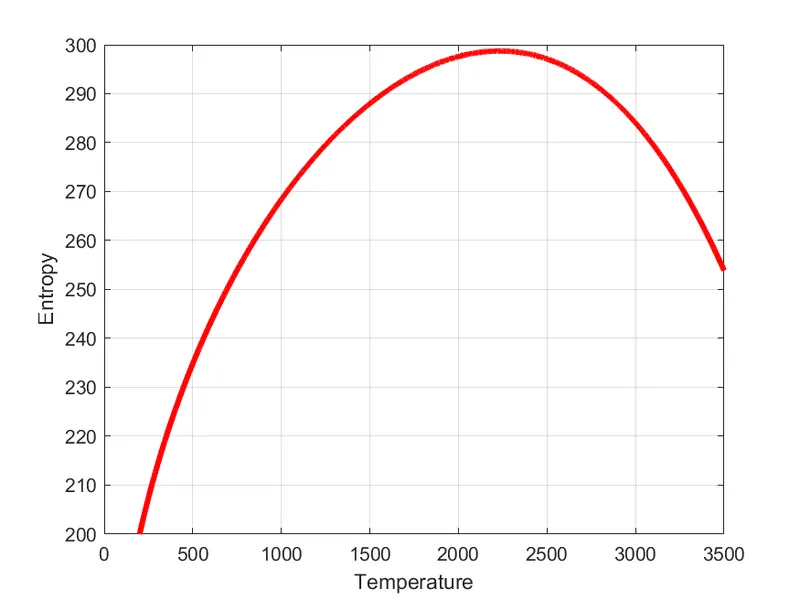
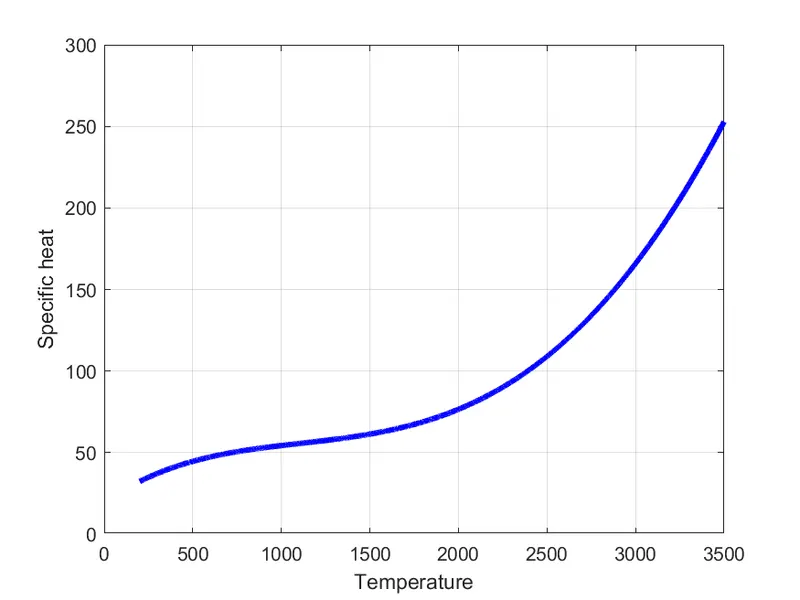
H,S , CP vs T graph for N2
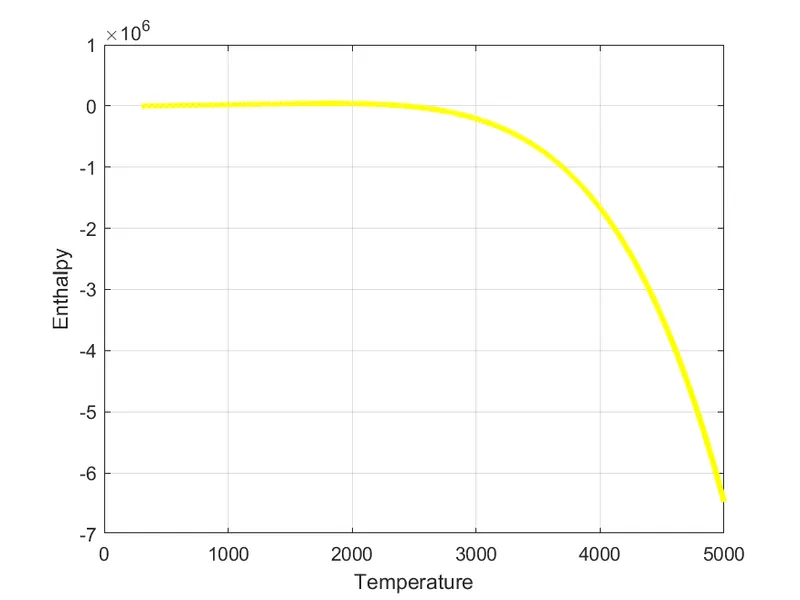
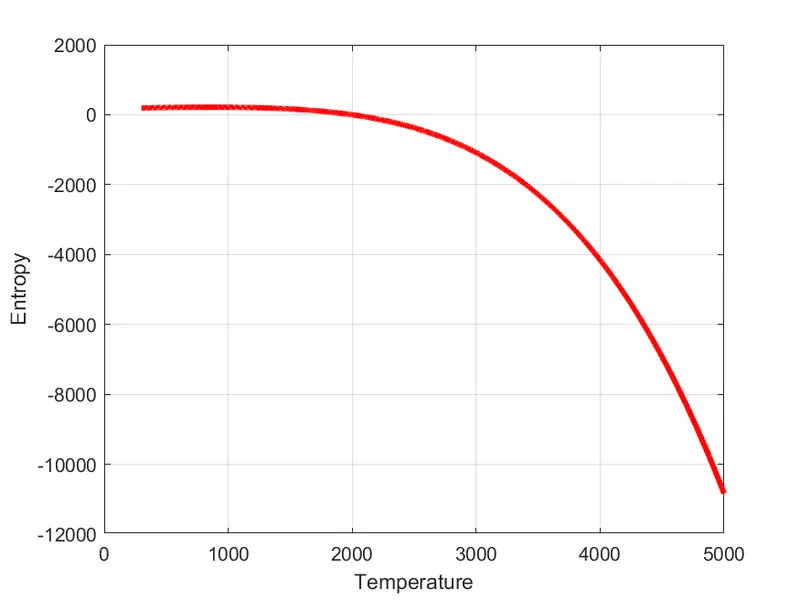
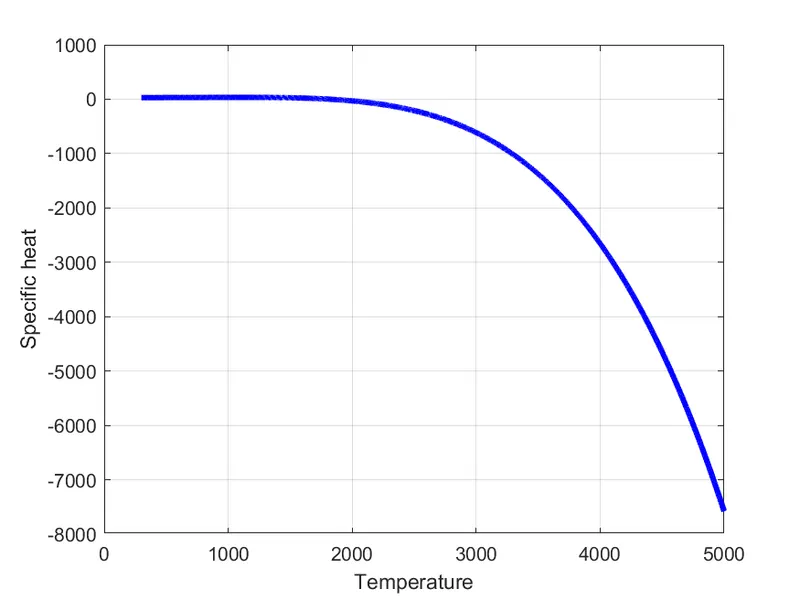
ERROR OCCURED
While calclating the value of the molecular weight the loop closing was placed at the wrong positon which was giving errorous results in weight calculation
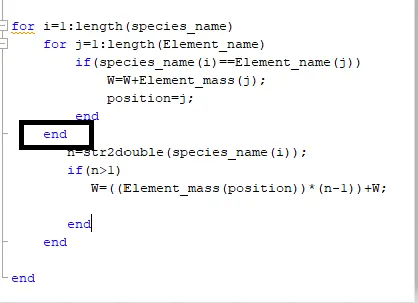
Corrective measure - removing the end statement