Project 1 - Parsing NASA thermodynamic data
NASA came up with polynomials that can be used to evaluate thermodynamic properties such as Cp, H and S.They have also documented the co-efficient that are required to evaluate these polynomials for 1000+ species.
To guide you we have broken down the problem into meaningful bits that you can work on individually.
1.Write a function that extracts the 14 co-efficient and calculates the enthalpy, entropy and specific heats for all the species in the data file. You will be reading this file NASA thermodynamic data(Tip:use fopen and fgetl). The formulae are shown below.
Here R is the universal gas constant, T is the temperature
Answers:
Functions to find specific heat:-
% specific heat calculations functions
function Cp = specific_heat (a1,a2,a3,a4,a5,a6,a7,a8,a9,a10,a11,a12,T,R,tempmid)
%calculating specific heat for higher and lower temperature respectively.
if (T <= tempmid)
Cp = R*(a8+ (a9*T) + (a10*(T).^2) + (a11*(T).^3) + (a12*(T).^4);
else
Cp = R*(a1+ (a2*T) + (a3*(T).^2) + (a4*(T).^3) + (a5*(T).^4);
end
end
Functions to find entropy:-
% entropy calculation function
functions s = entropy (a1,a2,a3,a4,a5,a6,a7,a8,a9,a10,a11,a12,a14,T,R,tempmid)
%calculating entropy for higher and lower temperature respectively
if (T <= tempmid)
s = R*(a8.log(T) + (a9*T) + ((a10*(T).^2)/2) + ((a11*(T).^3)/3)+ ((a12*(T).^4)/4) + a14);
else
s = R*(a1.*log (T) + (a2*T) + ((a3*(T).^2)/2) + ((a4*(T).^3)/3)+ ((a5*(T).^4)/4) + a7);
end
end
Functions to find enthalpy:-
% enthalpy calculation function
functions H = enthalpy (a1,a2,a3,a4,a5,a6,a7,a8,a9,a10,a11,a12,a13,T,R,tempmid)
%calculating enthalpy for higher and lower temperature respectively
if (T <= tempmid)
H = R*T.*(a8.log(T) + ((a9*T)/2) + ((a10*(T).^2)/3) + ((a11*(T).^3)/4)+ ((a12*(T).^4)/5) + ((a13./T)));
else
H = R*T.*(a1+ ((a2*T)/2) + ((a3*(T).^2)/3) + ((a4*(T).^3)/4)+ ((a5*(T).^4)/5) + ((a6./T)));
end
end
Function to find molecular weight of different species:-
% Molecular weight calculation function
function MW = Molecular_weight (species)
% defining atomic name of the species
Atomic_name = ['H' , 'C' , 'O' , 'N , 'Ar' ];
% Hydrogen , Carbon , Oxygen , Nitrogen , Argon
% Defining Atomic masses of main species
atomic_weight = [1.008 12.001 15.999 14.007 39.948];
MW = 0;
% Molecular weight starting range
%Adding Atomic number to obtain particular value
for i=1:length(species)
%loop runs to the length of the species
for j=1:length (atomic_name)
%loop runs to the length of the atomic name
if strcmp (species (i) , atomic_name (j)) %function to compare 2 strings
MW = MW + Atomic_weight(j);
position = j;
end
end
n = str2num(species); % Finding more elements in the species and incrementing atomic weight of species
if n>1
MN = MN + atomic_weight (position)*(n-1);
end
end
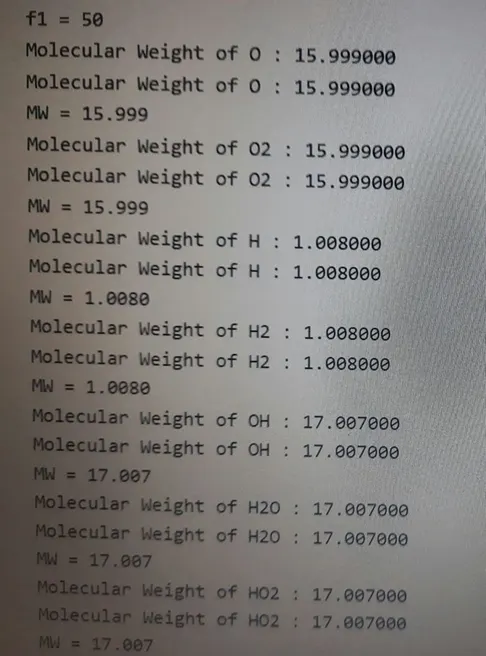
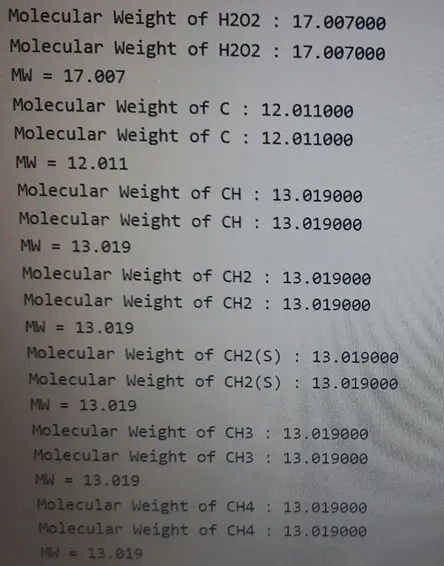
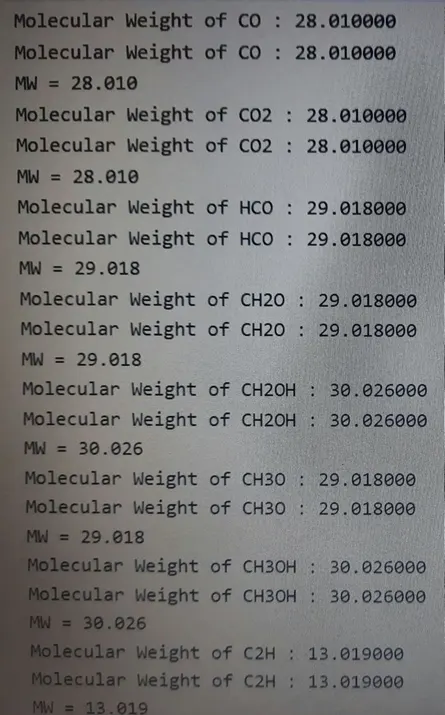
fprintf('Molecular weight of %s : ',species);
disp(' ');
end
MAIN CODE:-
clear all
close all
clc
% Input
R = 8.314; %Gas Constant (J/(mol-k))
% Reading data file
%Open and read THERMO.dat file
f1 = fopen('THERmo.dat' , 'r')
get = fgetl(f1);
% NOW reading Temperature from this file
temp = fgetl(f1);
% Splitting
s = strsplit (temp);
%Converting strings cells into numbers
templow = str2num (s{2});
tempmid = str2num (s{3});
temphigh = str2num (s{4});
% Temperature Range
T = linspace (templow,temphigh,1000);
% skipping Comment lines
for i=1:3
get = fget(f1);
endfor
% Reading the Species
for j = 1:53
tline = fgetl(f1);
A = strsplit (tline, ' '); % Splitting cell into array
species = (A {1}); % To read the name of the species
% Converting strings cells into numbers
lowtemp = str2num(A{end-3});
lowtemp = str2num(A{end-2});
lowtemp = str2num(A{end-1});
tline1 = fgetl(f1); %getting next line
a = strfind(tline, 'E'); % Finding the string E
% Finding first 7 higher and second & lower coefficients
% Finding the Higher coefficients
a1 = tline(1:a(1)+3);
a1 = str2num(a1);
a2 = tline(a(1)+4:a(2)+3);
a2 = str2num(a2);
a3 = tline(a(2)+4:a(3)+3);
a3 = str2num(a3);
a4 = tline(a(3)+4:a(4)+3);
a4 = str2num(a4);
a5 = tline(a(4)+4:a(5)+3);
a5 = str2num(a5);
tline2 = fgetl(f1);
b = strfind (tline2, 'E');
a6 = tline(1:b(1)+3);
a6 = str2num(a6);
a7 = tline(b(1)+4:b(2)+3);
a7 = str2num(a7);
% Finding the Lower coefficients
a8 = tline(b(2)+4:b(3)+3);
a8 = str2num(a8);
a9 = tline(b(3)+4:b(4)+3);
a9 = str2num(a9);
a10 = tline(b(4)+4:b(5)+3);
a10 = str2num(a10);
tline3 = fgetl(f1);
c = strfind (tline3 , 'E');
a11 = tline(1:c(1)+3);
a11 = str2num(a11);
a12 = tline(c(1)+4:c(2)+3);
a12 = str2num(a12);
a13 = tline(c(2)+4:c(3)+3);
a13 = str2num(a13);
a14 = tline(c(3)+4:c(4)+3);
a14 = str2num(a14);
% calculate specific heat
Cp = specific_heat (a1,a2,a3,a4,a5,a8,a9,a10,a11,a12,T,R,tempmid);
% calculate Entropy
S = Entropy(a1,a2,a3,a4,a5,a7,a8,a9,a10,a11,a12,a14,T,R,tempmid);
% calculate Enthalpy
M = Enthalpy(a1,a2,a3,a4,a5,a6,a8,a9,a10,a11,a12,a13,T,R,tempmid);
%calculate Molecular weight of the species
MW = Molecular_weight (species);
% writing molecular weight file
MW_file = fopen('Molecular Weight.txt','w');
fprintf(MW_file, 'Molecular weight of %s is %d ',species,MW);
fclose(MW_file); % closing the file
% Plotting Cp, H & S with temperature
% saving in a folder
cd ('c:/users/karth/week4 Test2/species') %changing directory
mkdir(species); %creating directory
cd(species);
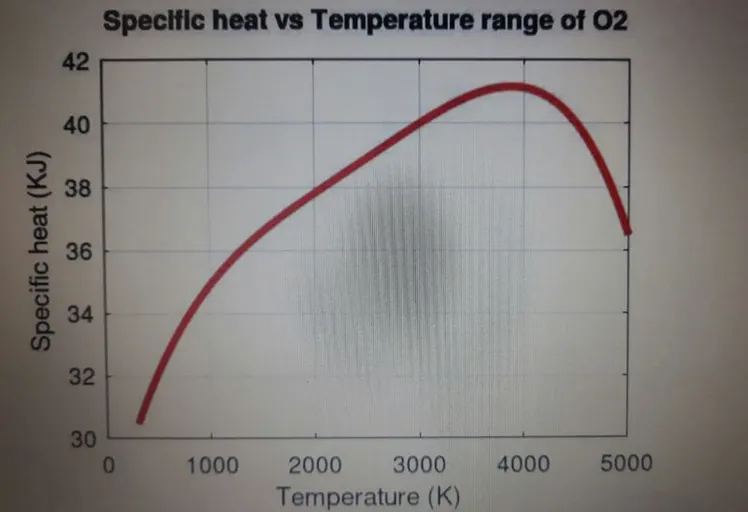
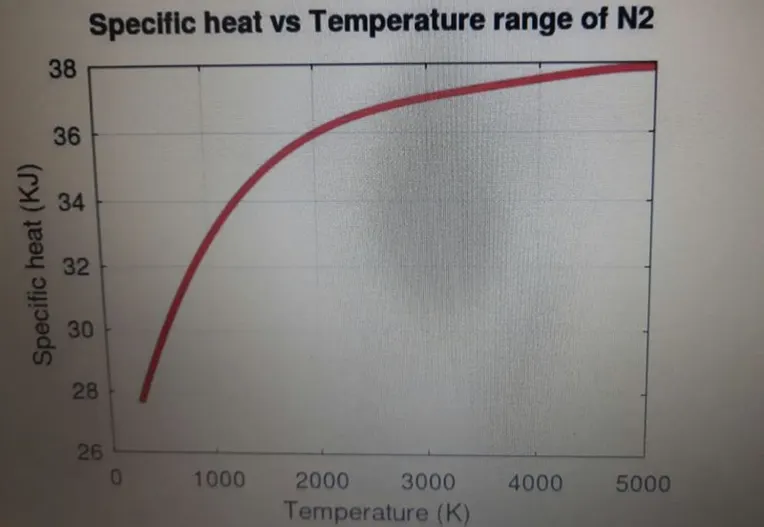
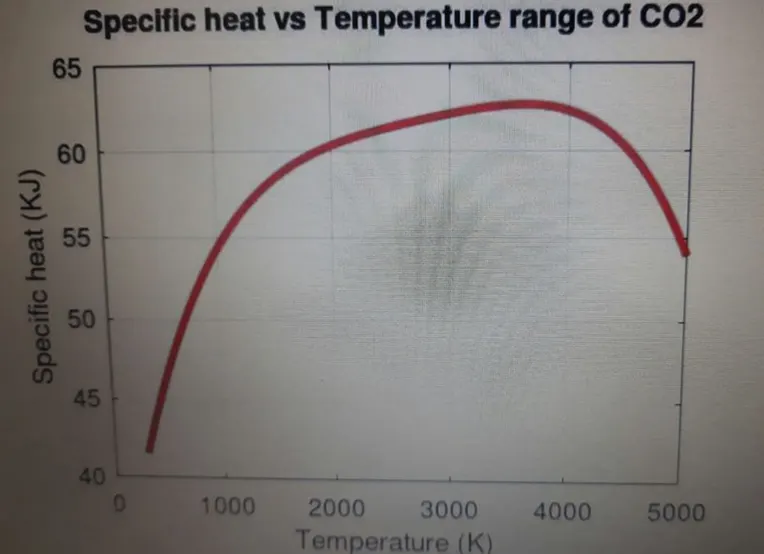
%plot 1 | Cp vs T
figure(1)
plot(T,Cp,'linwidth',3,'color','r');
xlabel('Temperature (K)');
ylabel('specific heat (KJ)');
title (sprintf( 'specific heat vs Temperature range of %s', species));
grid on
saveas(figure(1),'Specific Heat.jpg');
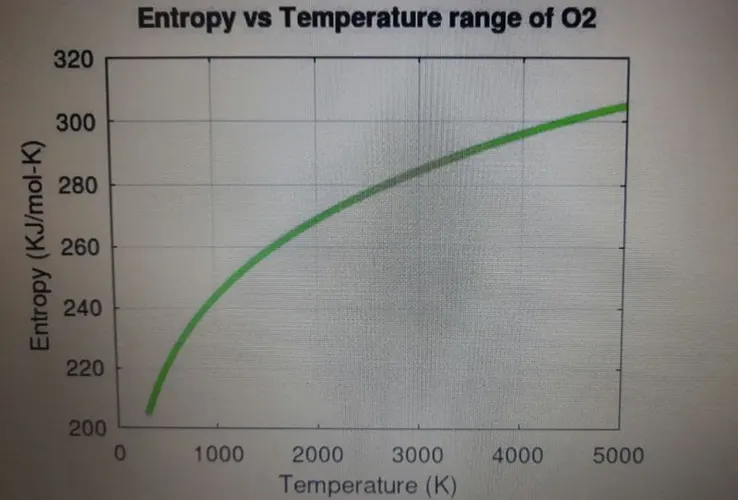
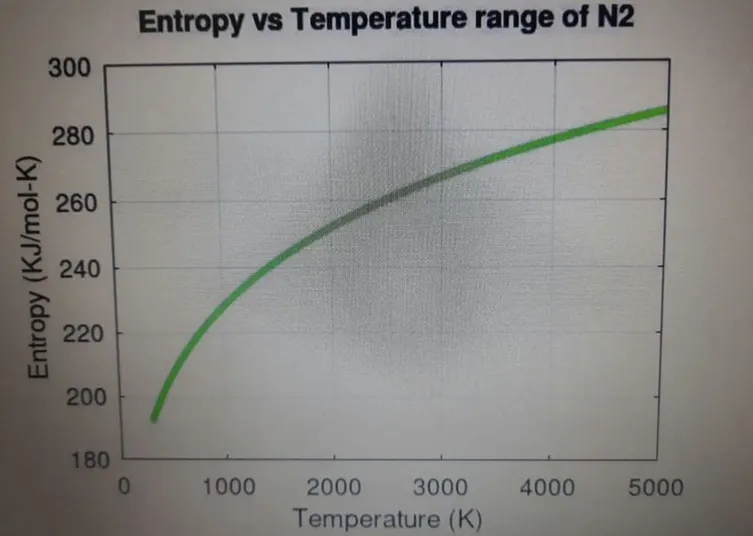
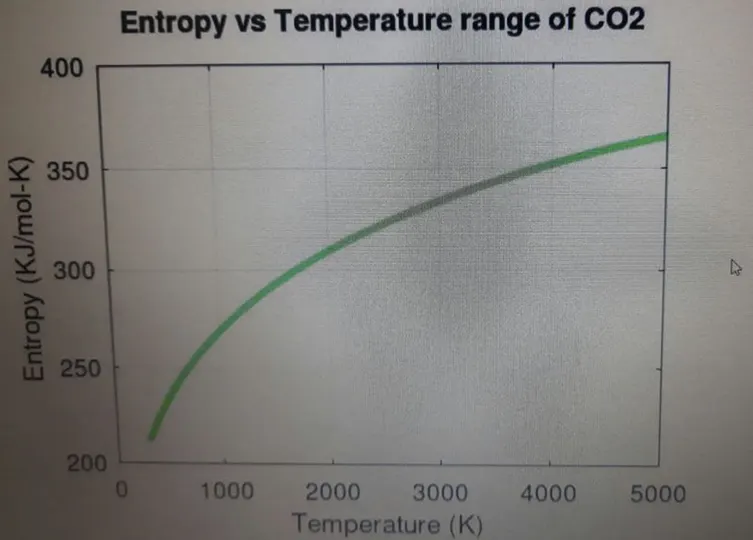
%plot 2 | S vs T
figure(2)
plot(T,S,'linwidth',3,'color','g');
xlabel('Temperature (K)');
ylabel('Entropy (KJ/mol-k)');
title (sprintf( 'Entropy vs Temperature range of %s', species));
grid on
saveas(figure(2),'Entropy.jpg');
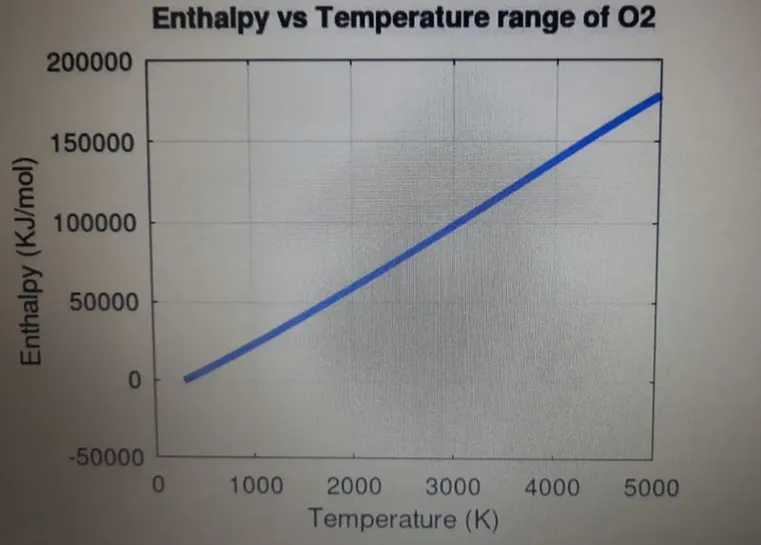
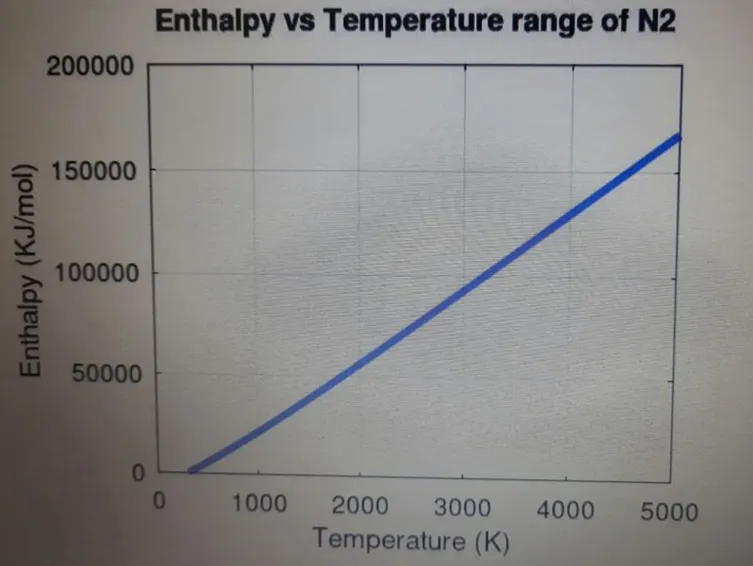
%plot 3 | H vs T
figure(3)
plot(T,H,'linwidth',3,'color','b');
xlabel('Temperature (K)');
ylabel('Enthalpy (KJ/mol)');
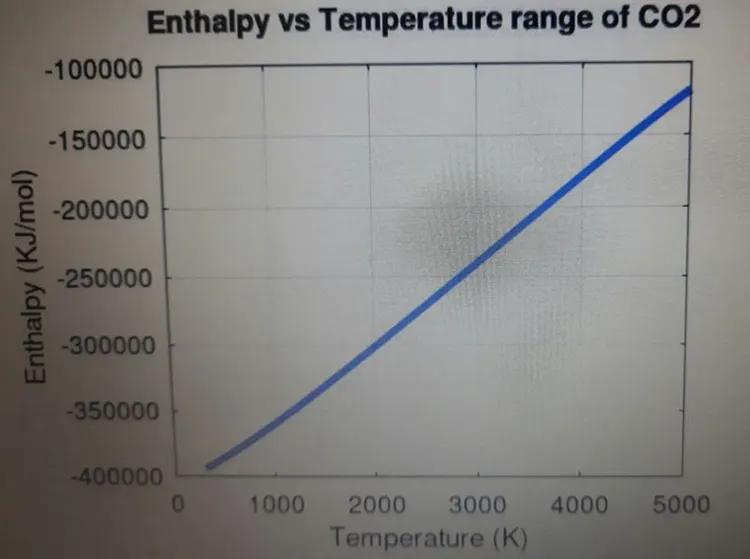
title (sprintf( 'Enthalpy vs Temperature range of %s', species));
grid on
saveas(figure(3),'Enthalpy.jpg');
cd ('c:/users/karth') %changing directory to original matlab path
% Molecular Weight
MW = Molecular_weight (species);
end
RESULTS & PLOT:
PLOTS
Plots Of O2
Plots of N2
Plots of CO2
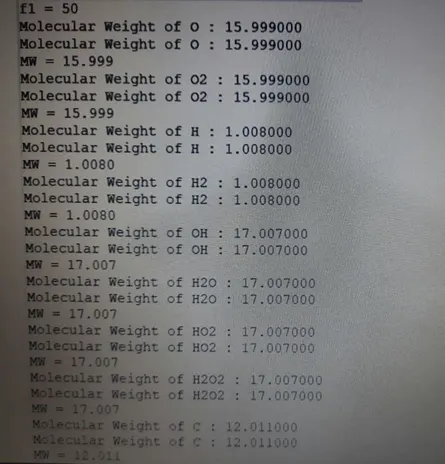
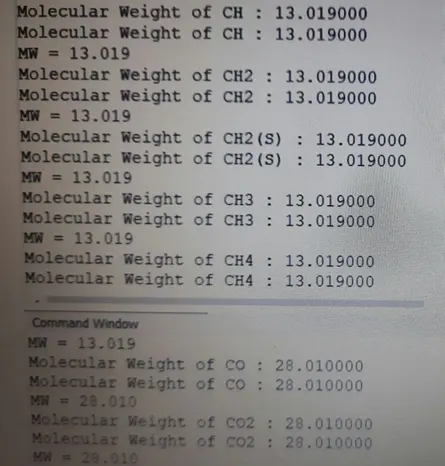
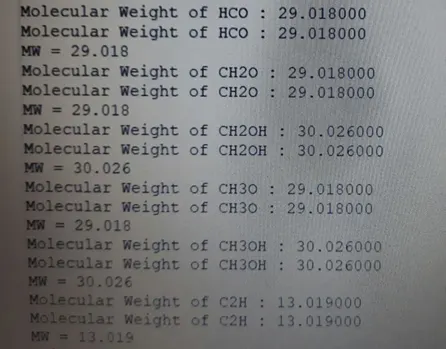
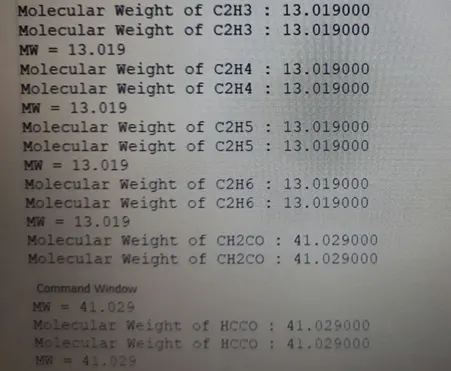
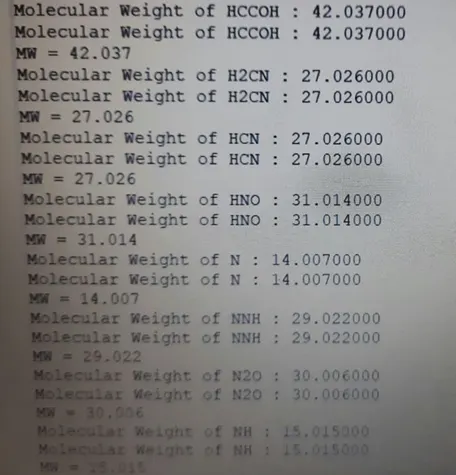
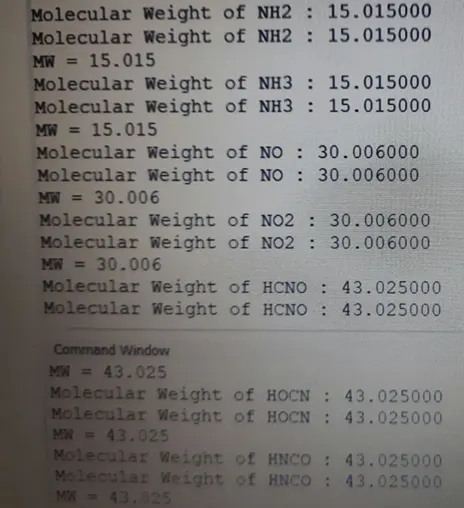
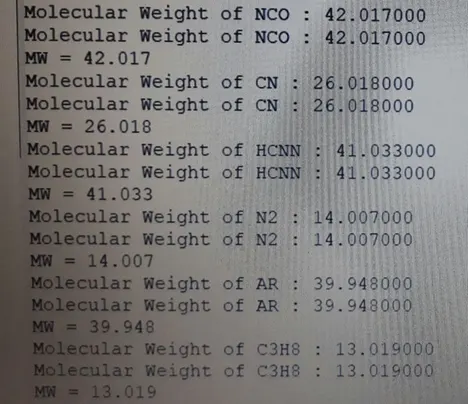
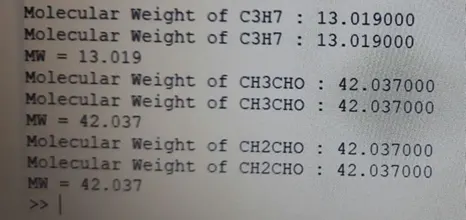
MOLECULAR WEIGHT OF ALL SPECIES:-
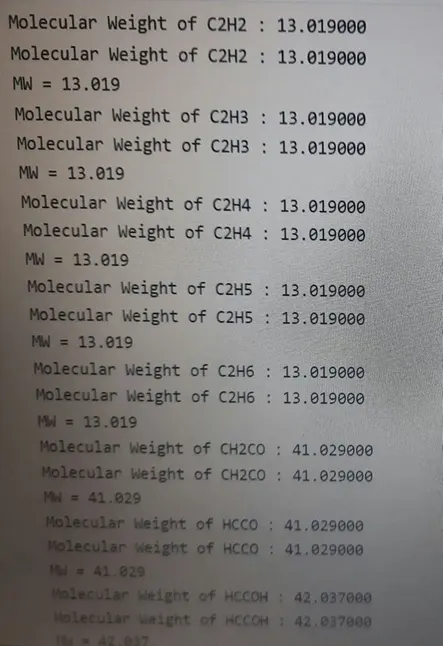
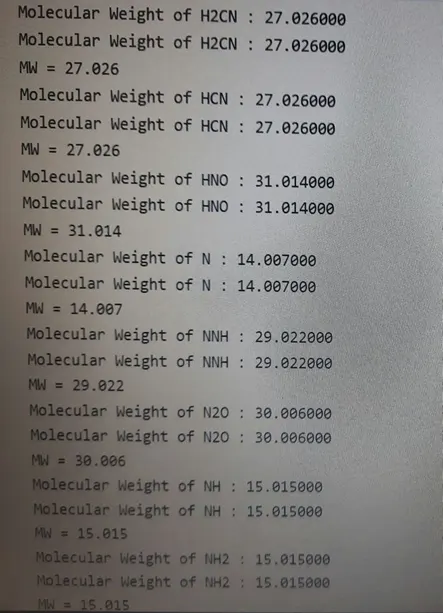
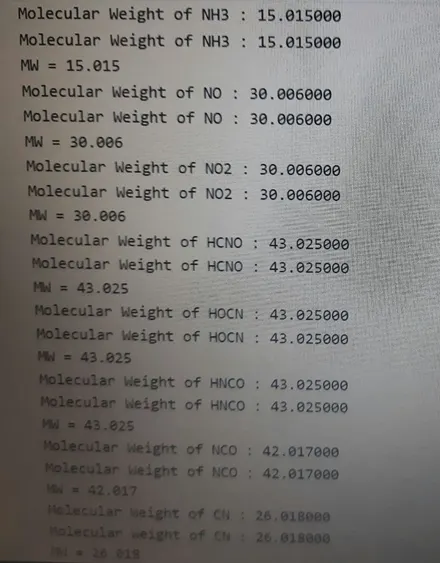
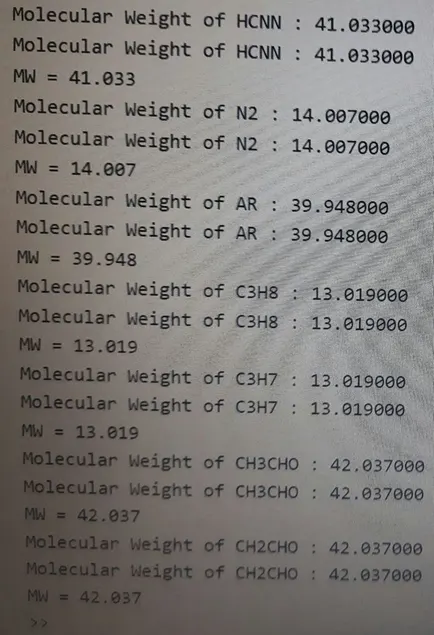
CONCLUSION:
By Using octave code the NASA THERMODYNAMIC DATA, The 14 co-efficient and calculates the enthalpy, entropy and specific heats for all the species in the data are proved.