Project 1 - Parsing NASA thermodynamic data
Parsing NASA thermodynamic data
Aim:
1. Write a function that extracts the 14 co-efficients and calculates the enthalpy, entropy and specific heats for all the species in the data file. You will be reading this file NASA thermodynamic data(Tip: use fopen and fgetl). The formulae are shown below.
Here R is the universal gas constant, T is the temeprature
The FIRST 7 coefficients are HIGH-temperature coefficients and the SECOND 7 coefficients are LOW-temperature coefficients.
Also use the LOCAL TEMPERATURE RANGES which is unique for each individual species, not the GLOBAL TEMPERATURE RANGE.
2. Calculate the molecular weight of each species and display it in the command window.
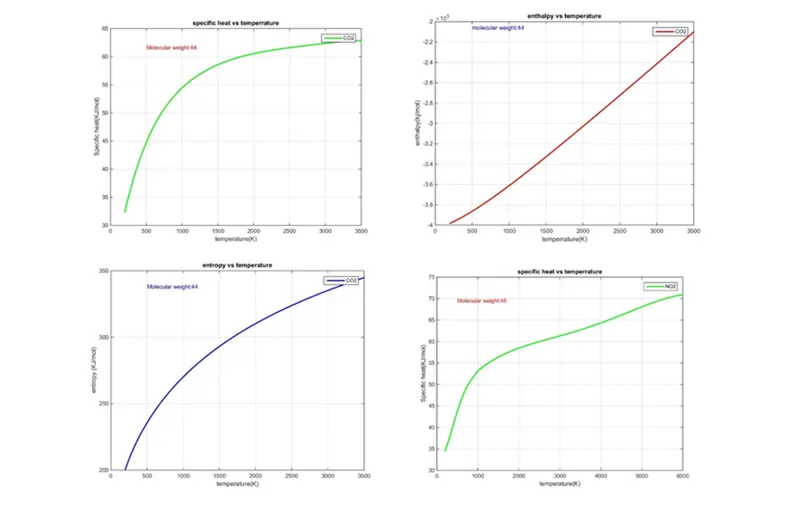
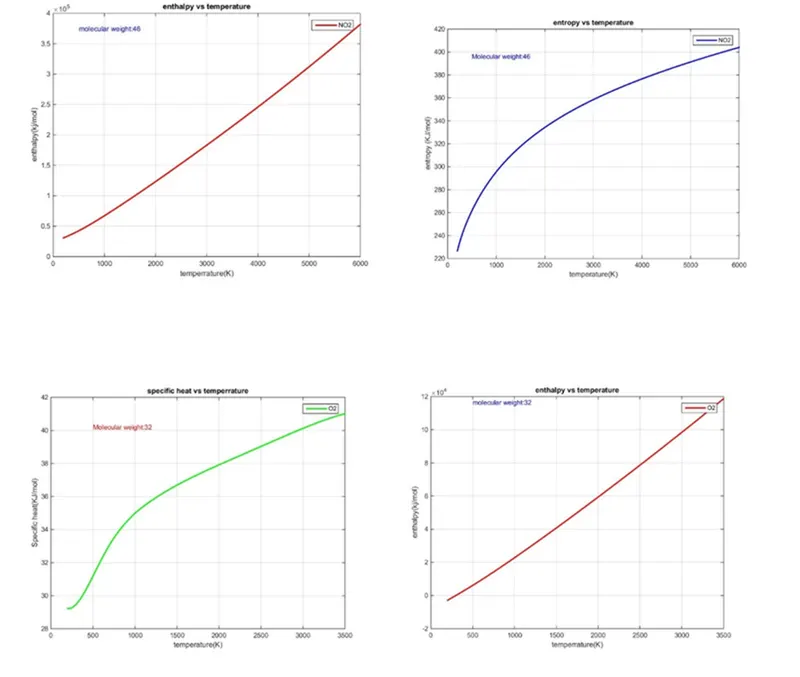
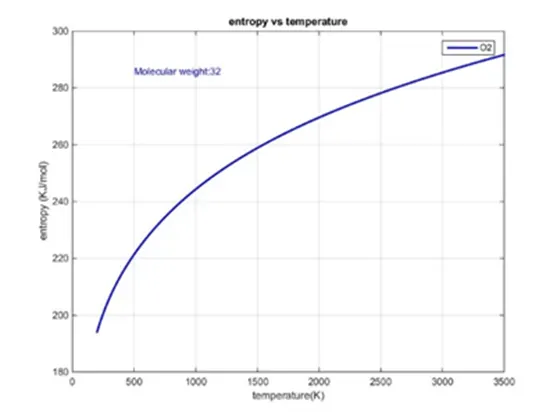
3. Plot the Cp, Enthalpy and Entropy for the local temperature range (low temperature : high temperature) specific for each species.
4. Save the plots as images with appropriate names and dump them in separate folders for each species with suitable name. All these should be generated automatically.
5. The main program that you will submit will just take the "THERMO.dat" file as an input and generate Cp, H and S plots.
6. Please write a detailed report to describe your logic.
Theory:
Data Parsing: Data parsing is the process of extracting data from a file and using it for additional calculations, studies, or drawing key conclusions, as well as how that data might be used in a computer programme.
NASA Thermodynamic Data File: The THERMO.dat file is a NASA-provided data file that contains 14 coefficients for 53 distinct components. These coefficients are used to compute a certain element's specific heat, enthalpy, and entropy. Each element has its own temperature range in its local environment.
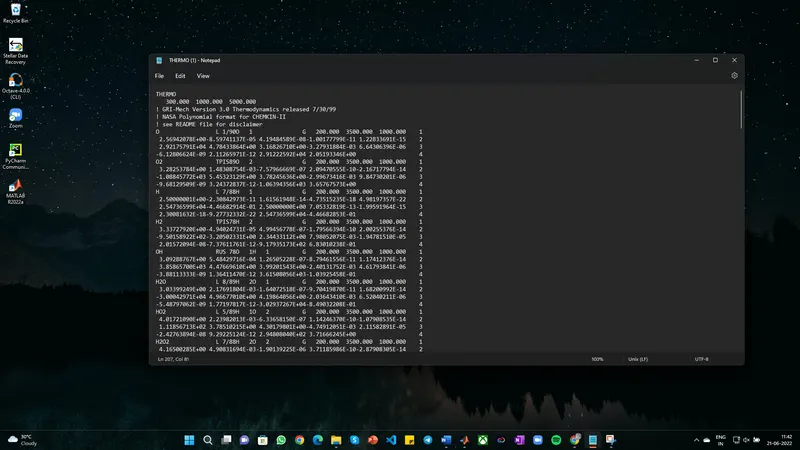
CODE
%clear all the previous data or stores values
clear all
close all
clc

%Open the the THERMO.dat file
f1 = fopen('THERMO.dat','r');

%skip the first line of the file
fgetl(f1);

%reading the tempersture values distingushed as local,average and high temperatures
line = fgetl(f1);
a = strsplit(line,' ');
global_low_temp = str2num(a{2}) ;
global_average_temp = str2num(a{3}) ;
global_high_temp = str2num(a{4}) ;
fgetl(f1);
fgetl(f1);
fgetl(f1);

%extracting data for each gas

for k = 1:53

    %step7

    line = fgetl(f1);
    a = strsplit(line,' ');
    Gas = a(1);
    b = findstr(line,'.');
    local_low_temp = str2num(line(b(1)-4:b(1)+4));
    local_high_temp = str2num(line(b(2)-4:b(2)+4));
    local_average_temp = str2num(line(b(3)-4:b(3)+4));

    %extracting all 14 coefficients

    ct = 1;
    for j = 1:3
        line = fgetl(f1);
        b = strfind(line,'E');
        for i = 1:length(b)
            if ct<= 7
                Ha(ct) = str2num(line(b(i)-11:b(i)+3));
                ct = ct+1;
            else
              La(ct-7) = str2num(line(b(i)-11:b(i)+3));
              ct = ct+1;

            end
        end
    end

    %initializing specific heat,entropy and enthalpy values to zero

    cp = 0;
    H = 0;
    S = 0;

    %calling the function where cp,H and S are calculated

    [Cp,H,S] = coefficient(local_low_temp,local_average_temp,local_high_temp,La,Ha);

    %molecular weight calculating function

    M = Weight(Gas);

    %plotting

    GAS = char(Gas);
    T = local_low_temp:local_high_temp;
    current = pwd;
    mkdir(GAS);
    cd(GAS)

    %Plotting the figure 1

    figure(1);
    plot(T,Cp,'color','g','linewidth',2);
    legend(Gas);
    txt1 = ['Molecular weight:' num2str(M)];
    text(500,max(Cp)*0.98,txt1,'color','r');
    %Giving the grid for plot
    grid on

    %Giving label and titile for the plot

    xlabel('temperature(K)');
    ylabel('Specific heat(KJ/mol)');
    title('specific heat vs temperrature');

    %Plotting the figure 2

    figure(2);
    plot(T,H,'color','r','linewidth',2);
    legend(Gas);
    txt1=['molecular weight:' num2str(M)];
    text(500,max(H)*0.98,txt1,'color','b');
    grid on
    xlabel('temperrature(K)');
    ylabel('enthalpy(kj/mol)');
    title('enthalpy vs temperature');

    %Plotting the figure 3

    figure(3);
    plot(T,S,'color','b','linewidth',2);
    legend(Gas);
    txt1=['Molecular weight:' num2str(M)];
    text(500,max(S)*0.98,txt1,'color','b');
    grid on
    xlabel('temperature(K)');
    ylabel('entropy (KJ/mol)');
    title('entropy vs temperature');

    %Saving all Three figures

    saveas(figure(1),'Cp.jpg');
    saveas(figure(2),'H.jpg');
    saveas(figure(3),'S.jpg');

   cd(current);
end

%function to calculate molecular weight

function Mo=Weight(Gas)

Weight=[1 12 14 16 32 0 40];
Gas1=['H' 'C' 'N' 'O' 'S' 'A' 'R'];
number=[1 2 3 4];

M=0;
GAS=char(Gas);
for i=1:length(GAS)
    for j=1:length(Gas1)
    if GAS(i)==Gas1(j)
        M(i)= Weight(j);
    end
    for j=1:length(number)
        if str2double(GAS(i))==number(j)
            M(i)=M(i-1)*(number(j)-1);
        end
    end
end
end

Mo = sum(M);
end


%function to calculate the Cp,H,S.

function [Cp,H,S]=coefficient(local_low_temp,local_average_temp,local_high_temp,La,Ha)
for i=1:local_high_temp-local_low_temp+1

    R=8.34;
    T=i+local_low_temp-1;

    %for lower temperature values

    if T<= local_average_temp
         Cp(i)=R*(La(1)+La(2)*T+La(3)*T^2+La(4)*T^3+La(5)*T^4);
         H(i)=R*T*(La(1)+(La(2)*T)/2+(La(3)*T^2)/3+(La(4)*T^3)/4+(La(5)*T^4)/5+La(6)/T);
         S(i)=R*(La(1)*log(T)+(La(2)*T)+((La(3)*T^2)/2)+((La(4)*T^3)/3)+((La(5)*T^4)/4)+(La(7)));

         %for higher temperature values

     else
         Cp(i)=R*(Ha(1)+Ha(2)*T+Ha(3)*T^2+Ha(4)*T^3+Ha(5)*T^4);
         H(i)=R*T*(Ha(1)+((Ha(2)*T)/2)+(Ha(3)*T^2)/3+(Ha(4)*T^3)/4+(Ha(5)*T^4)/5+(Ha(6)/T));
         S(i)=R*(Ha(1)*log(T)+(Ha(2)*T)+(Ha(3)*T^2)/2+(Ha(4)*T^3)/3+(Ha(5)*T^4)/4+(Ha(7)));

     end
end
end
Explanation of code
The 'fopen' command opens the 'THERMO.dat' file, and the 'r' instruction indicates that the file is read only. To read the data file line by line, we utilise the 'fgetl' command. The first line of the file is removed, and the next line is saved in a variable called 'line,' and then split using the'strsplit' command and saved in a variable called 'a.' Different temperature values are assigned to read the 53 gases listed in the data file we use for loop, and then we use the fgetl command to read the lines in the file. We call functions that are built to compute molecular weight, specific heat(Cp), enthalpy(H), and entropy(E) once all global and local temperatures have been read (s). Calculating Cp,H, and S values for a given temperature range.Plotting the graphs and putting them in the folder with initial values of zero for Cp, H, and S. Using numerous commands (pwd, mkdir, cd, saveas) written in this application, it is common procedure to save a file in a given directory.
To compute Cp, H, and S, we use formulas. To compute each value at the local temperature range, we use the for loop. We're also using the if and else commands to calculate the low and high temperature coefficients based on the average temperature. If the temperature is below the average, apply a low temperature co-efficient. & If the temperature is higher than the average, utilise the high temperature co-efficient.The molecular weight is determined in a separate function that is called later in the main function.
Error Faced While Programing
Error: 1
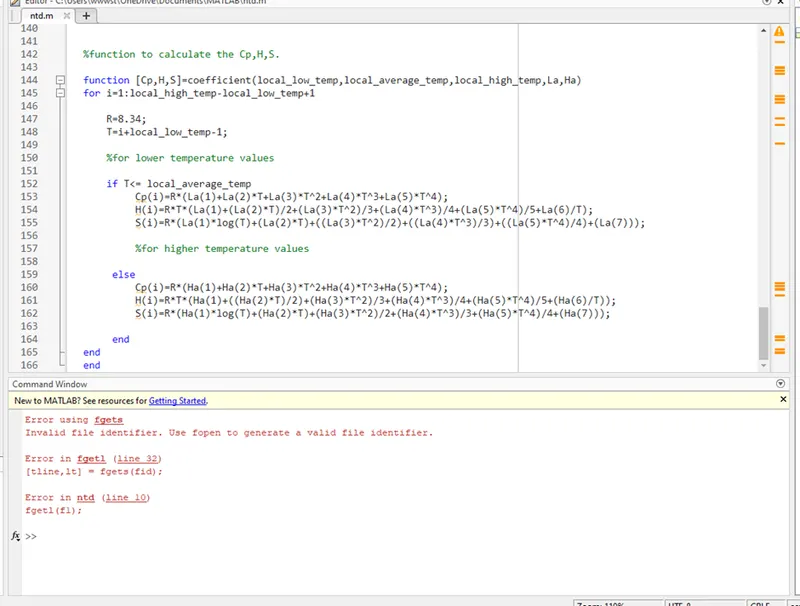
Error using fgets
Invalid file identifier. Use fopen to generate a valid file identifier.
This error is because of the thermo.dat file is empty
Error: 2
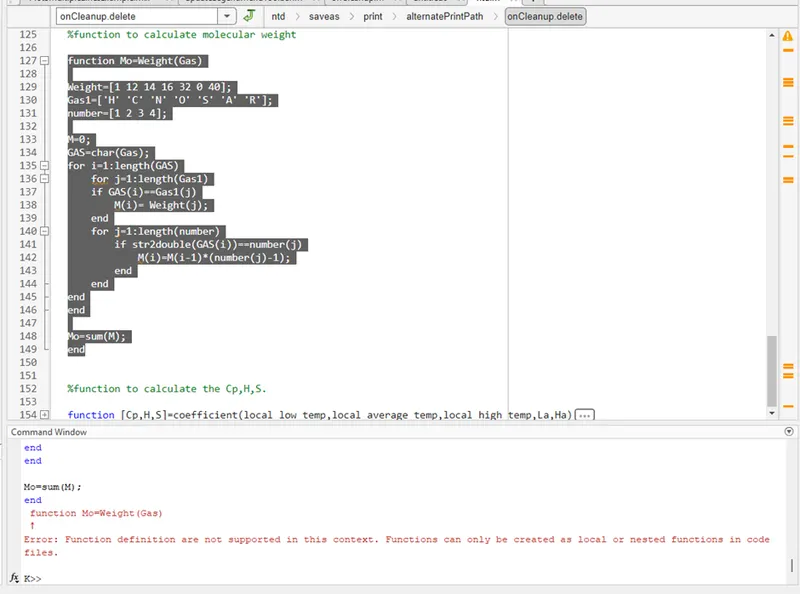
This error is cleared by supporting the function definitions to the context . in the MATLAB help centre only the solution is available just go through that by clicking the reference links
Resultes:
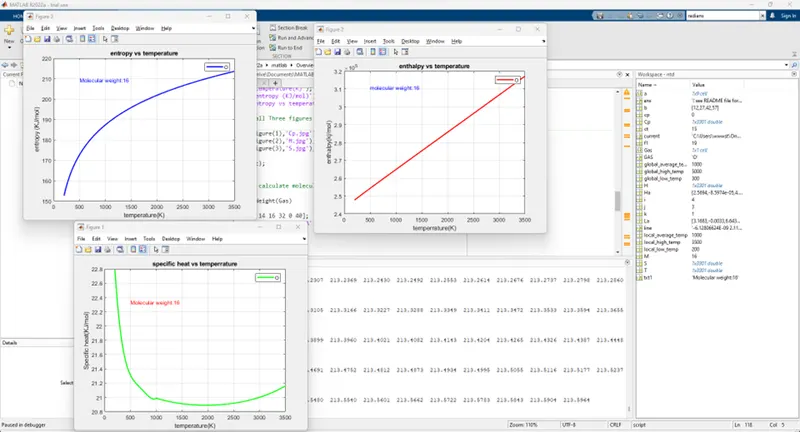
Other Graphs