Project 1 - Parsing NASA thermodynamic data
AIM
Write a MATLAB code for parsing the NASA thermodynamic data file and then calculate thermodynamic properties of various gas species.
GOVERNING EQUATIONS

Where,
a1, a2, a3, a4, a5, a6, a7 are temperature coefficients
R - Universal gas constant
T – Temperature
Cp – Specific Heat
H - Enthalpy
S – Entropy
OBJECTIVE
- MATLAB code for parsing the NASA thermodynamic data file and extract 14 coefficients to calculate specific heat, enthalpy and entropy for all species in the data file.
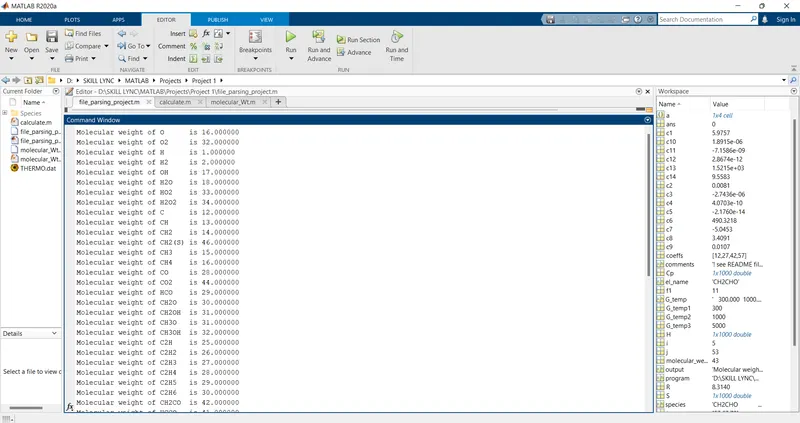
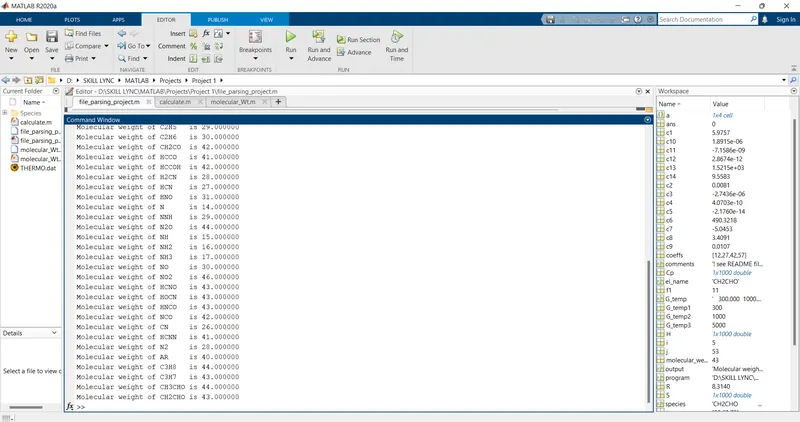
- Calculate molecular weight of each species and display it in the command window.
- Plot the graph for specific heat, enthalpy and entropy for the local temperature range for each species.
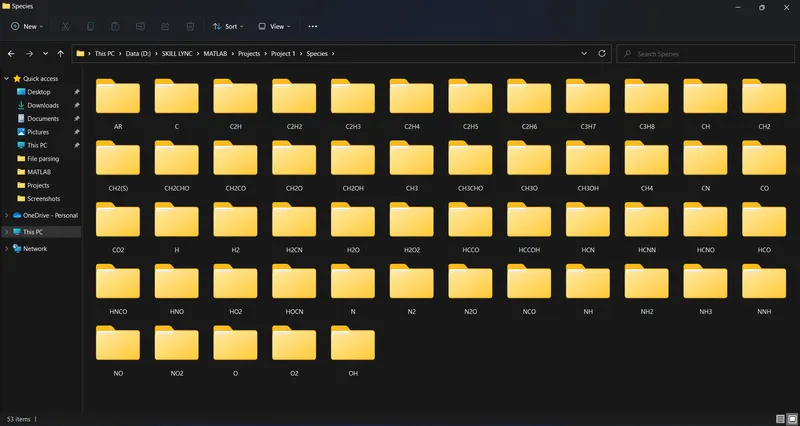
- Save the plots as images with appropriate names and dump them in separate folders for each species with suitable name.
- Screenshot of the window where all the folders are saved and Plots for o2, N2 and Co2 species.
THEORY
Parsing: Parsing a file means reading in a data stream and building a memory model of the content of that data. Parsing splits a file or other input into pieces of data that can be easily stored or manipulated.
Here we extract the NASA thermodynamic data to perform various operations. The data that we collect from the file is about the temperature range of various species. These data are then stored and manipulated for finding specific heat, enthalpy and entropy for all the species in the data file using simple MATLAB code. This enables us to easily identify the nature of different species with respect to the temperature range. Thus, here we are extracting the required information from a given file and implementing it in a program.
Specific heat (Cp): The quantity of heat required to raise the temperature of one gram of a substance by one Celsius degree.
Enthalpy (H) is the measure of total heat present in the thermodynamic system where the pressure is constant.
Entropy (S) is the measure of disorder in a thermodynamic system.
PROGRAM
Main program: For file parsing
clear all
close all
clc


f1 = fopen('THERMO.dat','r');  % Opening the NASA thermo file and reading data
fgetl(f1);  % For getting the header details in the file


G_temp = fgetl(f1);  % Collecting global temp ranges for which themodynamic properties are valid
a = strsplit(G_temp,' '); % Splitting the line to extract global temperatures
G_temp1 = str2num(a{2}); %Converting the character array or string scalar to a numeric matrix
G_temp2 = str2num(a{3});
G_temp3 = str2num(a{4});

% Comments
for i = 3:5
 comments = fgetl(f1); % Skipping next 3 lines which doesn't have much significance in parcing
end

% Extracting individual species information
for j = 1:53  % Total 53 species are there in data
    species = fgetl(f1);
    t = findstr(species,'.');

    T_low = species(52-3:52+3);
    Tl = str2num(T_low);  % Local low temperature

    T_high = species(62-3:62+3);
    Th = str2num(T_high);  % Local high temperature

    T_mean = species(72-4:72+3);
    Tm = str2num(T_mean);  % Local mean temperature

    el_name = species(1:6);  % Total 6 elements exists


    tline = fgetl(f1);  % Extracting first line of the species

    % Extracting the coefficients from 1st line of species
    coeffs = findstr(tline,'E');

    c1 = tline(1:coeffs(1)+3);
    c1 = str2double(c1);

    c2 = tline(coeffs(1)+4:coeffs(2)+3);
    c2 = str2double(c2);

    c3 = tline(coeffs(2)+4:coeffs(3)+3);
    c3 = str2double(c3);

    c4 = tline(coeffs(3)+4:coeffs(4)+3);
    c4 = str2double(c4);

    c5 = tline(coeffs(4)+4:coeffs(5)+3);
    c5 = str2double(c5);


    tline = fgetl(f1);  % Extracting second line of the species

    % Extracting the coefficients from 2nd line of species
    coeffs = findstr(tline,'E');

    c6 = tline(1:coeffs(1)+3);
    c6 = str2double(c6);

    c7 = tline(coeffs(1)+4:coeffs(2)+3);
    c7 = str2double(c7);

    c8 = tline(coeffs(2)+4:coeffs(3)+3);
    c8 = str2double(c8);

    c9 = tline(coeffs(3)+4:coeffs(4)+3);
    c9 = str2double(c9);

    c10 = tline(coeffs(4)+4:coeffs(5)+3);
    c10 = str2double(c10);


    tline = fgetl(f1);  % Extracting third line of the species

    % Extracting the coefficient from 3rd line of species
    coeffs = findstr(tline,'E');

    c11 = tline(1:coeffs(1)+3);
    c11 = str2double(c11);

    c12 = tline(coeffs(1)+4:coeffs(2)+3);
    c12 = str2double(c12);

    c13 = tline(coeffs(2)+4:coeffs(3)+3);
    c13 = str2double(c13);

    c14 = tline(coeffs(3)+4:coeffs(4)+3);
    c14 = str2double(c14);
    % Total 14 coefficients are collected in which the first 7 are for local high temperature and the remaining 7 for local low temperature

    R = 8.314; % Defining the value of universal gas constant
    T = linspace(Tl,Th,1000);  % Taking 100 values between local low temperature and local high temperature

    [Cp H S] = calculate(T,R,Tm,c1,c2,c3,c4,c5,c6,c7,c8,c9,c10,c11,c12,c13,c14);  % Calling the function to find specific heat,enthalpy and entropy

    % Making directory for each species
    mkdir('D:\SKILL LYNC\MATLAB\Projects\Project 1\Species',el_name);


    % Plotting

    figure(1)
    % Temperature vs Specific heat
    plot(T,Cp,'linewidth',3,'color','r')
    grid on
    title(el_name)
    xlabel('Temperature')
    ylabel('Specific Heat')


    figure(2)
    % Temperature vs Enthalpy
    plot(T,H,'linewidth',3,'color','g')
    grid on
    title(el_name)
    xlabel('Temperature')
    ylabel('Enthalpy')


    figure(3)
    % Temperature vs Entropy
    plot(T,S,'linewidth',3,'color','b')
    grid on
    title(el_name)
    xlabel('Temperature')
    ylabel('Entropy')

    % Changing the directory
    program = (['D:\SKILL LYNC\MATLAB\Projects\Project 1\Species\',el_name]); % Changing the file path to save plots
    cd(program)

    % Saving the plots
    saveas(1,'Specific Heat.jpg')
    saveas(2,'Enthalpy.jpg')
    saveas(3,'Entropy.jpg')

    cd('D:\SKILL LYNC\MATLAB\Projects\Project 1')

    % Calculation molecular weight for each species
    molecular_weight_calculation = molecular_Wt(el_name); % Calling the function for calculating molecular weight of each species

    output = sprintf('Molecular weight of %s is %f',el_name,molecular_weight_calculation);
    disp(output) % To display the molecular weight of each species
end
fclose(f1);
Explaining the main program
- The main program begins with the basic commands clear all, close all and clc which clears the workspace, closes all the plots and clear the command window respectively.
- fopen command is used to open the NASA thermodat file with letter r used which indicates to read mode.
- fgetl command is used to extract heading of the file.
- Again with the help of fgetl command global temperature line is extracted and is splitted using the keyword strsplit and converted the obtained string values to numericals using the command str2num. obtained low, high and mean global temperatures are stored in different variables.
- The next three lines are comments which are not of use in our program, Thus, those three lines are read and skipped using for loop.
- From the next line onwards, the data is about the species and their 14 coefficients where the first seven are local high temperature coefficients and the remaining seven are local low temperature coefficients.
- Using the for loop the data of 53 species are extracted.
- The first fgetl command will extract the first line of the species where the name of the species is obtained also the local low, mean and maximum temperature.
- The next three fgetl commands are used to extract the coefficients in those three lines.
- The 14 coefficients are saved in the variables c1, c2, c3, c4, c5, c6, c7, c8, c9, c10, c11, c12, c13 and c14.
- Specific heat, enthalpy and entropy are calculated by using the function.
- mkdir command creates a folder for saving the plots that will be generated. It is used to create the directory for each species.
- By using the plot command, calculated parameters are plotted against the corresponding value of temperature. xlabel and ylabel are used for labels in the graph. Titles are also provided in the graph.
- The file directory is then changed to the one that was previously created to save these plots.
- saveas command is used to save the plots with the names we want along with the format.
- The directory is then switched back for molecular weight calculation.
- Molecular weight is calculated by calling a new function molecular_Wt.
- Disp command is used to print the molecular weight in the command window.
- The file is then closed.
Function for calculating specific heat, enthalpy and entropy
function [Cp H S] = calculate(T,R,Tm,c1,c2,c3,c4,c5,c6,c7,c8,c9,c10,c11,c12,c13,c14)
% Calculation of properties based on local low temperature and local high temperature
for k = 1:length(T)
     if T(k)>Tm
         Cp = (c1 + c2.*T + c3.*T.^2 + c4.*T.^3 + c5.*T.^4)*R;
         H = (c1 + (c2.*T)./2 + (c3.*T.^2)./3 + (c4.*T.^3)./4 + (c5.*T.^4)./5 + c6./T).*T.*R;
         S = (c1.*log(T) + c2.*T + (c3.*T.^2)./2 + (c4.*T.^3)./3 + (c5.*T^4)./4 + c7)*R;
     else
         Cp = (c8 + c9.*T + c10.*T.^2 + c11.*T.^3 + c12.*T.^4)*R;
         H = (c8 + (c9.*T)./2 + (c10.*T.^2)./3 + (c11.*T.^3)./4 + (c12.*T.^4)./5 + c13./T).*T.*R;
         S = (c8.*log(T) + c9.*T + (c10.*T.^2)./2 + (c11.*T.^3)./3 + (c12.*T.^4)./4 + c14)*R;
     end
 end
end
Explaining the code for calculating specific heat, enthalpy and entropy
- For the calculation of specific heat, enthalpy and entropy a function is created called as calculate.
- The function takes temperature which is obtained from the main program by dividing the high and low local temperature into 1000 parts, universal gas constant, mean local temperature and the 14 coefficients of local temperature.
- It is then provided under a for loop for finding the variation of specific heat, enthalpy and entropy for every temperature that we take.
- If the temperature is greater than the mean local temperature, then the coefficients that should be taken are the first seven else the last seven coefficients should be used.
- Specific heat, enthalpy and entropy are thus found out using the formula provided.
Function for calculating molecular weight
function molecular_weight_calculation = molecular_Wt(el_name)
% Calculating molecular weight of elements
species = (el_name);
elements = ['H','C','N','O','S','A'];
atomic_wt = [1 12 14 16 32 40];  % Assigning atomic weight for each array element of species
molecular_weight_calculation = 0;  % Initialising the value for molecular weight
for i = 1:length(species)
    for j = 1:length(elements)
        if strcmpi(species(i),elements(j))  % Comparing the species name with the species array
            molecular_weight_calculation = molecular_weight_calculation + atomic_wt(j);
            position = j;
        end
    end
    n = str2double(species(i));  % Extract the numbers present in the species name
    if n>1
        molecular_weight_calculation = molecular_weight_calculation + atomic_wt(position).*(n-1);  % To add the repetitive elements of the species with the weight
    end
end
end
Explaining the code for calculating molecular weight for each species
- Molecular weight of each species is calculated using the function molecular_Wt.
- The function takes the name of the element as input.
- Name of each element is saved in the string called elements.
- Atomic weight of each corresponding elements are also saved in an array named atomic_wt.
- molecular_weight_calculation is initially assigned with a value zero.
- Using nested for loop molecular weight of each species is calculated.
- The first for loop runs for entire length of species name.
- The second for loop runs for entire length of elements.
- strcmpi command is used is used to compare the two strings and return 1 if it matches.
- Thus, molecular weight is calculated by running this for loop for identifying the element and corresponding atomic weight is added for molecular weight. This continues for each letter in the species name.
- Another if command is used for identifying the numerical involved in the species name and it is also added up in the molecular weight by using the formula mentioned in the program.
- The final result thus obtained is then returned back to the main program.
RESULTS
1. Molecular weight of each species displayed on the command window:
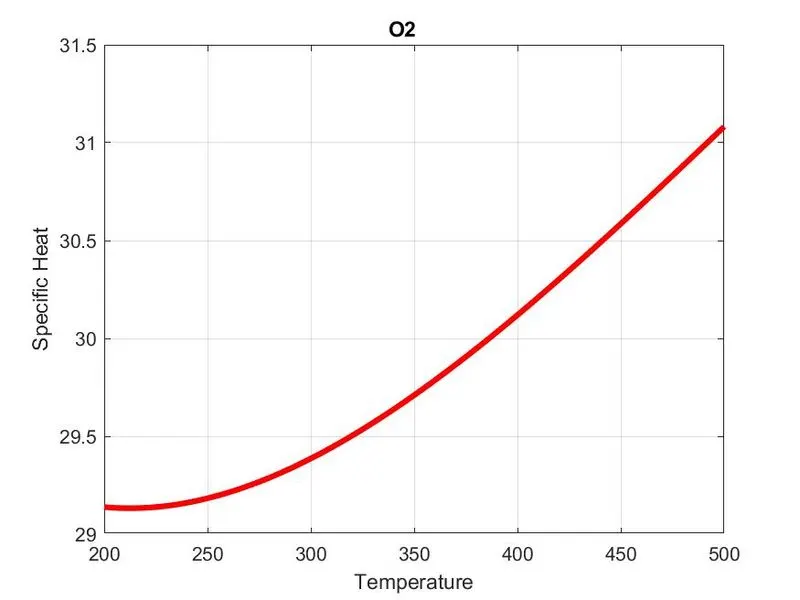
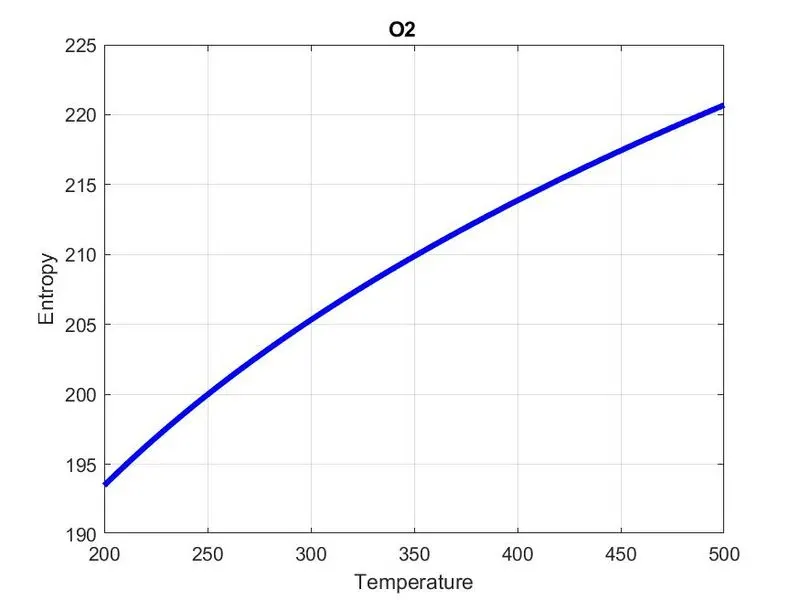
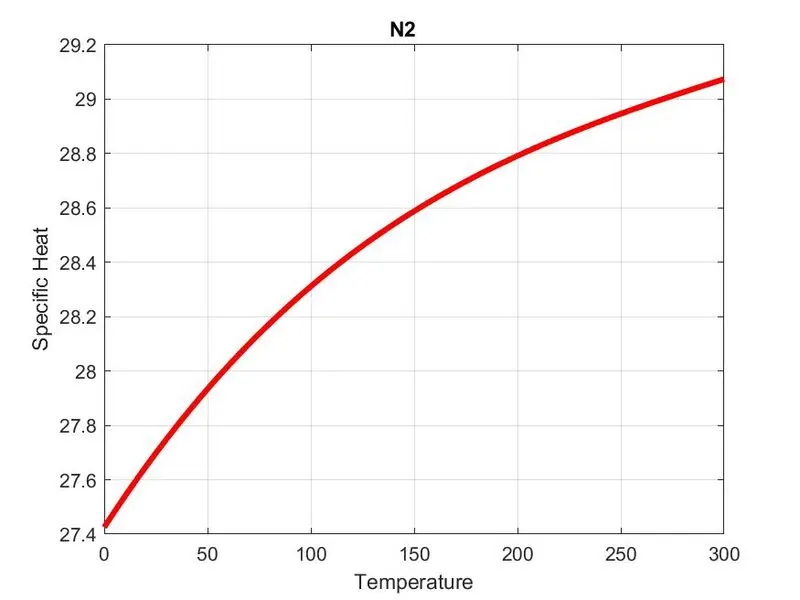
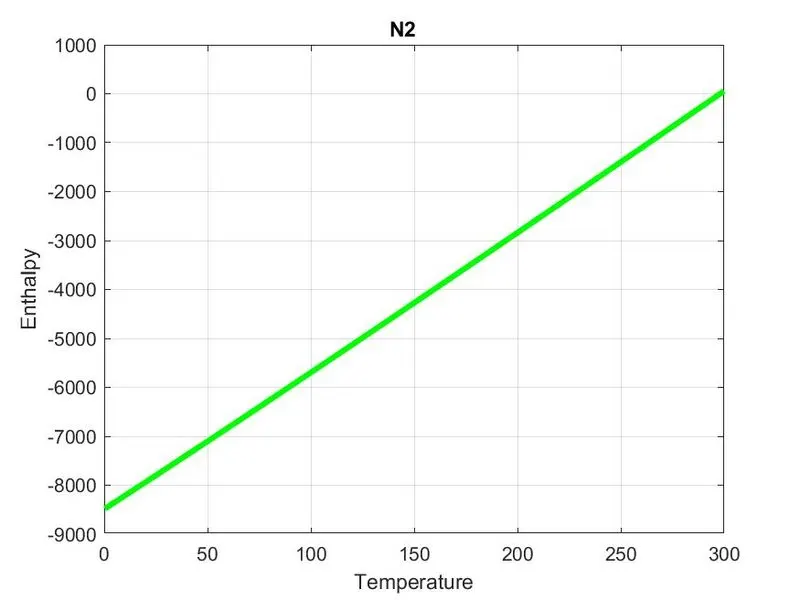
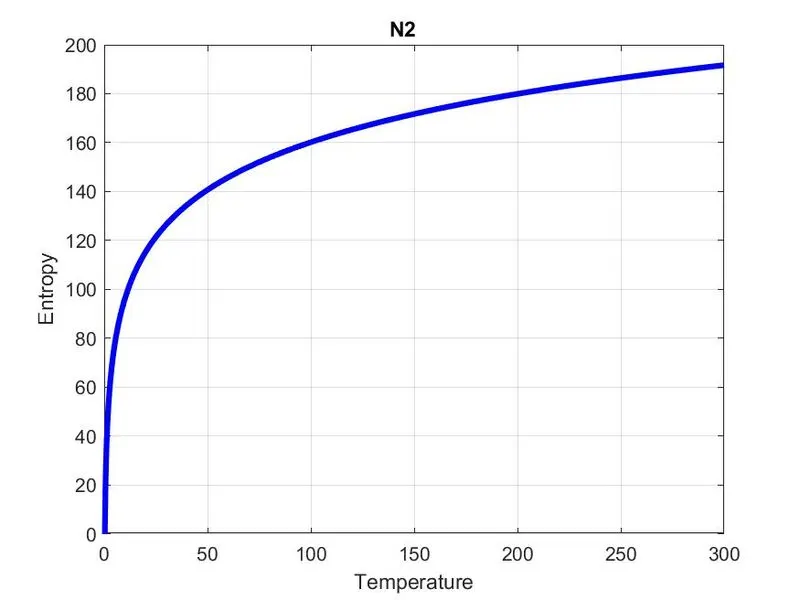
2. Plots for O2, N2 and CO2 species:
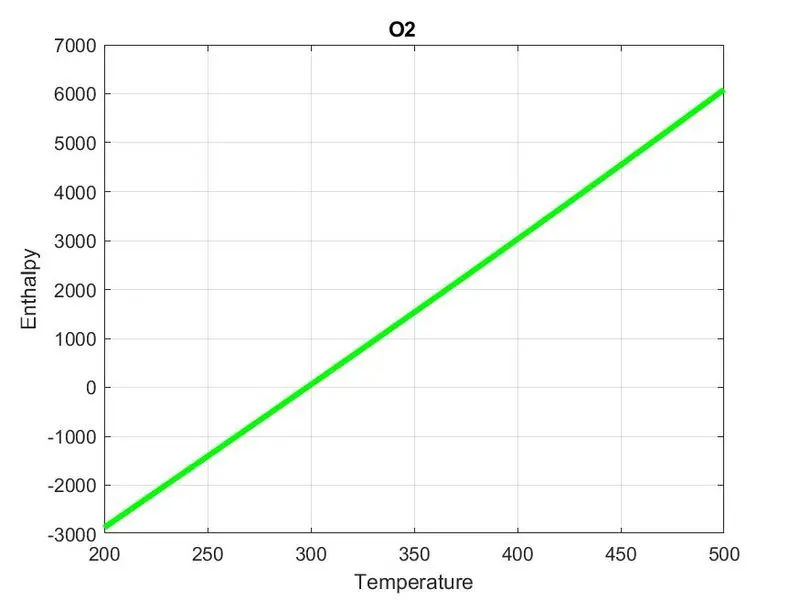
O2:
Specific heat vs Temperature
Enthalpy vs Temperature
Entropy vs Temperature
N2:
Specific heat vs Temperature
Enthalpy vs Temperature
Entropy vs Temperature
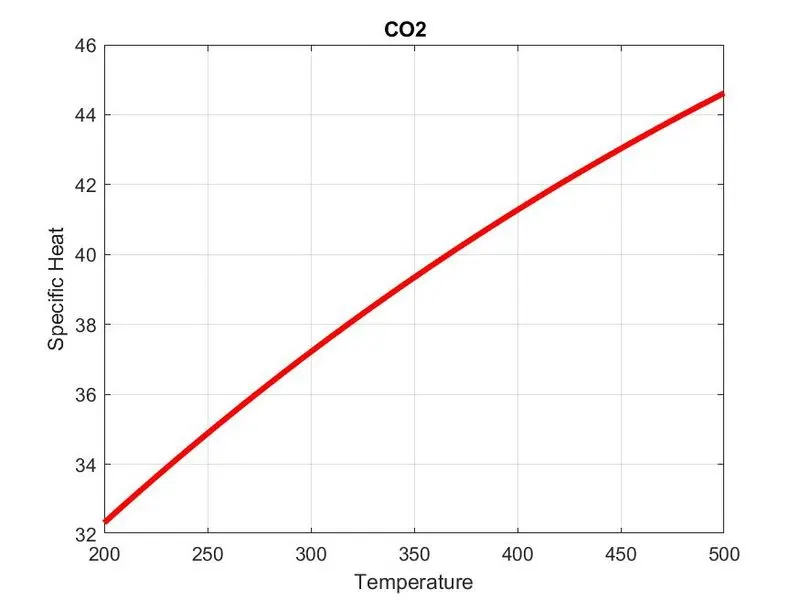
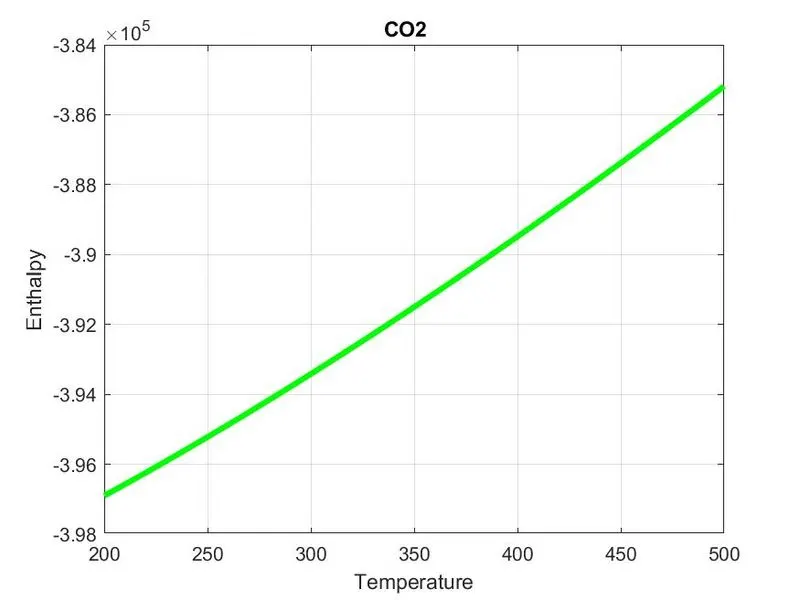
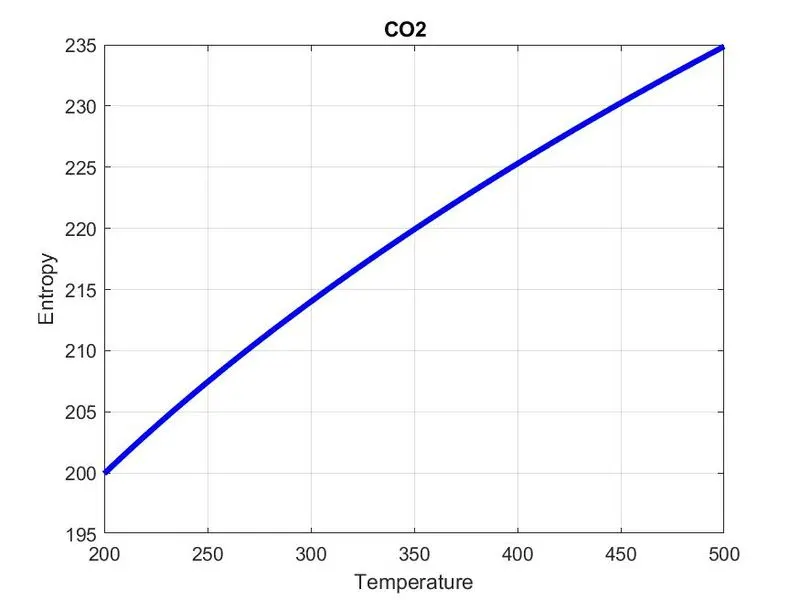
CO2:
Specific heat vs Temperature
Enthalpy vs Temperature
Entropy vs Temperature
3. Screenshot of the window where all the folders are saved
CONCLUSION
- MATLAB code for parsing is done.
- Graph for all species is plotted and the required graphs are attached.
- Molecular weight of every species is calculated.