Project 1 - Parsing NASA thermodynamic data
AIM
- Write a function that extracts the 14 co-efficients and calculates the enthalpy, entropy and specific heats for all the species in the data file.
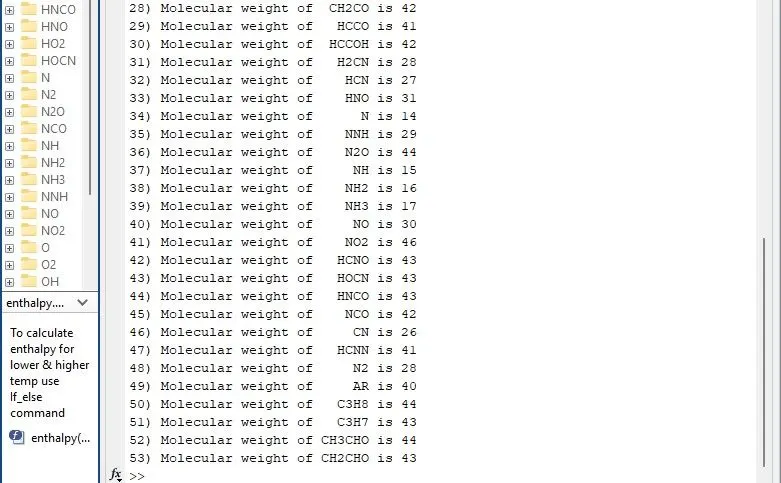
- Calculate the molecular weight of each species and display it in the command window.
- Plot the Cp, Enthalpy and Entropy for the local temperature range (low temperature : high temperature) specific for each species.
- Save the plots as images with appropriate names and dump them in separate folders for each species with suitable name. All these should be generated automatically.
- The main program that you will submit will just take the "THERMO.dat" file as an input and generate Cp, H and S plots.
- Please write a detailed report to describe your logic.
Attachments needed:- Screenshot of the window where all the folders are saved.
- Plots for o2, N2 and Co2 species
What is Parsing?
Parsing is the process of converting formatted text into a data structure. A data structure type can be any suitable represention of the information engraved in the source text.
IN the field of computer programming, the definition of parsing is to analyze a string of symbols, special charachters and data structures using Natural language processing. When you define extarcting in parsing, it refers to structuring info from data sets and giving it meaning by organising it, based on user-defined rules.
NASA Thermodynamic File
NASA has a thermodyanamic file named THERMO.dat which contains different data for 53 types of species. For each species data consists of species name, local temperature range, numerical coefficients for higher and lower temperature range and global temperature range. Our Task is to extract all these data from the file to find enthalpy, entropy, specific heat and molecular weight of each species using MATLAB.
The NASA polynommials have the form:
`(Cp)/R = a1 + a2 T + a3 T^2 + a4 T^3 + a5 T^4`
`H/(RT) = a1 + a2 T /2 + a3 T^2 /3 + a4 T^3 /4 + a5 T^4 /5 + (a6)/T`
`S/R = a1 lnT + a2 T + a3 T^2 /2 + a4 T^3 /3 + a5 T^4 /4 + a7`
1. Specific heat (Cp)
Specific heat of substance is the quantity of heat required to raise the temperature of 1 gram of substance by 1 Celsius degree.
NASA polynomial has given the relation between Cp and T as below-
`(Cp)/R = a1 + a2 T + a3 T^2 + a4 T^3 + a5 T^4`
A function is created in MATLAB to calculate Cp. The code for same is given below-
% Project1- Function for specific heat
function Cp=sp_heat(a1,a2,a3,a4,a5,a8,a9,a10,a11,a12,T,temp_m,R)

% To calculate Sp heat for lower & higher temp use If_else command

if (T<=temp_m)
    Cp=R*(a8+a9.*T+a10.*T.^2+a11.*T.^3+a12.*T.^4);
else
    Cp=R*(a1+a2.*T+a3.*T.^2+a4.*T.^3+a5.*T.^4);
end
end
Code Explaination
1. sp_heat function is created to calculate specific heat and inputs are defined.
2. There are 2 different set of coefficients for higher temp and lower temp range, to identify range and assign apprpriate coefficients use if_else loop, if temp is lower than or equal to mid temp and else for higher range and wrote diff formulae.
2. Enthalpy (H)
Enthalpy is the sum of internal energy and the product of the pressure and volume of thermodynamic system. According to the law of energy conservation, the change in internal energy is equal to the heat transferred to, less the work done by, the system. If the only work done is a change of volume at constant pressure, the enthalpy change is exactly equal to the heat transferred to the system.
The equation provided by NASA polynomials is-
`H/(RT) = a1 + a2 T /2 + a3 T^2 /3 + a4 T^3 /4 + a5 T^4 /5 + (a6)/T`
The function is created in MATLAB to calculate H.
% Project1- Function for Enthalpy
function H=enthalpy(a1,a2,a3,a4,a5,a6,a8,a9,a10,a11,a12,a13,T,temp_m,R)

% To calculate enthalpy for lower & higher temp use If_else command

if (T<=temp_m)
    H=R.*T.*(a8+a9.*T/2+a10.*T.^2/3+a11.*T.^3/4+a12.*T.^4/5+a13./T)./1000;
% Divided by 1000 to get unit in kJ/mol
else
    H=R.*T.*(a1+a2.*T/2+a3.*T.^2/3+a4.*T.^3/4+a5.*T.^4/5+a6./T)./1000;
end
end
1. enthalpy function is created to calculate enthalpy and inputs are defined.
2. There are 2 different set of coefficients for higher temp and lower temp range, to identify range and assign apprpriate coefficients use if_else loop, if temp is lower than or equal to mid temp and else for higher range and wrote diff formulae.
3. Equation is divided by 1000 to get values in kJ/mol.
3. Entropy
Entropy is a measure of a system's energy that is unavailable for work, or of the degree of a system's disorder. When heat is added to a system held at constant temp, the change in entropy related to the change in energy, the pressure, the temp, and the change in volume.
The equation provided by NASA polynomials is
`S/R = a1 lnT + a2 T + a3 T^2 /2 + a4 T^3 /3 + a5 T^4 /4 + a7`
The matlab code to find entropy using above equation is
% Project1- Function for Entropy
function S=entropy(a1,a2,a3,a4,a5,a7,a8,a9,a10,a11,a12,a14,T,temp_m,R)

% To calculate entropy for lower & higher temp use If_else command

if (T<=temp_m)
    S=R.*(a8.*log(T)+(a9.*T)+a10.*(T.^2)./2+a11.*(T.^3)./3+a12.*(T.^4)./4+a14);
else
    S=R.*(a1.*log(T)+(a2.*T)+a3.*(T.^2)./2+a4.*(T.^3)./3+a5.*(T.^4)./4+a7);
end
end
Code Explaination
1. entropy function is created to calculate entrpy and inputs are defined.
2. There are 2 different set of coefficients for higher temp and lower temp range, to identify range and assign apprpriate coefficients use if_else loop, if temp is lower than or equal to mid temp, and else for higher range and wrote diff formulae.
4. Molecular Weight (M)
Molecular weight is mass of molecule of a substance, based on 12 as the atomic weight of carbon-12. It is calculated by summing the atomic weights of the atoms making up the substance molecular formula.
In this file, There are only 5 atoms are present in 53 species. They are H-1, C-12, N-14, O-16 & Ar-40.
The code to calculate molecular weight of species is as follows-
%Project1- Function for Molecular weight calculation

function M=molecular_wt(species)

atomic_smb=['H', 'C', 'N', 'O','Ar'];   % Define atomic symbols of species
atomic_wt=[1 12 14 16 40];              % Atomic weight of molecules

M=0;

%% Calculation
for i=1:length(species)           % Iterations equal to length of species
    for j=1:length(atomic_smb)    % Loop to length of atomic smb
        % Use if command to find match of species cell with atomic smb &
        % use respective atomic wt to calculate molecular wt
        if strcmp(species(i),atomic_smb(j)) % Compare strings
            M=M+atomic_wt(j);
            array_no=j;              % Remember atomic smb array no
        end
    end
    % if atom has more molecules then convert that string to number and add
    % those extra molecule's wt to the formula
    n=str2num(species(i));
    if n>1
        M=M+atomic_wt(array_no)*(n-1);
    end
end
end
Code Explaination
- molecular_wt function is created with species as variable input.
- Atomic symbols and their respective atomic weights are defined.
- Intial M is considered as 0
- To identify each atomic symbol and add its mass, for loop is created to run for length of species times. Another for loop is nested which has iterations equal to length of atomic symbol.
- Now to find match for string cell with atomic smb use strcmp command and add its atomic wt if string is matching using if_end command. store this postion of array if it has more molecules then it can be added to mass.
- If there are more than 1 molecules are used then that number is converted from string to number str2num.
- For number of molecules(n) greated than 1 if conditon used and those extra (n-1) molecules weight is added in the Molecular weight. And all loops are ended.
To find all the value and plot the graph, below is the code for the same
Main code
%% Project 1- Parsing NASA thermodynamic data

clear all
close all
clc

%% Input- Universal Gas constant R(J/mol-K)
R=8.314;

%% Open & read THERMO.dat file
f1=fopen('THERMO.dat','r');
get=fgetl(f1);              % Skipping comment

%% Read & store global temp
g_temp=fgetl(f1);           % Read global temp line
sp=strsplit(g_temp,' ');    % Splitting cell array
% Converting string cell to number & define global temp
gtemp_l=str2num(sp{2});
gtemp_m=str2num(sp{3});
gtemp_h=str2num(sp{4});
g_temp=linspace(gtemp_l, gtemp_h,1000);   % Global Temp range

% To skip next 3 comment lines use for loop for 3 iterations
for k=1:3
    fgetl(f1);
end

%% Reading and finding 14 coefficients for each species
for i=1:53
    line1=fgetl(f1);            % Read the line
    a=strsplit(line1,' ');      % Splitting cell array
    species=(a{1});             % Species identification
    % Finding local temp and converting string to num
    temp_l=str2num(a{end-3});
    temp_m=str2num(a{end-1});
    temp_h=str2num(a{end-2});
    T=linspace(temp_l,temp_h,1000);  % Local Temp range

    % Finding coeffincients
    line2=fgetl(f1);            % Get next line
    b=strfind(line2,'E');       % Find E in the line
    a1=line2(1:b(1)+3);         % Coefficient identification
    a1=str2num(a1);             % Convert string to number
    a2=line2(b(1)+4:b(2)+3);    % Next Coefficient identification
    a2=str2num(a2);             % Convert string to number
    a3=line2(b(2)+4:b(3)+3);    % Next Coefficient identification
    a3=str2num(a3);             % Convert string to number
    a4=line2(b(3)+4:b(4)+3);    % Next Coefficient identification
    a4=str2num(a4);             % Convert string to number
    a5=line2(b(4)+4:b(5)+3);    % Next Coefficient identification
    a5=str2num(a5);             % Convert string to number

    line3=fgetl(f1);            % Get next line
    c=strfind(line3,'E');       % Find E in the line
    a6=line3(1:c(1)+3);         % Coefficient identification
    a6=str2num(a6);             % Convert string to number
    a7=line3(c(1)+4:c(2)+3);    % Next Coefficient identification
    a7=str2num(a7);             % Convert string to number
    a8=line3(c(2)+4:c(3)+3);    % Next Coefficient identification
    a8=str2num(a8);             % Convert string to number
    a9=line3(c(3)+4:c(4)+3);    % Next Coefficient identification
    a9=str2num(a9);             % Convert string to number
    a10=line3(c(4)+4:c(5)+3);   % Next Coefficient identification
    a10=str2num(a10);           % Convert string to number

    line4=fgetl(f1);            % Get next line
    d=strfind(line4,'E');       % Find E in the line
    a11=line4(1:d(1)+3);        % Coefficient identification
    a11=str2num(a11);           % Convert string to number
    a12=line4(d(1)+4:d(2)+3);   % Next Coefficient identification
    a12=str2num(a12);           % Convert string to number
    a13=line4(d(2)+4:d(3)+3);   % Next Coefficient identification
    a13=str2num(a13);           % Convert string to number
    a14=line4(d(3)+4:d(4)+3);   % Next Coefficient identification
    a14=str2num(a14);           % Convert string to number

%% Calculation of Sp heat, enthalpy, entropy & Mol wt by calling function
    Cp=sp_heat(a1,a2,a3,a4,a5,a8,a9,a10,a11,a12,T,temp_m,R);
    H=enthalpy(a1,a2,a3,a4,a5,a6,a8,a9,a10,a11,a12,a13,T,temp_m,R);
    S=entropy(a1,a2,a3,a4,a5,a7,a8,a9,a10,a11,a12,a14,T,temp_m,R);
    M=molecular_wt(species);
    % Display Molecular weight
    fprintf('%2d) Molecular weight of %6s is %2d\n',i,species,M);

    %% Making new dir for each species
    dir=pwd;                                % Identify current folder
    mkdir(species);                         % Make new dir
    cd(species);                            % Current dir

    %% Plotting
    figure(1)
    plot(T,Cp,'LineWidth',2,'Color','m');   % Plot 1 Cp vs T
    grid on
    xlabel('Temperature T (K)')             % x axis label
    ylabel('Specific Heat Cp (J/mol K)')    % y axis label
    title(sprintf('%s: Specific heat vs Temperature',species),'Color','m')
    saveas(figure(1),'Cp vs T.jpg');        % Save the figure

    figure(2)
    plot(T,H,'LineWidth',2,'Color','r');    % Plot 2 H vs T
    grid on
    xlabel('Temperature T (K)')             % x axis label
    ylabel('Enthalpy H (kJ/mol)')           % y axis label
    title(sprintf('%s: Enthalpy vs Temperature',species),'Color','r')
    saveas(figure(2),'H vs T.jpg');         % Save the figure

    figure(3)
    plot(T,S,'LineWidth',2,'Color','b');    % Plot 3 S vs T
    grid on
    xlabel('Temperature T (K)')             % x axis label
    ylabel('Entropy S (J/mol K)')           % y axis label
    title(sprintf('%s: Entropy vs Temperature',species),'Color','b')
    saveas(figure(3),'S vs T.jpg');         % Save the figure

    cd(dir);                                % back to 1st current dir
end
Code Explaination
- First clear and close all previous data
- Universal gas constant value is specified
- 'fopen' command is used to open the THERMO.dat file and it's mode is defined as reading.
- use 'fgetl' command to get the line. this command used twice as first line is comment, so we need next line of global temp.
- To split cell array and seperate value use 'strsplit' command. As all temp are seperated by space, use ' ' as a delimiter.
- These split cells are still in the form of strings so convert them in numver use 'str2num' command and specify which cell to convert
- 'linspace' command is used to create temp range array.
- Next 3 line comments so used for loop for 3 iterations to skip those comment.
- From this line, data pattern is repeated. For loop is used to performed same operations in set.
- First line is splitted using strsplit command " " as delimiter. This line contains species name and local temp range for that specific species. Temp values are converted using str2num command.
- linspace command is used to define temp range from lower to high temp and is divided into 1000 number of points.
- Now in the next 3 line all coefficents are specified. There is specific pattern in which they are mentioned. First position of E in found in the line using strfind command.
- Then coefficient is identified as string in a set as numbers before and after E. And then it is converted to number.
- 2nd and 3rd line has 5 coefficients each and 4th line has 4 coefficients. All are defined in same manner.
- Now all variables are found, Calculate Cp, H, S and M by calling respective functions which were defined already.
- Molecular weight is displayed using fprintf command.
- To save all the plots in seperate folders first current folder is identified where all folder need to be dumped using pwd is given a name(dir).
- Using mkdir command new directory is made in current folder with species name to it.
- Use cd command to change directory to new species directory.
- Now graphs are plotted. figure is plot of Cp vs T. linewidth, color, xlabel,ylabel and title are given to graph.
- Figure is saved automatically in current new folder using saveas command.
- In similar manner plots for H and S are saved with appropriate title and labels.
- After saving all the plots for that species, current directory is changed back to 1st current directory so that in next loop, new species folder is created and same process is followed.
- So for next 52 species same process is followed and loop will end after that.
Outputs
1. Molecular Weights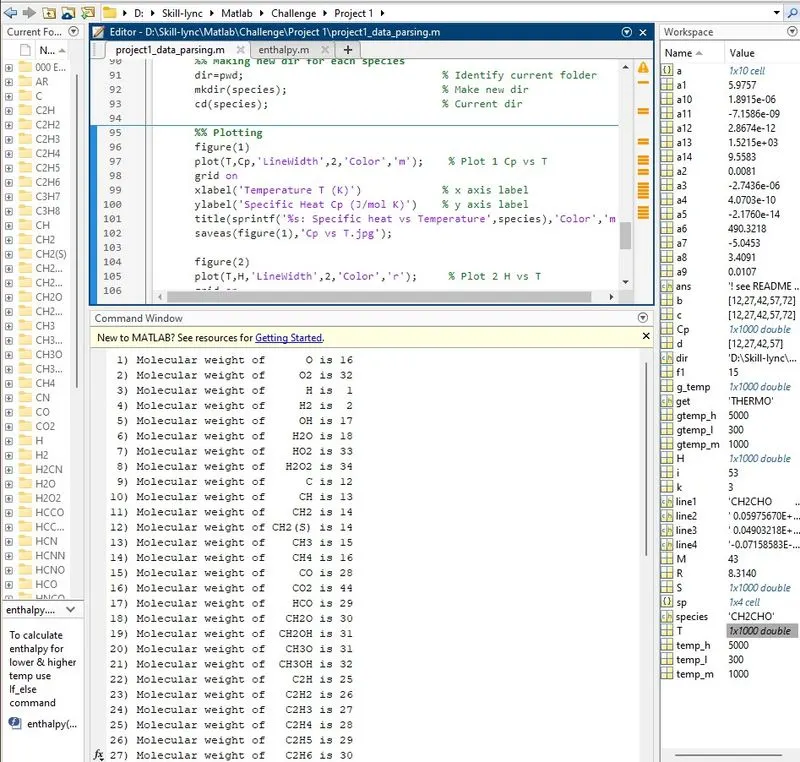
2. Screenshot of window of all folders saved
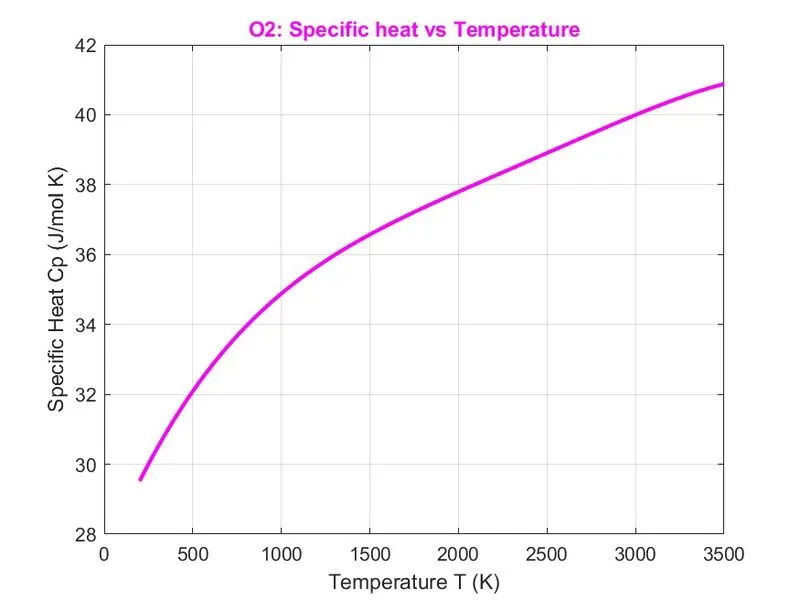
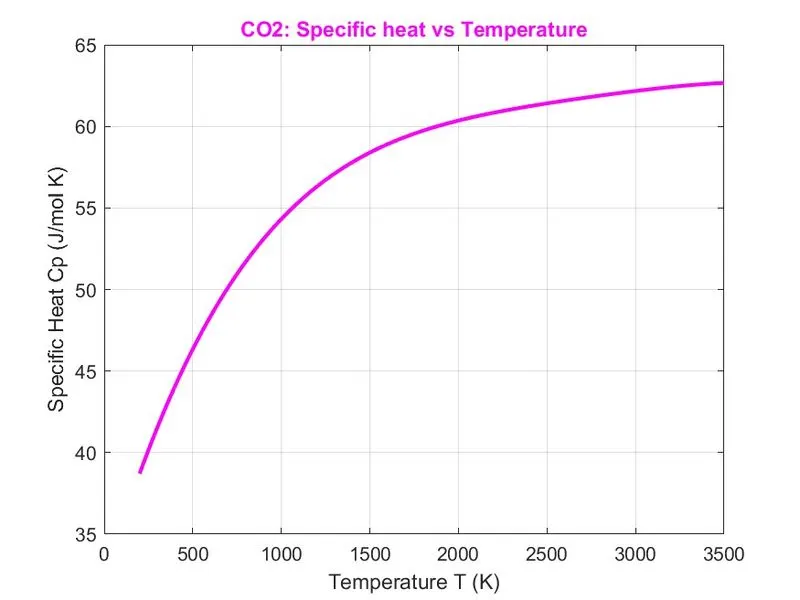
3. Plots for O2, N2 & CO2
- O2: Cp vs T
O2: H vs T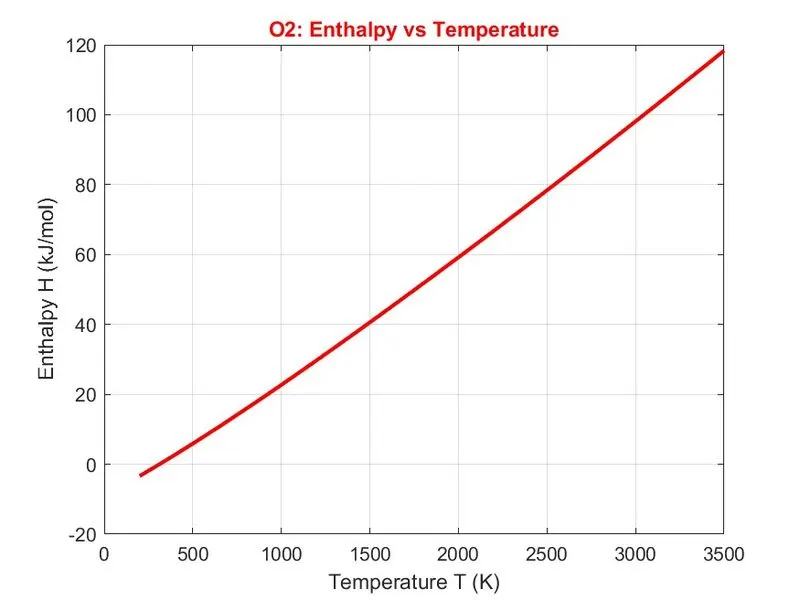
O2: S vs T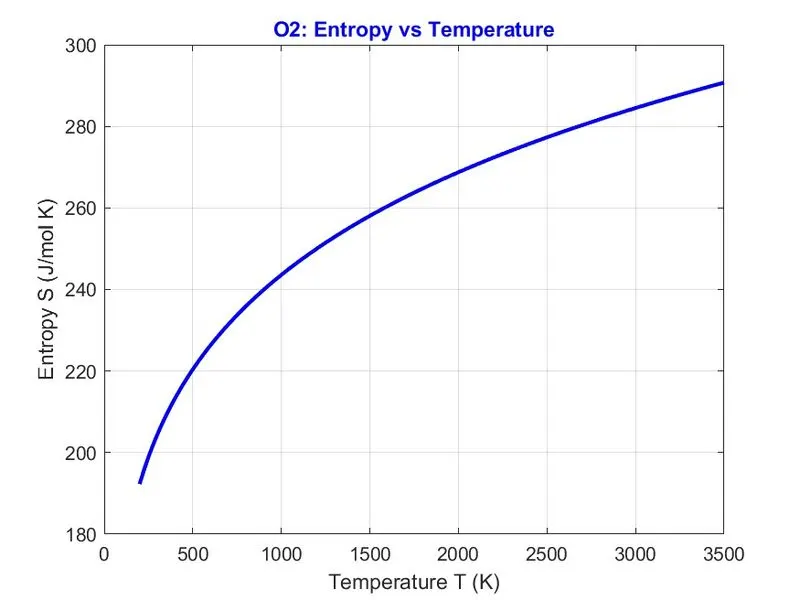
- N2: Cp vs T
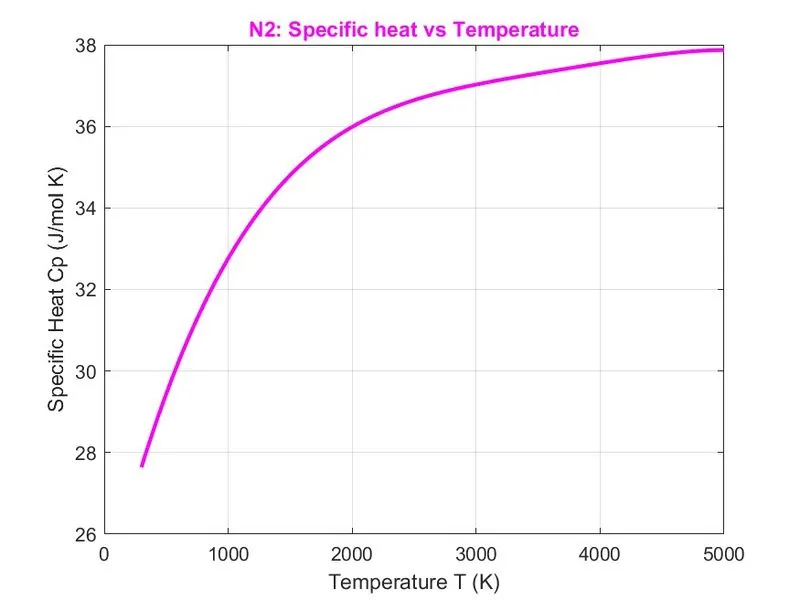
N2: H vs T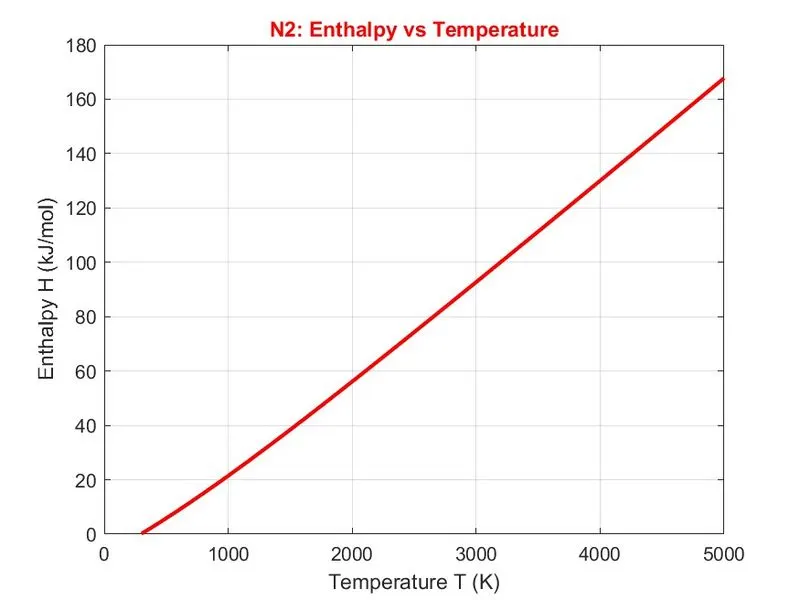
N2: S vs T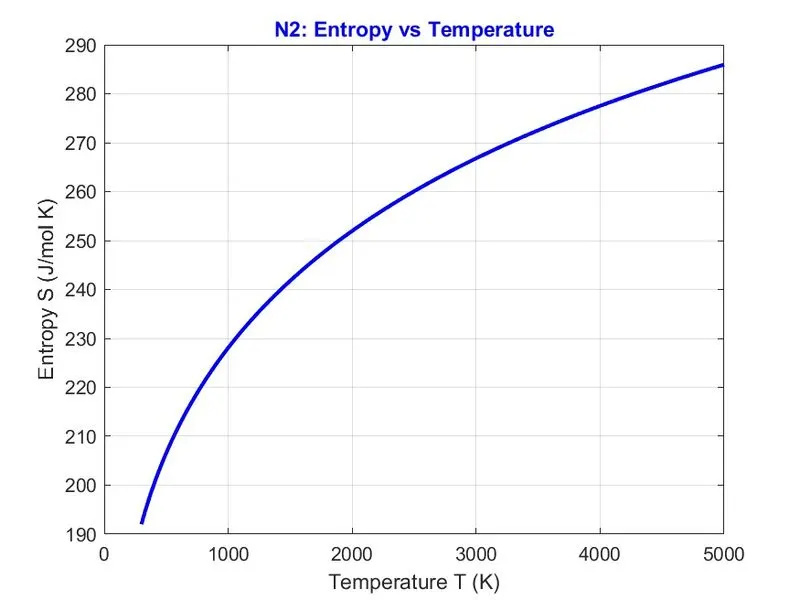
- CO2: Cp vs T
CO2: H vs T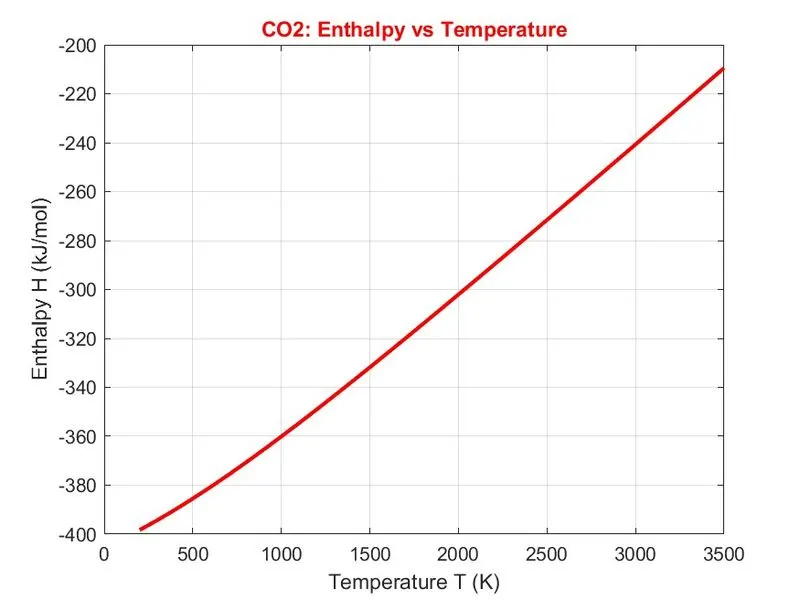
CO2: S vs T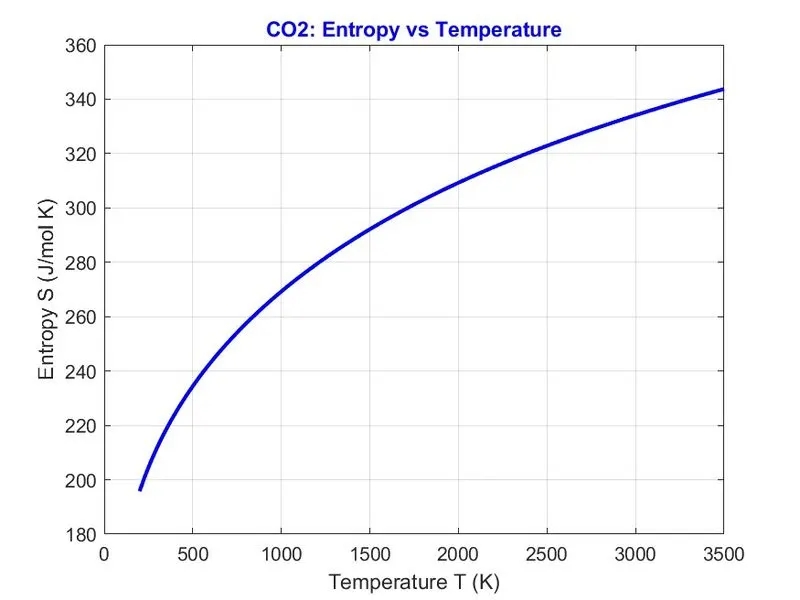
Conclusions
Using different command in MATLAB, all the coeffiecients, local temperature of all the species are extracted from NASA's THERMO.dat file. Using NASA Polynomials, Specific heat, enthalpy and entropy are calculated, plotted and saved all data in respective species folder successfully. Function is created to calculate molecular weight of all the species in the study.
Errors
- In 1st attempt, global low, mid and high temp were not showing correct. Found that there was space at the start of the string so that was counted in array. To get correct temp values just changed array nos 1,2,3 to 2,3,4.
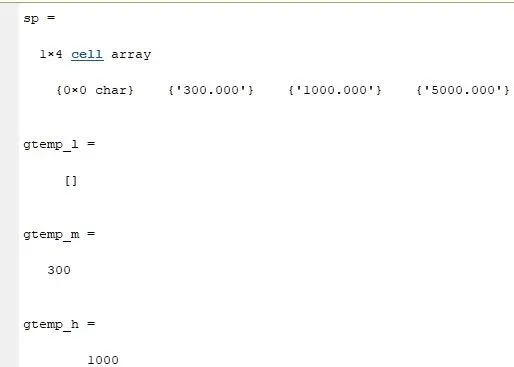
- Code was stopping at the specific heat function, showing Too many output arguments as a error in the function. (See image)
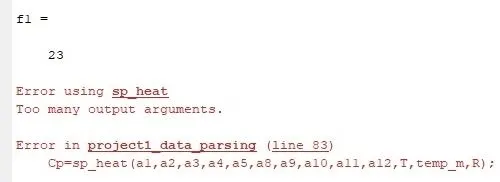
After checking specific heat function, realised that variable name Cp was missing for the function.
function Cp=sp_heat(a1,a2,a3,a4,a5,a8,a9,a10,a11,a12,T,temp_m,R) 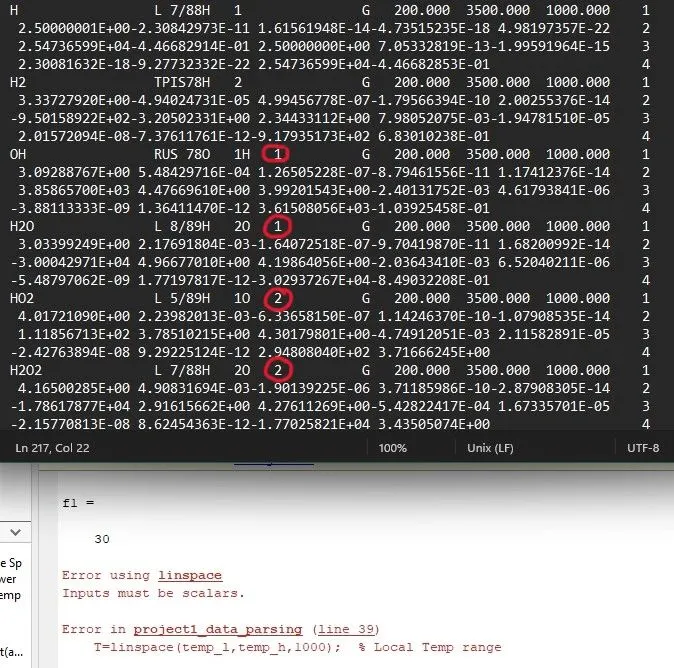
Program was running correctly till 5th iteration then this error was popping in the command window. After opening THERMO.dat file found that there were some additional entries the line 1, because of that temp cell wasn't captured correctly. To skip those unnecessary entry, changed the formula to find local temp range. Located those values from the end .
.- Initially All the plots in the folder were saved blank. Because of wrong syntax used to name the figure('Name','Cp vs T').
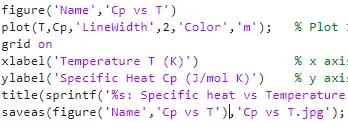
After correcting code as figure(1) in both places, figures were saved properly.
References
- https://docsumo.com/blog/what-is-data-parsing
- http://combustion.berkeley.edu/gri-mech/data/nasa_plnm.html
- https://www.britannica.com/science/specific-heat
- https://www.britannica.com/science/enthalpy
- https://www.britannica.com/science/entropy-physics
- https://www.mathworks.com/help/matlab/ref/mkdir.html
- https://www.mathworks.com/help/matlab/ref/cd.html?s_tid=doc_ta
- https://in.mathworks.com/help/matlab/ref/pwd.html?s_tid=doc_ta
- https://in.mathworks.com/help/matlab/ref/saveas.html?s_tid=doc_ta
- https://in.mathworks.com/matlabcentral/answers/86131-using-if-else-statements-to-find-molecular-weight-of-compounds-given-the-info-from-a-string
- https://overiq.com/c-programming-101/the-strcmp-function-in-c/
- https://stackoverflow.com/questions/26559483/finding-molar-mass-with-matlab