Project 1 - Parsing NASA thermodynamic data
AIM : 1. Write a function that extracts the 14 co-efficients and calculates the enthalpy, entropy and specific heats for all the species in the data file.
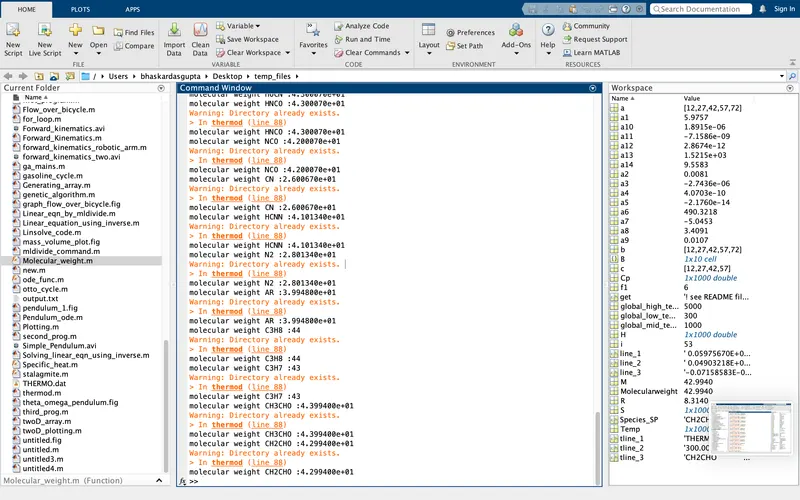
2. Calculate the molecular weight of each species and display it in the command window.
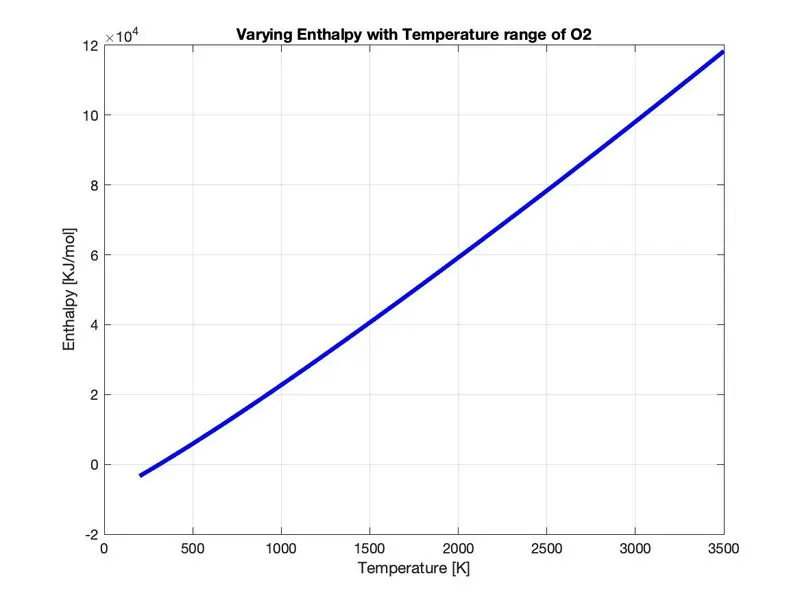
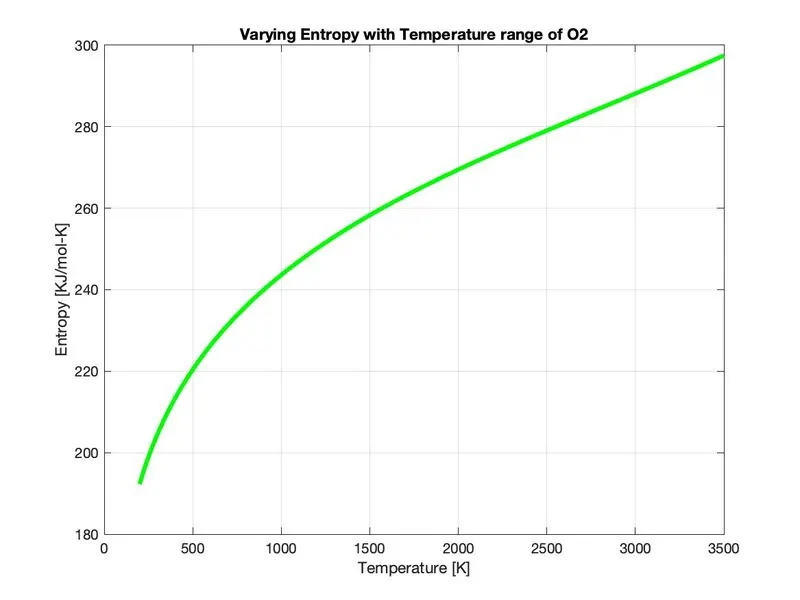
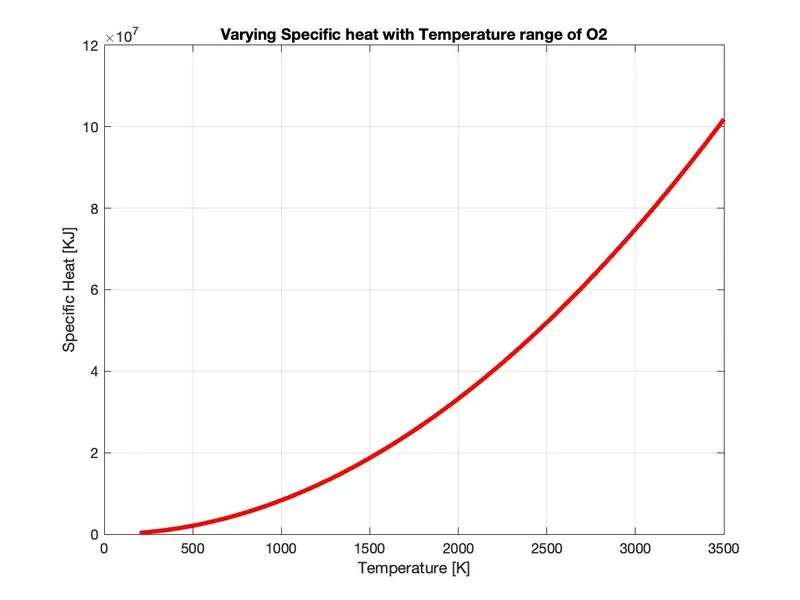
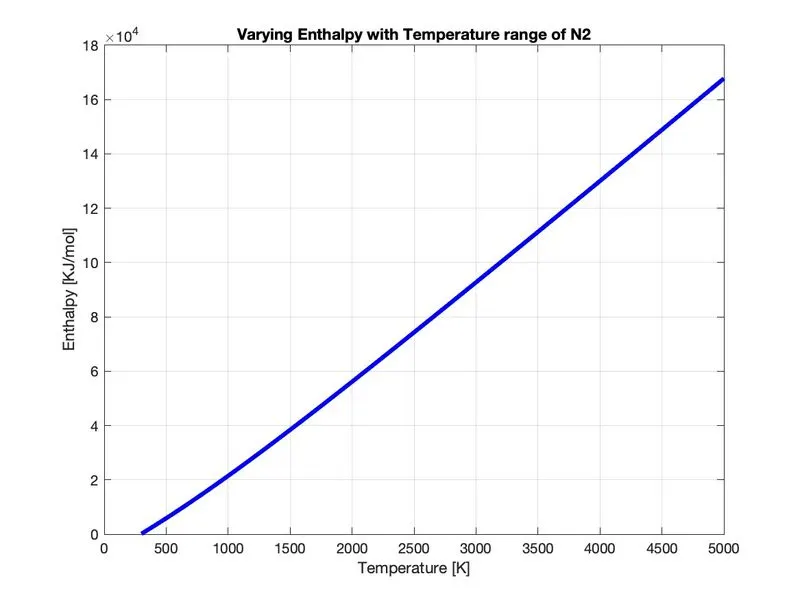
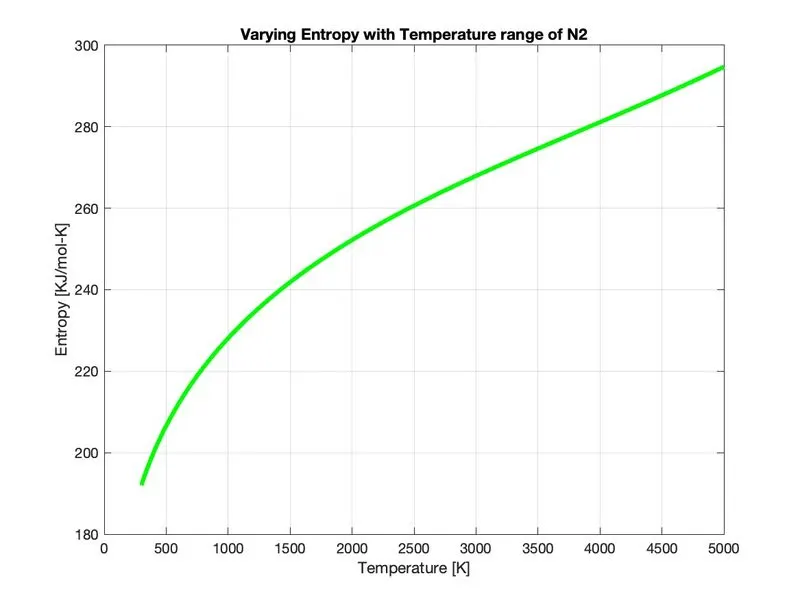
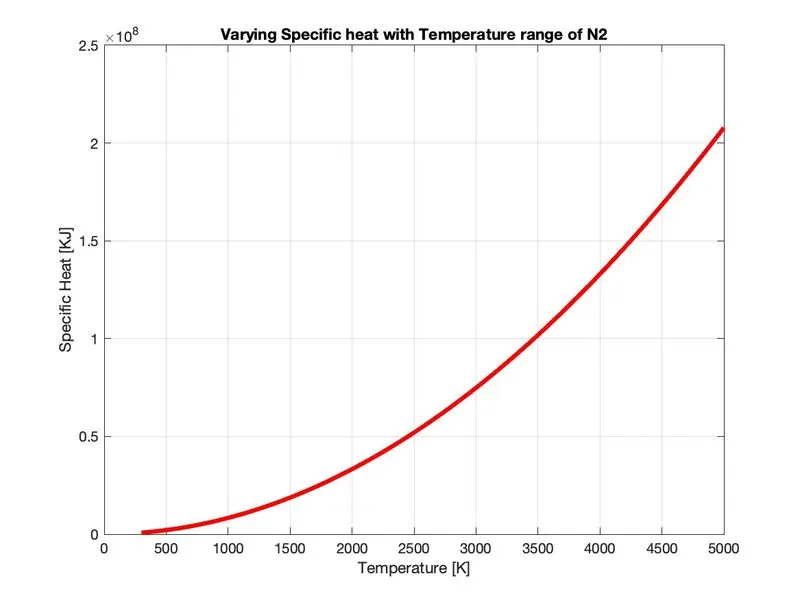
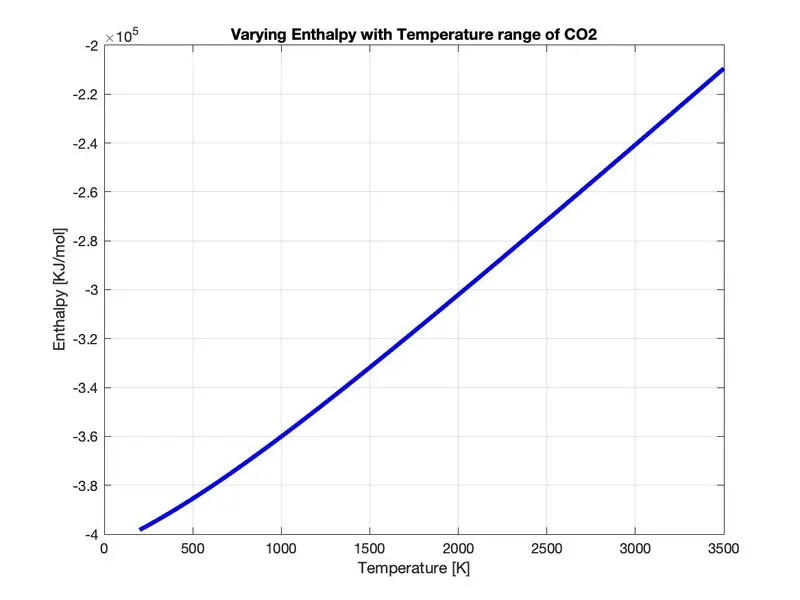
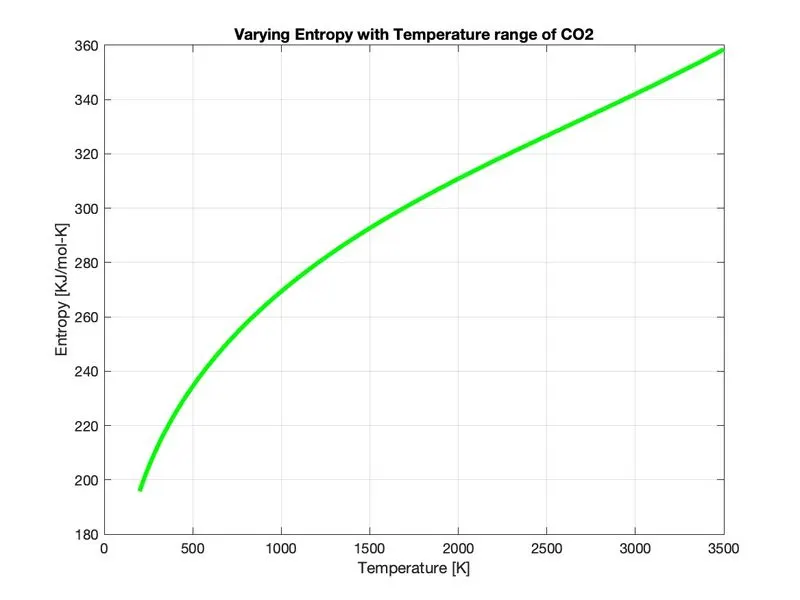
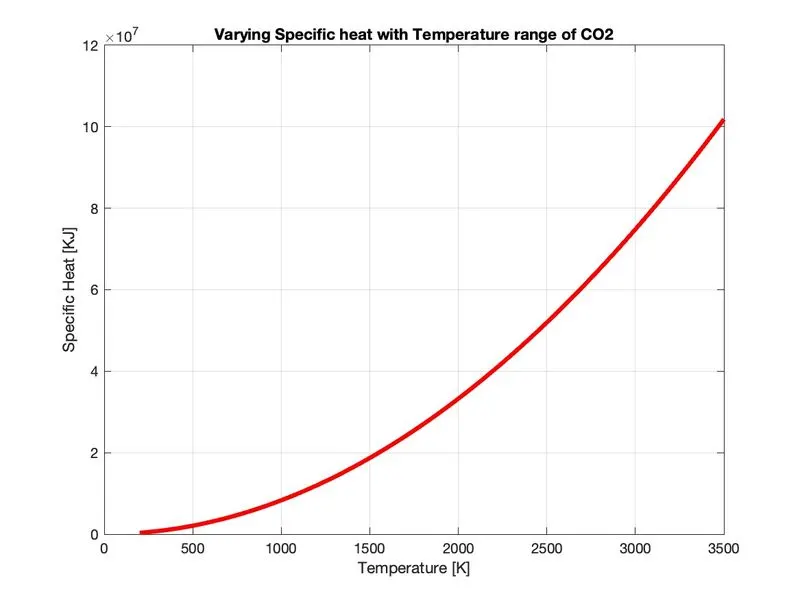
3. Plot the Cp, Enthalpy and Entropy for the local temperature range (low temperature : high temperature) specific for each species.
4. Save the plots as images with appropriate names and dump them in separate folders for each species with suitable name. All these should be generated automatically.
5. Generate Cp, H and S plots.
THEORY :
FILE PARSING : File Parsing is any information that reads from a particular text file or any type of file and how that information can be used in a computer program.
FILE WRITING : It is the process of writing data to a particular file with the write mode ‘w’.
FILE READING : File reading is kind a reverse of file writing. Let us say, someone gives you simulation data in the form of an input file, how would we read that data and how would we take the content of that data and use it. It is written with the mode ‘r’.
NASA THERMODYNAMIC DATA : NASA came up with polynomials that can be used to evaluate thermodynamic properties such as Cp, H and S. They have also documented the co-efficients that are required to evaluate these polynomials for 1000+ species but here we are dealing with only 53 species.
SPECIFIC HEAT : Specific heat is the amount of heat required to increase the temperature of 1kg of substance through 1 deg Celsius.
Cp = (a1 + a2T + a3T^2 + a4T^3 + a5T^4)*R
Function code for Specific heat :
% Specific heat calculation

function Cp = Specific_heat(a1,a2,a3,a4,a5,a8,a9,a10,a11,a12,Temp,R,global_mid_temp)
% Compairing with Global temperature
% If less than global temperature - minimum coefficients are taken
if Temp <= global_mid_temp
    Cp = R*(a8+(a9.*Temp)+(a10+(Temp).^2)+(a11.*(Temp).^3)+(a12.*(Temp).^4));
else

    Cp = R*(a1+(a2.*Temp)+(a3+(Temp).^2)+(a4.*(Temp).^3)+(a5.*(Temp).^4));
 % Else maximum coefficients are taken
end
ENTROPY : Between two state points, if number of reversible paths are there , then, the quantity (dQ/T)rev for each reversible path is same and this quantity (dQ/T)rev known as Entropy.
Since Entropy is a property, it does not depends on the path followed by the system as long as end points are same, Entropy is also same for reversible as well as Irreversible process.
S = (a1lnT + a2T + a3T^2/2 + a4T^3/3 + a5T^4/4 + a7)*R
Function code for Entropy :
% Calculation of Entropy function

function S = Entropy_calc(a1,a2,a3,a4,a5,a7,a8,a9,a10,a11,a12,a14,Temp,R,global_mid_temp)

if Temp <= global_mid_temp

    S = R *(a8.*log(Temp) + (a9.*Temp) + (a10.*(Temp.^2)/2) + (a11.*(Temp.^3)/3) + (a12.^(Temp.^4)/4) + a14);
else
    S = R *(a1.*log(Temp) + (a2.*Temp) + (a3.*(Temp.^2)/2) + (a4.*(Temp.^3)/3) + (a5.^(Temp.^4)/4) + a7);
end
ENTHALPY : Enthalpy is the sum of the internal energy. and pressure times volume. We cannot measure the enthalpy of a system, but we can look at changes in enthalpy.
H = (a1 + a2T/2 + a3T^2/3 + a4T^3/4 + a5T^4/5 + a6/T)*R*T
Function code for Enthalpy :
% Calculation of Enthalpy function

function H = Enthalpy(a1,a2,a3,a4,a5,a6,a8,a9,a10,a11,a12,a13,Temp,R,global_mid_temp)

if Temp <= global_mid_temp
    H = R*Temp.*(a8 + (a9*Temp/2) + (a10*(Temp.^2)/3) + (a11*(Temp.^3)/4) + (a12*(Temp.^4)/5) + (a13./Temp));
else
    H = R*Temp.*(a1 + (a2*Temp/2) + (a3*(Temp.^2)/3) + (a4*(Temp.^3)/4) + (a5*(Temp.^4)/5) + (a6./Temp));
end
MOLECULAR WEIGHT : The molecular mass is the mass of a given molecule which is measured in dalton. Different molecules of the same compound may have different molecular masses because they contain different isotopes of an element.
Function code for Molecular Weight :
% Calculation of Molecular Weight function

function Molecularweight = Molecular_weight(Species_SP)

% Storing value
compound_name = (Species_SP);

% Creating an array of elements
elements_name = ['C','H','O','N','A'];

% Storing atomic mass value in the array
value_at = [12 1 15.994 14.0067 39.948];

% Assigning molecular mass as 0
Molecularweight = 0;

% Creating loop
for i = 1:length(compound_name)
    for j = 1:length(elements_name)

        % Compairing string value
        if strcmp(compound_name(i),elements_name(j))

            %If above comparision is true, value of molecular mass is
            %calculated
            Molecularweight = Molecularweight + value_at(j);

            % Storing the position for further use
            pos = j;
        end
    end

    % Converting the string to number
    k = str2num(compound_name(i));

    % Compairing if the value of k is greater than executed, the further
    % statements
    if (k>1)

        % Molecular mass calculation
        Molecularweight = Molecularweight + value_at(pos)*(k-1);
    end
end
fprintf('molecular weight %s :',Species_SP);
fprintf('%d',Molecularweight);
disp(' ');
end
MAIN CODE :
clear all
close all
clc

f1 = fopen('THERMO.dat','r')
tline_1 = fgetl(f1)
tline_2 = fgetl(f1)


R = 8.314;      % (Universal Gas Constant in KJ/Kmol-K)

for i = 1:3
    get = fgetl(f1)
end

for i = 1:53
tline_3 = fgetl(f1);
B = strsplit(tline_3,' ');
Species_SP = (B{1});

% Taking all the local temperatures

global_low_temp = str2num(B{end-3});
global_mid_temp = str2num(B{end-1});
global_high_temp = str2num(B{end-2});
Temp = linspace(global_low_temp,global_high_temp, 1000);
line_1 = fgetl(f1)

% Finding or extracting species

a = findstr(line_1,'E')

a1 = line_1(1:a(1)+3)          %1
a1 = str2num(a1)
a2 = line_1(a(1)+4:a(2)+3)     %2
a2 = str2num(a2)
a3 = line_1(a(2)+4:a(3)+3)     %3
a3 = str2num(a3)
a4 = line_1(a(3)+4:a(4)+3)     %4
a4 = str2num(a4)
a5 = line_1(a(4)+4:a(5)+3)     %5
a5 = str2num(a5)

line_2 = fgetl(f1)
b = findstr(line_2,'E')

a6 = line_2(1:b(1)+3)          %6
a6 = str2num(a6)
a7 = line_2(b(1)+4:b(2)+3)     %7
a7 = str2num(a7)
a8 = line_2(b(2)+4:b(3)+3)     %8
a8 = str2num(a8)
a9 = line_2(b(3)+4:b(4)+3)     %9
a9 = str2num(a9)
a10 = line_2(b(4)+4:b(5)+3)    %10
a10 = str2num(a10)

line_3 = fgetl(f1)
c = findstr(line_3,'E')

a11 = line_3(1:c(1)+3)         %11
a11 = str2num(a11)
a12 = line_3(c(1)+4:c(2)+3)    %12
a12 = str2num(a12)
a13 = line_3(c(2)+4:c(3)+3)    %13
a13 = str2num(a13)
a14 = line_3(c(3)+4:c(4)+3)    %14
a14 = str2num(a14)

% Calculate specific heat
Cp = Specific_heat(a1,a2,a3,a4,a5,a8,a9,a10,a11,a12,Temp,R,global_mid_temp);

% Calculate Entropy
S = Entropy_calc(a1,a2,a3,a4,a5,a7,a8,a9,a10,a11,a12,a14,Temp,R,global_mid_temp);

% Calculate Enthalpy
H = Enthalpy(a1,a2,a3,a4,a5,a6,a8,a9,a10,a11,a12,a13,Temp,R,global_mid_temp);

% Calculate Molecular weight of the Species
Molecularweight = Molecular_weight(Species_SP);


% Plotting(Cp,H,S,Temp,Species_SP)
% Saving a folder


mkdir(Species_SP)
cd(Species_SP)

% Plot 1, Specific heat(Cp) vs Temperature Range(Temp)

figure(1)
plot(Temp,Cp,'LineWidth',3,'Color','r');
xlabel('Temperature [K]');
ylabel('Specific Heat [KJ]');
title(sprintf('Varying Specific heat with Temperature range of %s',Species_SP));
grid on
saveas(figure(1),'Specific Heat.jpg');

% Plot 2, Enthalpy(H) vs Temperature range (Temp)

figure(2)
plot(Temp,H,'LineWidth',3,'Color','b');
xlabel('Temperature [K]');
ylabel('Enthalpy [KJ/mol]');
title(sprintf('Varying Enthalpy with Temperature range of %s',Species_SP));
grid on
saveas(figure(2),'Enthalpy.jpg');

% Plot 3, Entropy(S) vs Temperature range (Temp)

figure(3)
plot(Temp,S,'LineWidth',3,'Color','g');
xlabel('Temperature [K]');
ylabel('Entropy [KJ/mol-K]');
title(sprintf('Varying Entropy with Temperature range of %s',Species_SP));
grid on
saveas(figure(3),'Entropy.jpg');

cd ..

% Molecular weight

M = Molecular_weight(Species_SP);


end
EXPLANATION AND SYNTAX:
- First of all, we used clear all, close all and clc command to clear all the previous data.
- Loading the ‘THERMO.dat’ file through file reading mode.
- Reading and loading each lines step by step through ‘fgetl’ command.
- Skipping the three statement lines using for loop.
- Running the for loop again for all the 53 species.
- Taking and acknowledging all three local temperatures as asked in the question.
- Extracting species through ‘findstr’ command and finding all the coefficients while changing it from string to number through ‘str2num’ command.
- Calculating all the values for different species of specific heat, entropy and enthalpy through their respective function code.
- Plotting the graph for each and every species of Cp, S and H.
- And also calculating their respective molecular weight.
Fopen : It is used to open any file.
‘r’ : It is used for reading of any file that is opened.
Fgetl : It is used to extract lines from the file step by step.
Strsplit : Splitting of string at specified delimiter.
Str2num : It is used to convert any string into number.
Findstr : Find one string within another.
Linspace : To generate equally spaced vectors.
Fprintf : Write formatted data to file.
Mkdir : To make new directory.
Cd : To change working directory.
OUTPUT AND RESULTS :
1. Screenshot of all the folders have been attached.
2. Molecular weight of each and every species have been found.
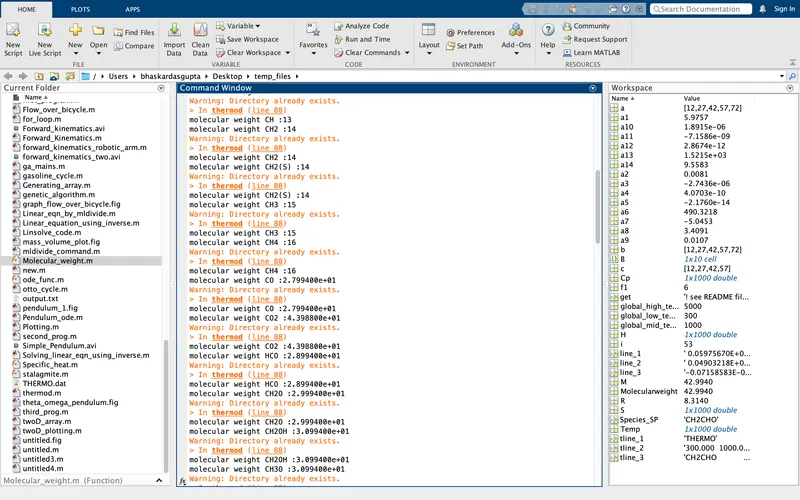
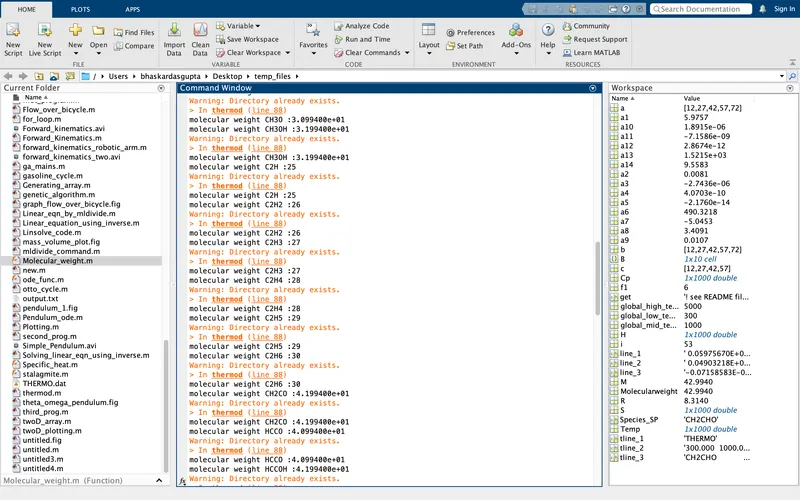
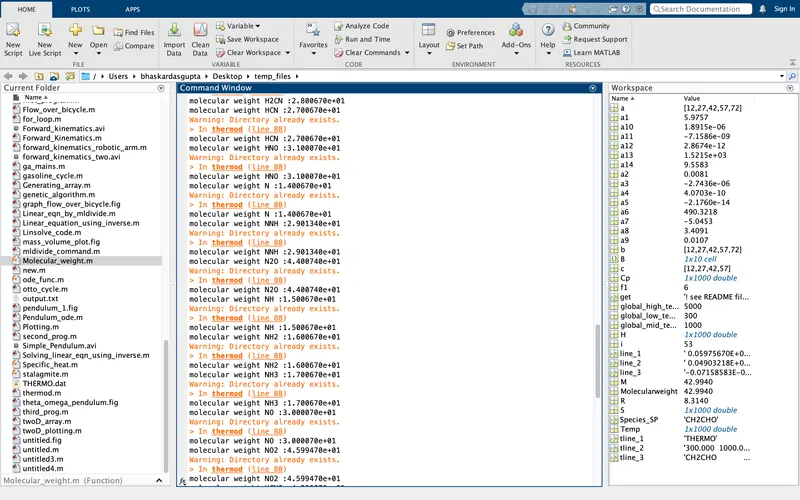
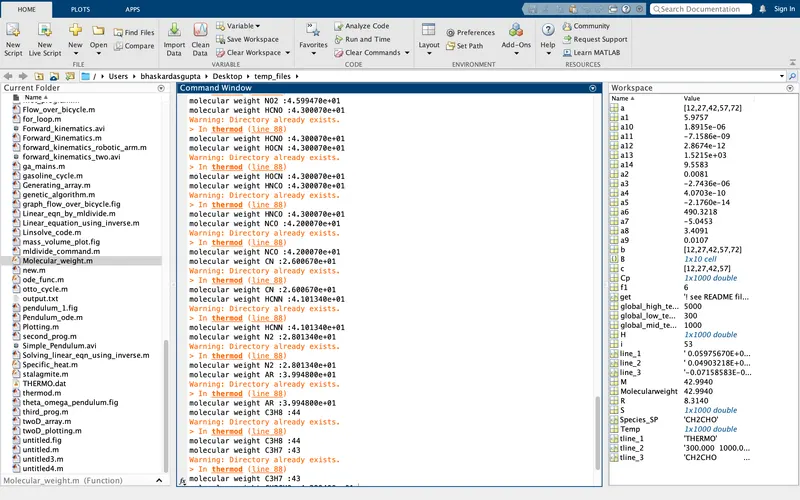
3. Plot for O2, N2 and CO2 species have been attached.
O2 - ENTHALPY
O2 - ENTROPY
O2 - SPECIFIC HEAT
N2 - ENTHALPY
N2 - ENTROPY
N2 - SPECIFIC HEAT
CO2 - ENTHALPY
CO2 - ENTROPY
CO2 - SPECIFIC HEAT
ERRORS :
Not any major errors occured while programming except some minor.
CONCLUSION :
Using MATLAB, all the coefficients of the species have been found, also calculated the molecular weight for different species and have plotted all the graphs for varying enthalpy, entropy and specific heat against the local temperatures.
REFERNECES :
1. https://in.mathworks.com/help/matlab/ref/fprintf.html
2. https://in.mathworks.com/matlabcentral/answers/17580-how-to-define-a-path-in-saveas-command