Project 1 - Parsing NASA thermodynamic data
PARSING NASA THERMODYNAMIC DATA
AIM : The objective here is to extract data from a given file and utilize it to solve the polynomials that NASA created. Using which, have to plot graphs of Specific heat, Enthalpy and Entropy against Temperature.
Also, have to calculate molecular mass for all the species available in data file.
The inputs we are provided with are the polynimials and data file.
Below shown is a part of data file. As shown a global temperature range is given. Following it are the species blocks, which are comprised of species name, temperaure range and 14 co-efficients.
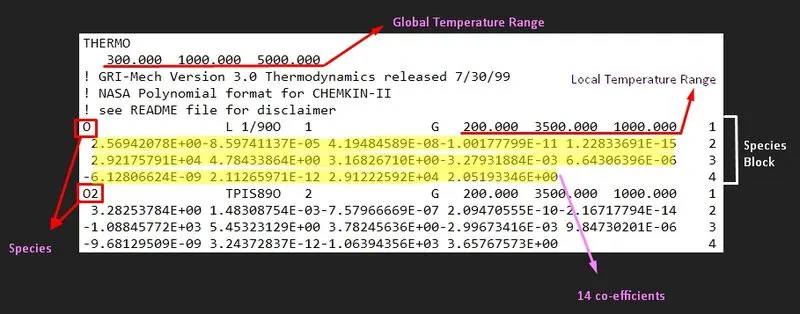
Now, by following the steps, parse all the necessary data and use them later to calculate parameters :
- First of all, use 'fopen' command to read the data file.
- Use 'fgetl' to load the data line by line. Skip the unwanted lines.
- Convert the string into numbers and define the global temperature values.
- Now, to extract data from species block, use a 'for loop' for easy working. Follow the same way and define species name, local temperature values and co-efficients. These values are very important as we will calculate the parameters for this local range only.
- Given is that the first 7 co-efficients are high temperature co-efficients and other 7 are low temperature co-efficients.
- Define two ranges as low and high temperature.
- Evaluate the polynomials by putting the temperature and co-efficient values.
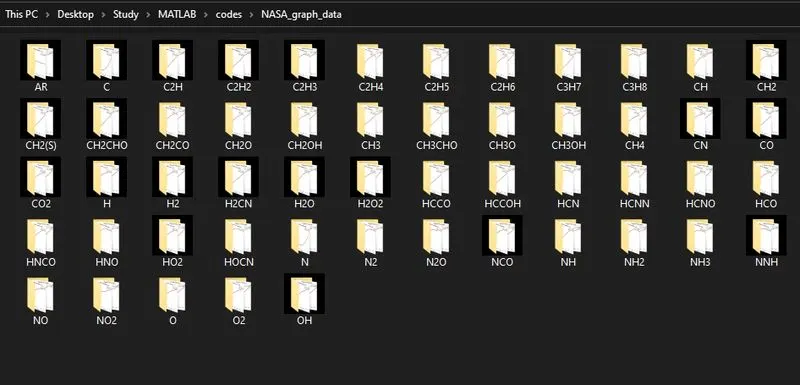
- Now, before plotting these results, create a new folder where the graphs can be saved automatically. Command to read the new folder and change path as well.
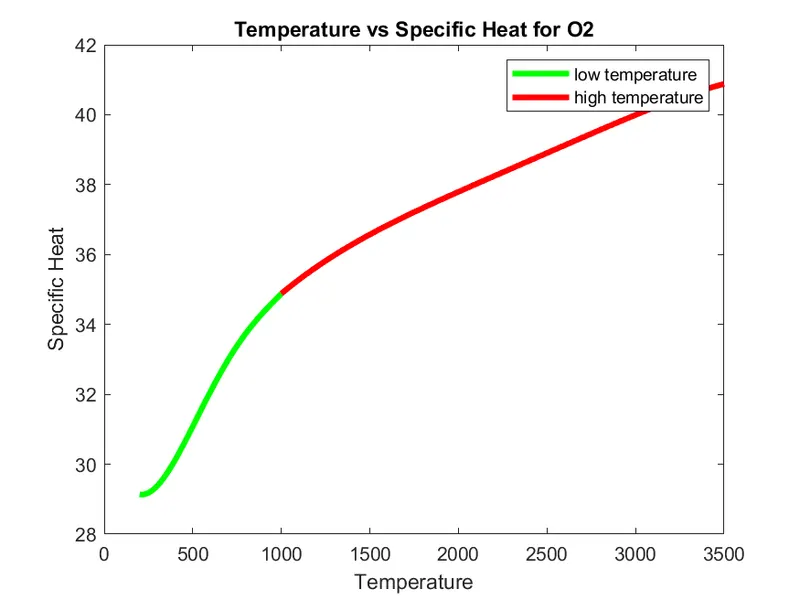
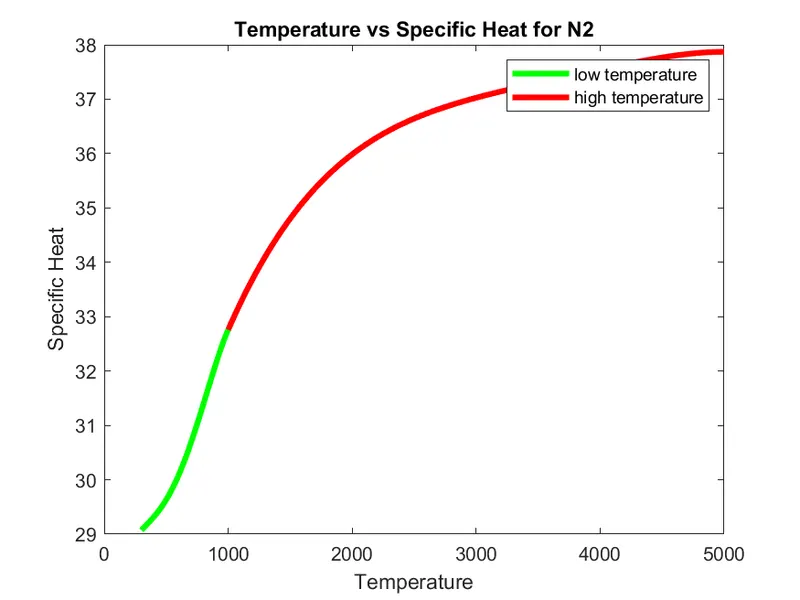
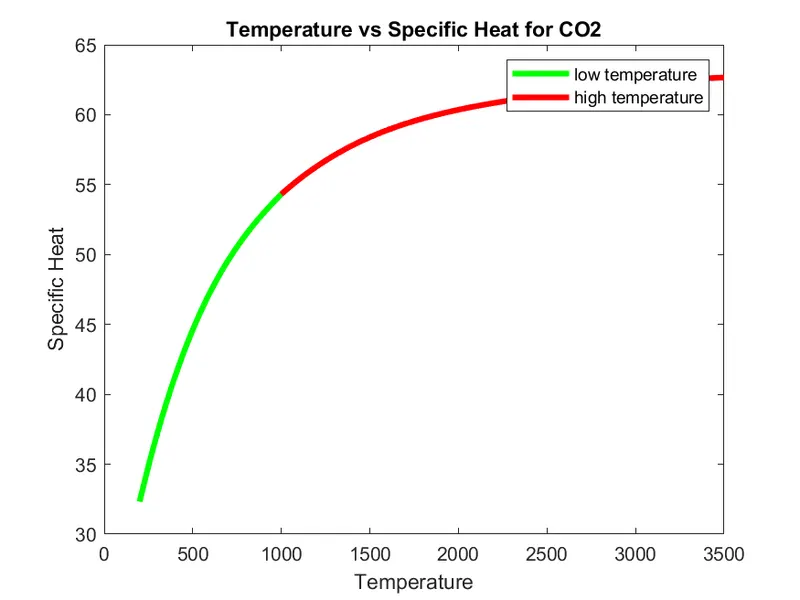
- Now, plot graphs for Temperature vs Specific Heat. Make sure to plot the values of Cp for both lower and higher temperature range in the same figure only.
- Save the figure in the directed folder and with specific name as shown in code.
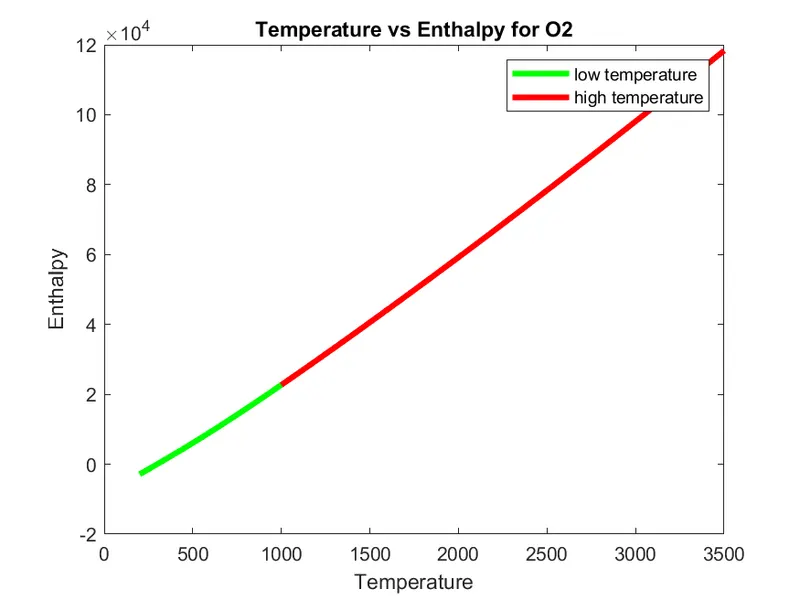
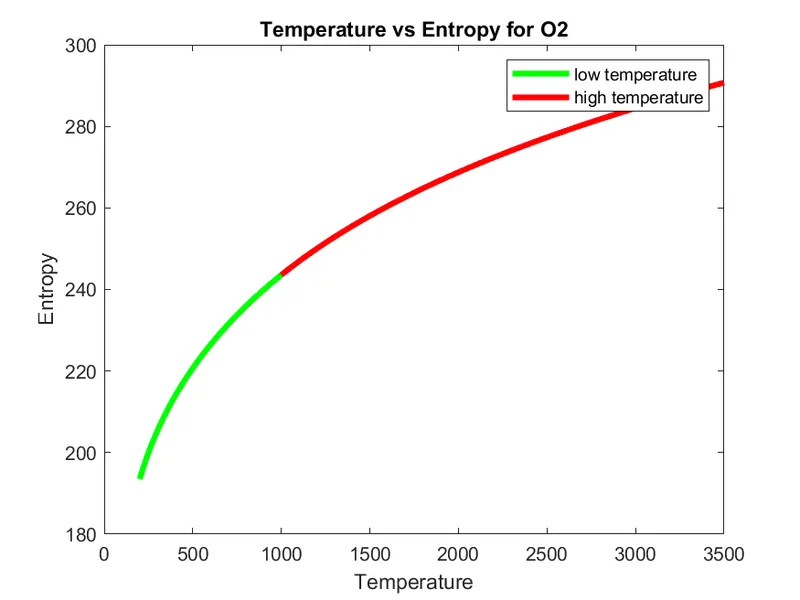
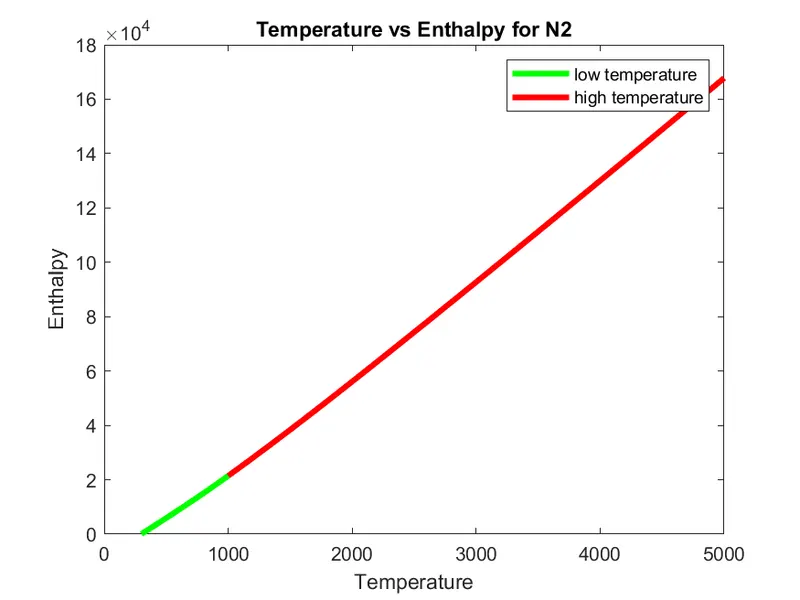
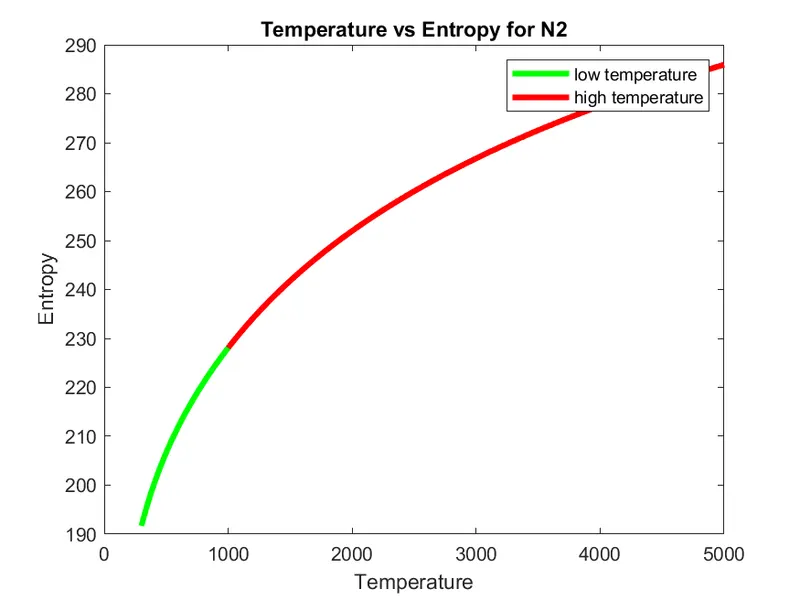
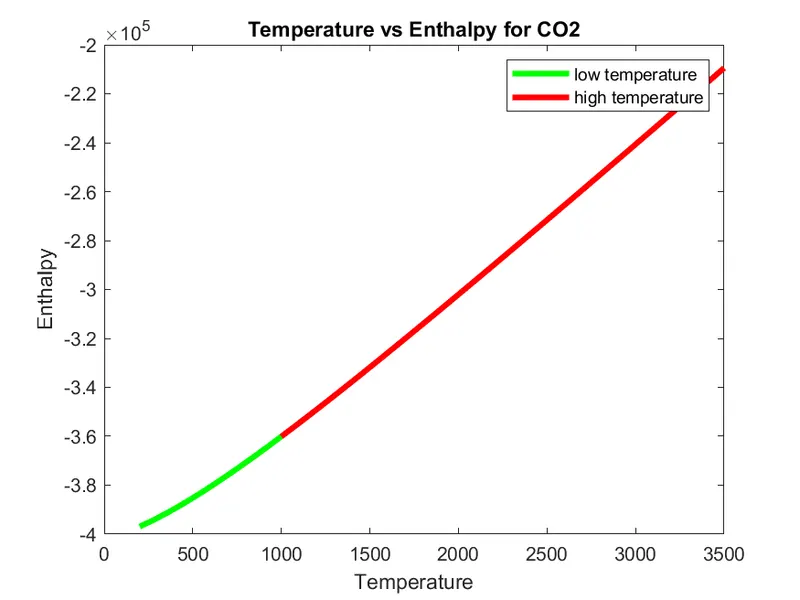
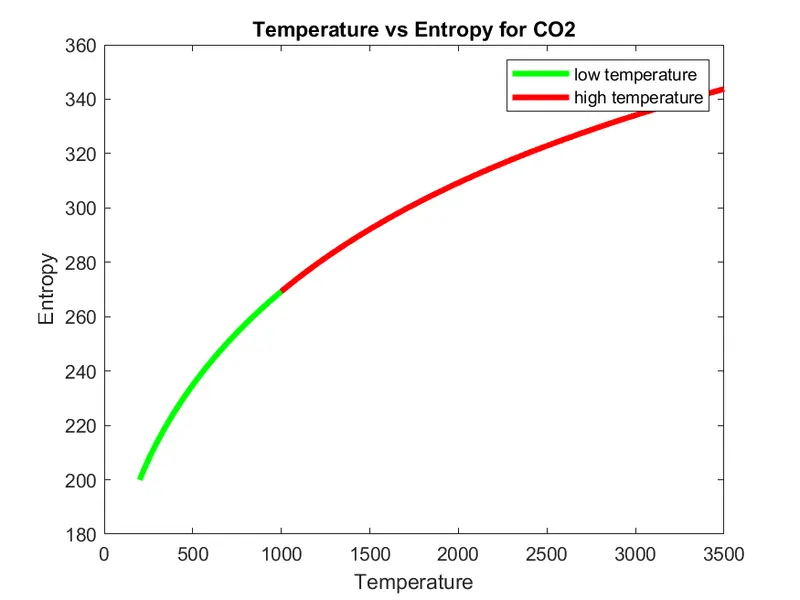
- Similarly, plot graphs for Enthalpy and Entropy against Temperature.
% Parsing NASA thermodynamics data

clc, clear, close all

f = fopen('THERMO.dat','r');                  % load data file
L1 = fgetl(f);                                % skip title line
L2 = fgetl(f);                                % load temperature line
global_temp = str2num(L2);                    % convert string into numbers
global_low_temp = global_temp(1);
global_mid_temp = global_temp(2);
global_high_temp = global_temp(3);

L3 = fgetl(f);                                % skip instruction lines
L4 = fgetl(f);
L5 = fgetl(f);


% load species name, local temperature and co-efficient values data

for i = 1:53                                  % becuase 53 elements in data file

    l1 = fgetl(f);                            % load title line of species block
    u = strsplit(l1,' ');                     % split elements
    species_name = u{1};                      % define species/element

    low_temp = u{end-3};                      % define local temperature values
    local_low_temp = str2double(low_temp);
    mid_temp = u{end-1};
    local_mid_temp = str2double(mid_temp);
    high_temp = u{end-2};
    local_high_temp = str2double(high_temp);

    l2 = fgetl(f);                            % define co-efficient values
    a = strfind(l2,'E');
    a1 = str2double(l2(1:a(1)+3));
    a2 = str2double(l2(a(1)+4:a(2)+3));
    a3 = str2double(l2(a(2)+4:a(3)+3));
    a4 = str2double(l2(a(3)+4:a(4)+3));
    a5 = str2double(l2(a(4)+4:a(5)+3));

    l3 = fgetl(f);
    b = strfind(l3,'E');
    a6 = str2double(l3(1:b(1)+3));
    a7 = str2double(l3(b(1)+4:b(2)+3));
    a8 = str2double(l3(b(2)+4:b(3)+3));
    a9 = str2double(l3(b(3)+4:b(4)+3));
    a10 = str2double(l3(b(4)+4:b(5)+3));

    l4 = fgetl(f);
    c = strfind(l3,'E');
    a11 = str2double(l4(1:c(1)+3));
    a12 = str2double(l4(c(1)+4:c(2)+3));
    a13 = str2double(l4(c(2)+4:c(3)+3));
    a14 = str2double(l4(c(3)+4:c(4)+3));


    % define lower and higher temperature ranges
    T1 = linspace(local_low_temp,local_mid_temp,150);   % lower temperature
    T2 = linspace(local_mid_temp,local_high_temp,150);  % higher temperature

    % universal gas constant (J/mol.K)
    R = 8.314;

    % calculate Specific Heat(Cp), Enthanpy(H) and Entropy(S)
    for j = 1:150
        Cp_1(j) = (a8 + a9*T1(j) + a10*T1(j)^2 + a11*T1(j)^3 + a12*T1(j)^4)*R;
        H_1(j) = (a8*T1(j) + ((a9*T1(j)^2)/2) + ((a10*T1(j)^3)/3) + ((a11*T1(j)^4)/4) + ((a12*T1(j)^5)/5) + a13).*R;
        S_1(j) = (a8*log(T1(j)) + a9*T1(j) + ((a10*T1(j)^2)/2) + ((a11*T1(j)^3)/3) + ((a12*T1(j)^4)/4) + a14).*R;

        Cp_2(j) = (a1 + a2*T2(j) + a3*T2(j)^2 + a4*T2(j)^3 + a5*T2(j)^4)*R;
        H_2(j) = (a1*T2(j) + ((a2*T2(j)^2)/2) + ((a3*T2(j)^3)/3) + ((a4*T2(j)^4)/4) + ((a5*T2(j)^5)/5) + a6).*R;
        S_2(j) = (a1*log(T2(j)) + a2*T2(j) + ((a3*T2(j)^2)/2) + ((a4*T2(j)^3)/3) + ((a5*T2(j)^4)/4) + a7).*R;
    end


    % make folder to store plot data
    mkdir(species_name)
    current_dir = pwd;
    cd(species_name)


    % Plot Temperature vs Specific Heat data
    figure(1)
    plot(T1,Cp_1,'LineWidth',3,'Color','g')
    hold on
    plot(T2,Cp_2,'LineWidth',3,'Color','r')
    hold off
    xlabel 'Temperature'
    ylabel 'Specific Heat'
    legend('low temperature','high temperature')
    title(['Temperature vs Specific Heat for ',species_name])
    fig = sprintf('Cp_of_%s.png',species_name);
    saveas(gca,fig)

    % Plot Temperature vs Enthalpy data
    figure(2)
    plot(T1,H_1,'LineWidth',3,'Color','g')
    hold on
    plot(T2,H_2,'LineWidth',3,'Color','r')
    hold off
    xlabel 'Temperature'
    ylabel 'Enthalpy'
    legend('low temperature','high temperature')
    title(['Temperature vs Enthalpy for ',species_name])
    fig = sprintf('H_of_%s.png',species_name);
    saveas(gca,fig)


    % Plot Temperature vs Entropy data
    figure(3)
    plot(T1,S_1,'LineWidth',3,'Color','g')
    hold on
    plot(T2,S_2,'LineWidth',3,'Color','r')
    hold off
    xlabel 'Temperature'
    ylabel 'Entropy'
    legend('low temperature','high temperature')
    title(['Temperature vs Entropy for ',species_name])
    fig = sprintf('S_of_%s.png',species_name);
    saveas(gca,fig)
    cd(current_dir)


    % Calculate molecular weight of species
    atoms = ['H','C','N','O','A'];                          % atoms present in the data
    atom_mass = [1.00784, 12.0107, 14.0067, 15.99, 39.948]; % atomic mass for respective atoms
    MM = 0;                                                 % molecular mass
    molecule = char(species_name);                          % convert string into character
    for k = 1:length(molecule)
        for l = 1:length(atoms)
            if strcmp(molecule(k),atoms(l))                 % comparing strings
                MM = MM + atom_mass(l);                     % storing value to variable
                m = l;
            end
        end
        n = str2double(molecule(k));
        if n>1
            MM = MM + atom_mass(m)*(n-1);
        end
    end

    fprintf('Molecular mass of %s : %f u',molecule,MM)       % display molecular mass
    fprintf \n

end
- To calculate the molecular mass of all species, first define all the atoms available in the data file and their atomic mass.
- Use a 'for loop', where it compares two strings of molecule name and atoms, and adds up atom mass to the variable.
- Define the number of similar atoms and add their atomic mass as well.
- The result of calculated molecular masses is shown below.
Molecular mass of O : 15.990000 u
Molecular mass of O2 : 31.980000 u
Molecular mass of H : 1.007840 u
Molecular mass of H2 : 2.015680 u
Molecular mass of OH : 16.997840 u
Molecular mass of H2O : 18.005680 u
Molecular mass of HO2 : 32.987840 u
Molecular mass of H2O2 : 33.995680 u
Molecular mass of C : 12.010700 u
Molecular mass of CH : 13.018540 u
Molecular mass of CH2 : 14.026380 u
Molecular mass of CH2(S) : 14.026380 u
Molecular mass of CH3 : 15.034220 u
Molecular mass of CH4 : 16.042060 u
Molecular mass of CO : 28.000700 u
Molecular mass of CO2 : 43.990700 u
Molecular mass of HCO : 29.008540 u
Molecular mass of CH2O : 30.016380 u
Molecular mass of CH2OH : 31.024220 u
Molecular mass of CH3O : 31.024220 u
Molecular mass of CH3OH : 32.032060 u
Molecular mass of C2H : 25.029240 u
Molecular mass of C2H2 : 26.037080 u
Molecular mass of C2H3 : 27.044920 u
Molecular mass of C2H4 : 28.052760 u
Molecular mass of C2H5 : 29.060600 u
Molecular mass of C2H6 : 30.068440 u
Molecular mass of CH2CO : 42.027080 u
Molecular mass of HCCO : 41.019240 u
Molecular mass of HCCOH : 42.027080 u
Molecular mass of H2CN : 28.033080 u
Molecular mass of HCN : 27.025240 u
Molecular mass of HNO : 31.004540 u
Molecular mass of N : 14.006700 u
Molecular mass of NNH : 29.021240 u
Molecular mass of N2O : 44.003400 u
Molecular mass of NH : 15.014540 u
Molecular mass of NH2 : 16.022380 u
Molecular mass of NH3 : 17.030220 u
Molecular mass of NO : 29.996700 u
Molecular mass of NO2 : 45.986700 u
Molecular mass of HCNO : 43.015240 u
Molecular mass of HOCN : 43.015240 u
Molecular mass of HNCO : 43.015240 u
Molecular mass of NCO : 42.007400 u
Molecular mass of CN : 26.017400 u
Molecular mass of HCNN : 41.031940 u
Molecular mass of N2 : 28.013400 u
Molecular mass of AR : 39.948000 u
Molecular mass of C3H8 : 44.094820 u
Molecular mass of C3H7 : 43.086980 u
Molecular mass of CH3CHO : 44.042760 u
Molecular mass of CH2CHO : 43.034920 u- Graphs for O2
- Graphs for N2
- Graphs for CO2
- Folder window