Project 1 - Parsing NASA thermodynamic data
Aim: To find the Enthalpy, Entropy, and specific heat of all the species in NASA Thermodynamic data by reading the file
Principle: Data parsing is a method where one string of data gets converted into a different type of data. So let’s say you receive your data in raw format, a parser will take the said format and transform it into a more readable data format that can be easily read and understood.
In the above-said problem, we have to find the enthalpy, entropy, and specific heat of given species in Nasa thermodynamic data
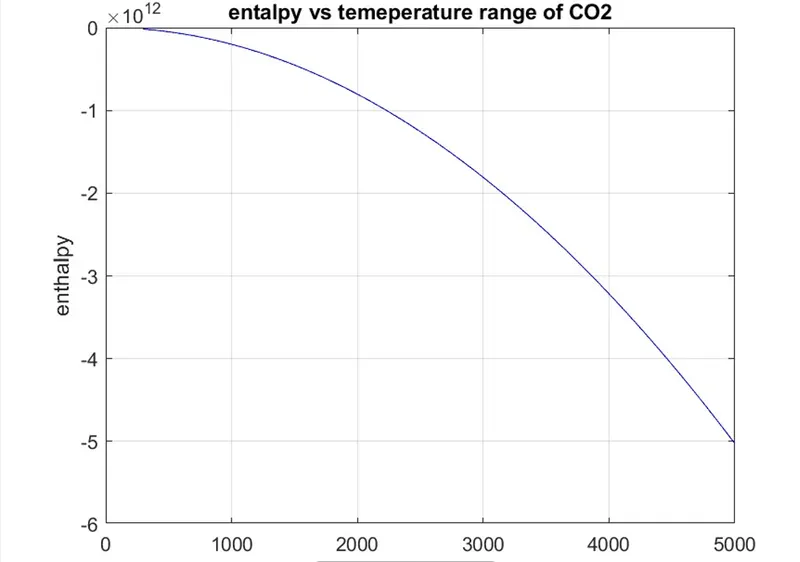
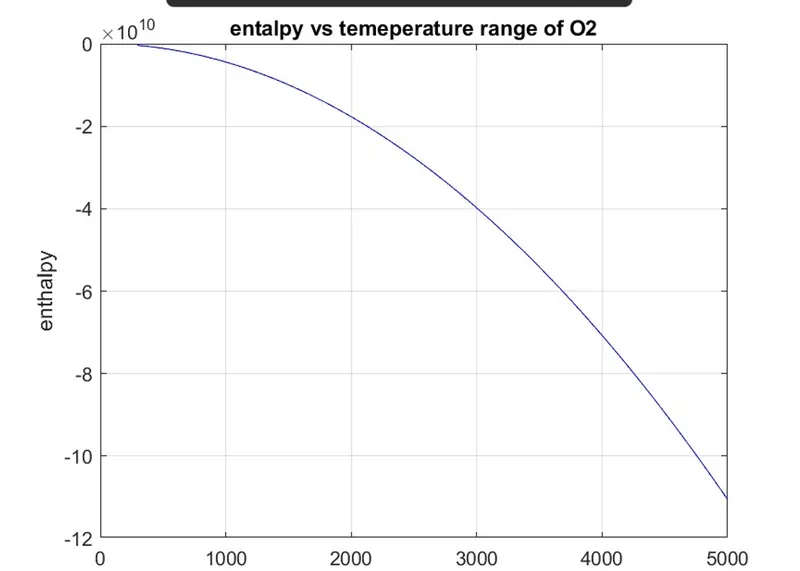
ENTHALPY: Enthalpy is the measurement of energy in a thermodynamic system. The quantity of enthalpy equals the total content of heat of a system, equivalent to the system’s internal energy plus the product of volume and pressure.
clear all
close all
clc

% opening the NASA Data file
f1= fopen('output_data','r')
Title = fgetl(f1)
tline = fgetl(f1)

% reading the global temperatures
A = strsplit(tline,' ')
global_low_temperature = str2num(A{2})
global_mid_temperature = str2num(A{3})
global_high_temperature = str2num(A{4})

T = linspace(global_low_temperature,global_high_temperature,1000);
R = 8.3144

% ignoring the three lines
for i = 1:3;
    trash = fgetl(f1)
end

% getting the temperature coefficients
for j=1:53;
    aline=fgetl(f1)
    t= strsplit(aline,' ')
    species = (t{1})
    low_temperature = str2num(t{end-3})
    mid_temperature = str2num(t{end-2})
    high_temperature = str2num(t{end-1})

    tline1 = fgetl(f1)
    B = findstr(tline1,'E')
    a1 = tline1(1:B(1)+3)
    a1 = str2num(a1)
    a2 = tline1(B(1)+4:B(2)+3)
    a2 = str2num(a2)
    a3 = tline1(B(2)+4:B(3)+3)
    a3 = str2num(a3)
    a4 = tline1(B(3)+4:B(4)+3)
    a4 = str2num(a4)
    a5 = tline1(B(4)+4:B(5)+3)
    a5 = str2num(a5)

   tline2 = fgetl(f1)
   C = findstr(tline2,'E')
   a6 = tline2(1:C(1)+3)
   a6 =str2num(a6)
   a7 = tline2(C(1)+4:C(2)+3)
   a7 = str2num(a7)

   % high temperature coefficients
   a8 = tline2(C(2)+4:C(3)+3)
   a8 = str2num(a8)
   a9 = tline2(C(3)+4:C(4)+3)
   a9 = str2num(a9)
   a10 = tline2(C(4)+4:C(5)+3)
   a10 = str2num(a10)

   tline3 = fgetl(f1)
   D = findstr(tline3,'E')
   a11 = tline3(1:D(1)+3)
   a11 = str2num(a11)
   a12 = tline3(D(1)+4:D(2)+3)
   a12 = str2num(a12)
   a13 = tline3(D(2)+4:D(3)+3)
   a13 = str2num(a13)
   a14 = tline3(D(3)+4:D(4)+3)
   a14 = str2num(a14)

   % calculating enthalpy,entropy and sepcific heat
   cp = specificheat(a1,a2,a3,a4,a5,a6,a7,a8,a9,a10,a11,a12,a13,a14,T,R,global_mid_temperature)
   H =  enthalpy(a1,a2,a3,a4,a5,a6,a7,a8,a9,a10,a11,a12,a13,a14,T,R,global_mid_temperature)
   S = entropy(a1,a2,a3,a4,a5,a6,a7,a8,a9,a10,a11,a12,a13,a14,T,R,global_mid_temperature)


   % saving the data in a folder name species
   cd('C:\Users\91886\OneDrive\Desktop\Temp programs\species')
   mkdir(species)
   cd(species)

   % plotting the graph of enthalpy,entropy,sepcific heat
figure(1)
plot(T,cp,'color','r')
xlabel('temperature')
ylabel('Specific heat')
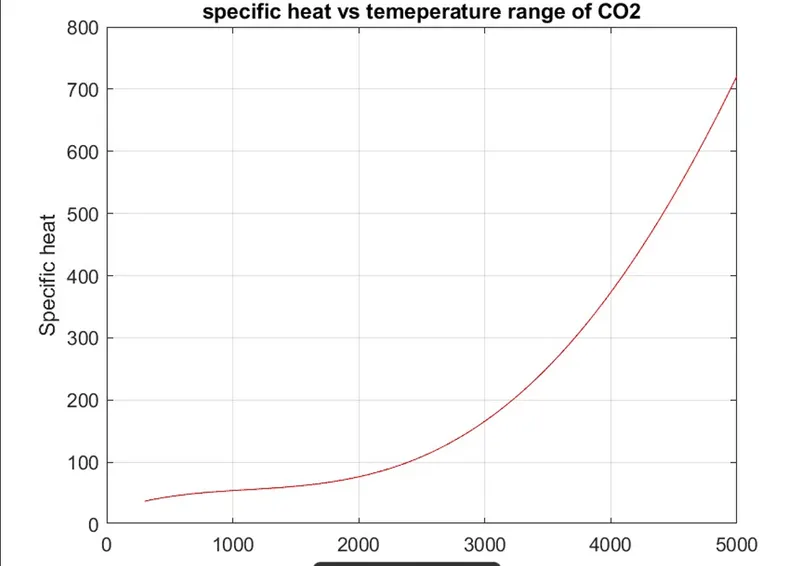
title(sprintf('specific heat vs temeperature range of %s',species))
grid on
saveas(figure(1),'specific heat.jpg')

figure(2)
plot(T,H,'color','b')
xlabel('temperature')
ylabel('enthalpy')
title(sprintf('entalpy vs temeperature range of %s',species))
grid on
saveas(figure(2),'enthalpy.jpg')


figure(3)
plot(T,S,'color','g')
xlabel('temperature')
ylabel('entropy')
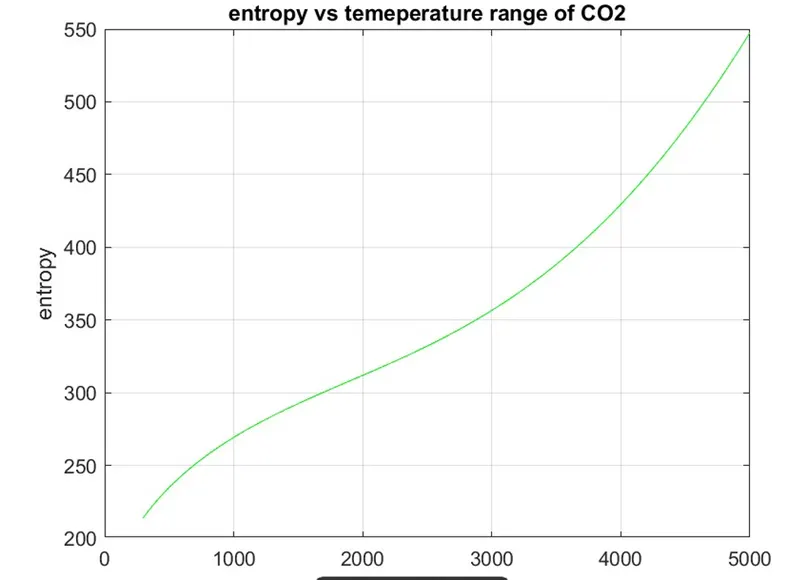
title(sprintf('entropy vs temeperature range of %s',species))
grid on
saveas(figure(3),'entropy.jpg')


cd('C:\Users\91886\OneDrive\Desktop\Temp programs')
% calculating the  moelcular weight
 atomic_name = ['H','C','O','N','AR'];
 atomic_weight = [1.008, 12.011, 15.999, 14.007, 39.948];
  W = 0 ;

  for k=1:length(species)
     for l=1:length(atomic_weight)
      if strcmp(species(k),atomic_name(l));
          W = W+atomic_weight(l);
          position=l ;
      end
  end
  n= str2double(species(k));
  if n>1
  W = W + (atomic_weight(position)*(n-1));
  end
  end
  fprintf('molecular weight of %s is %f',species,W)

end
Explanation of the code
clear all function is used to clear the variables
close all functions and clear the plots
CLC clears the command window
fopen function is used to open either an existing file or a new file where r is used to read the file and w is used to write the file
fgetl command is used to return the next line of the file associated with the file identifier fid.
strsplit function splits str into the elements of delimiter. The order in which delimiters appear in delimiter does not matter unless multiple delimiters begin a match at the same character in str
findstr function searches the longer of the two input arguments for any occurrences of the shorter argument and returns the starting index of each occurrence
str2num converts string into a numerical value
Program to calculate Enthalpy
function [H] = enthalpy(a1,a2,a3,a4,a5,a6,a7,a8,a9,a10,a11,a12,a13,a14,T,R,global_mid_temperature)

if T>global_mid_temperature
    s
else
     H = (a8+a9.*(T./2)+a10.*((T.^2)/3)+a11.*((T.^3)/4)+a12.*((T.^4)/5)+a13.*T./2)*R.*T
end
Program to calculate Entropy
function S = entropy(a1,a2,a3,a4,a5,a6,a7,a8,a9,a10,a11,a12,a13,a14,T,R,global_mid_temperature)

if T>global_mid_temperature
    S = (a1.*log(T)+a2.*T+a3.*((T.^2)/2)+a4.*((T.^3)/3)+a5.*((T.^4)/4)+a7)*R
else
     S = (a8.*log(T)+a9.*T+a10.*((T.^2)/2)+a11.*((T.^3)/3)+a12.*((T.^4)/4)+a14)*R
end
Program to calculate Specific Heat
function [cp] = specificheat(a1,a2,a3,a4,a5,a6,a7,a8,a9,a10,a11,a12,a13,a14,T,R,global_mid_temperature)
if T>global_mid_temperature
    cp = (a1+a2.*T+a3.*T.^2+a4.*T.^3+a5.*T.^4)*R
else
    cp = (a8+a9.*T+a10.*T.^2+a11.*T.^3+a12.*T.^4)*R
end
Program to calculate Molecular weight
% calculating the  moelcular weight
 atomic_name = ['H','C','O','N','AR'];
 atomic_weight = [1.008, 12.011, 15.999, 14.007, 39.948];
  W = 0 ; % initial value is zero

% to find Molecular weight of the species
  for k=1:length(species)
     for l=1:length(atomic_weight)
      if strcmp(species(k),atomic_name(l));
          W = W+atomic_weight(l);
          position=l ;
      end
  end
  n= str2double(species(k));
  if n>1
  W = W + (atomic_weight(position)*(n-1));
  end
  end
  fprintf('molecular weight of %s is %f',species,W)

end
Location of Folders

Graph of O2
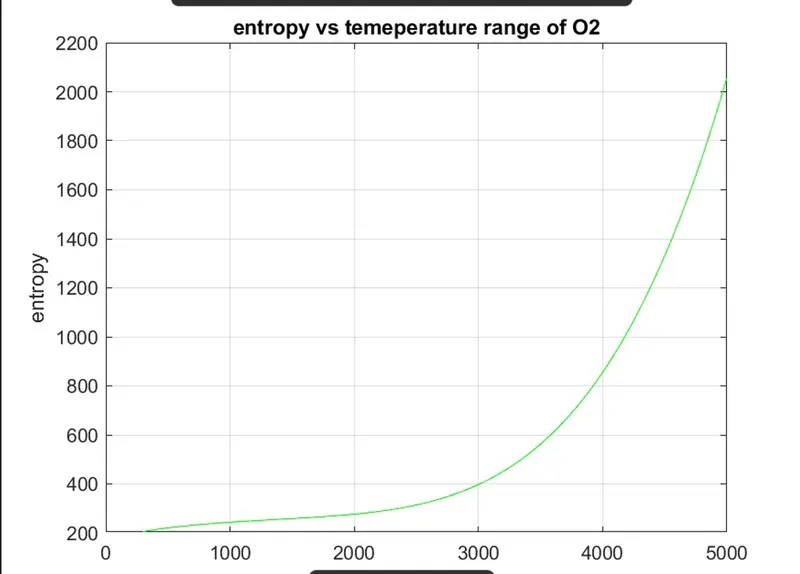
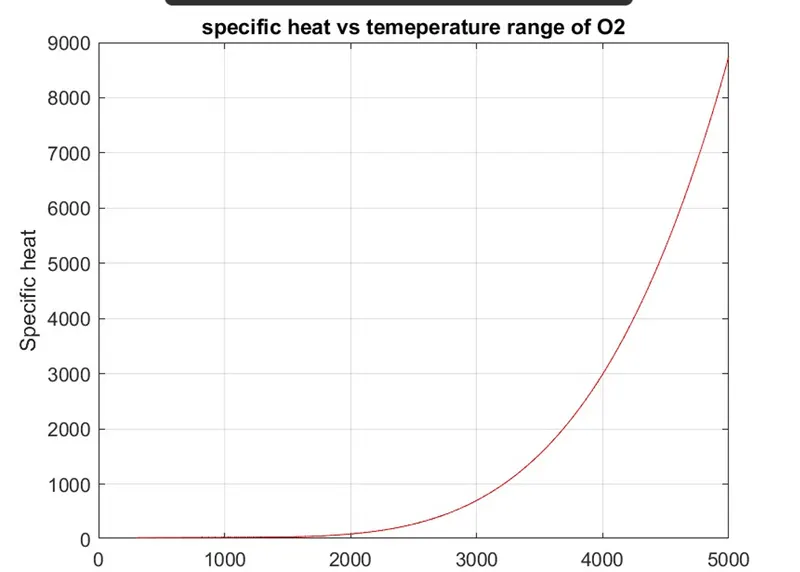
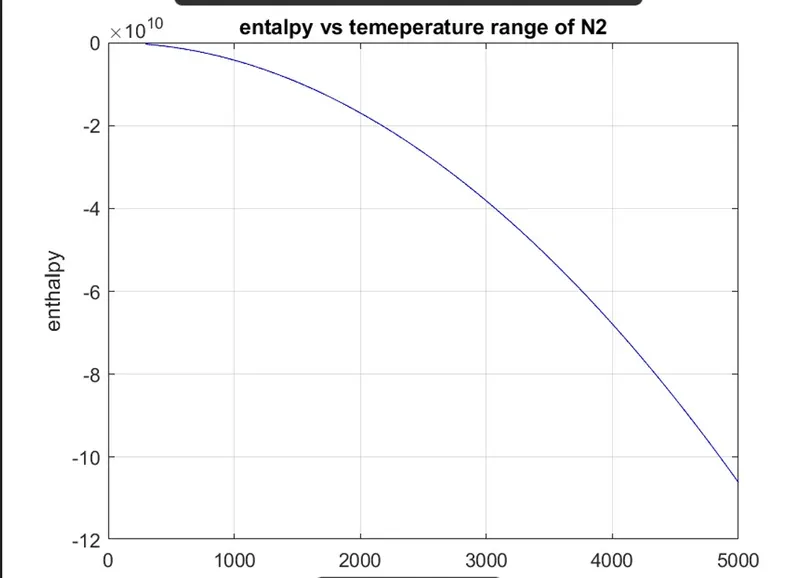
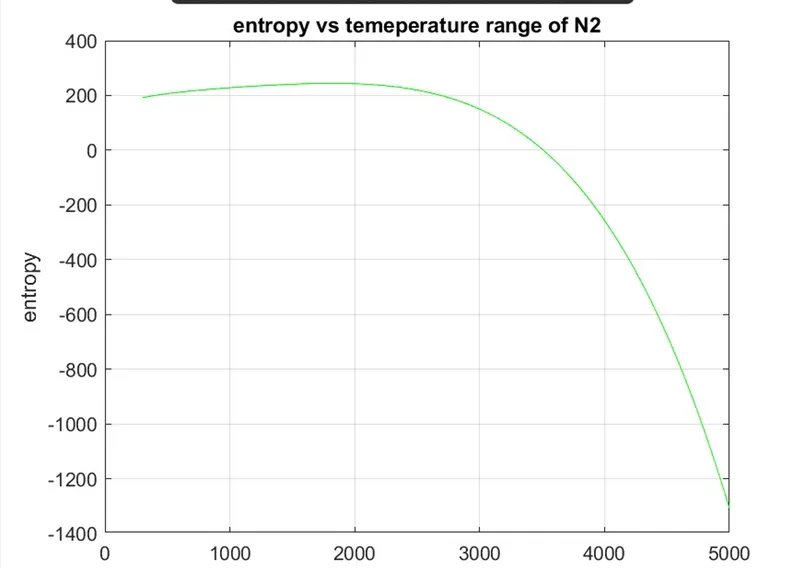
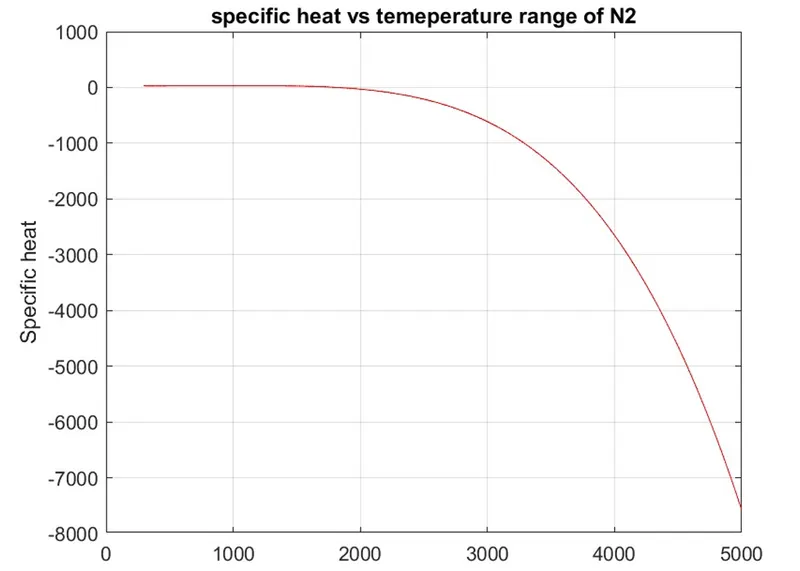
Graph of N2
Graph of CO2