Challenge

Project 1 - Parsing NASA thermodynamic data

Parsing- Nasa thermodynamic data file using Matlab

Aim:-

To write a function to extract the 14 co-efficients and calculates the enthalpy, entropy and specific heats for all the species in the given NASA thermodynamic data file, and aslo to plot the respective graphs and to calculate the values of cp,H,S& molecular weight for each of the species. And also to make a seperate directory to put-up all the datas extracted.

Software used:-

MATLAB R2022a

Project Description:-

File parsing:-

Parsing, which is the process of identifying tokens within a data instance and looking for recognizable patterns. The parsing process segregates each word, attempts to determine the relationship between the word and previously defined token sets, and then forms patterns from sequences of tokens.
Here in this project we are provided with a NASA thermodynamic data file, which consists of set of coefficients for different species and their values of cp, H, S and molecular weight can be calculated as follows:

The formulas to find out the cp.H,S are gives as follows:-
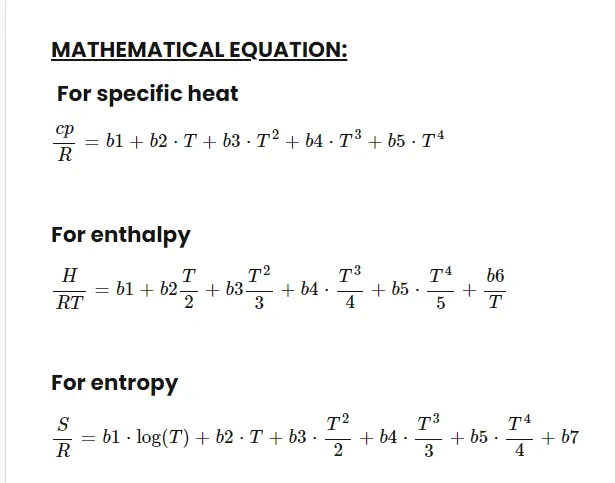
Here,

T= Local temperature

b1 to b7 = High temperature coefficients

b8 to b14= Low temperatute coefficients

R= Gas constant, and the value for R is 8.314

Now we will be provided with the following thermmodynamic data file:
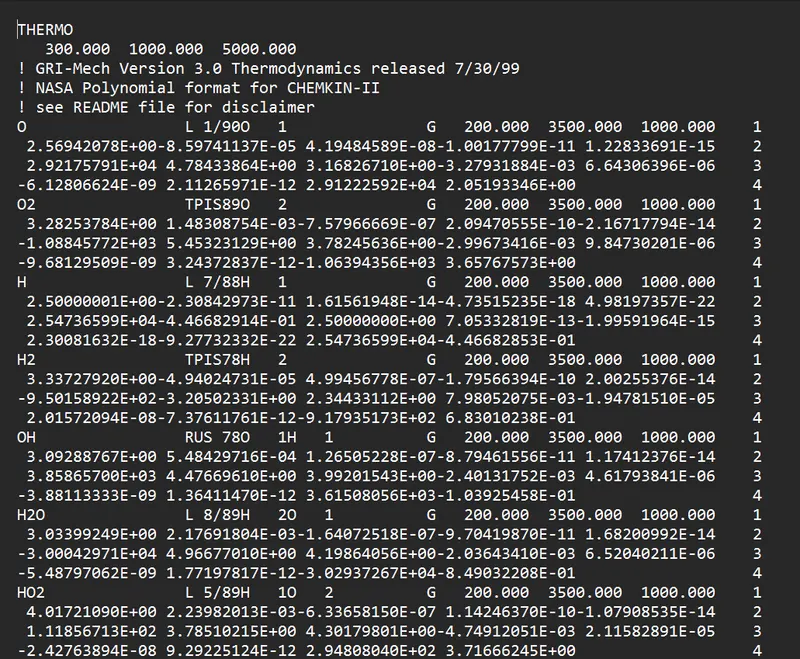
Now our task is to extract the datas from these file and to find out the cp,H,S & molecular weight for each and every species mentioned in the data file.

PROGRAM TO READ THE THERMODYNAMIC DATA FILE & ITS EXPLAINATIONS:-

clear all
close all
clc
f1=fopen('THERMO.dat','r');
The 'fopen' code is used to open the file from the saved foder and 'r' detones to read that data file. And hence the required data file is taken inside our Matlab workspace and saved inside the variable f1.
first_line=fgetl(f1);
second_line_temp=fgetl(f1);
The 'fgetl' code is used to load the line by line datas. And for the first time when we use the 'fgetl' code, it loads the first line and when we use it for the second time, automatically it will load the second line and it will continue.
And hence in the above lines of program, we are loading the first line ie., 'THERMO' & the second line which consists of the global temperature values.
global_temp=strsplit(second_line_temp,' ');
The 'strsplit' code is used to split the second line, which consists of global temperature values by the help of space delimiter and that is what mentioned as '_'. And with the help of this line, the global temperature will get divided into 3 seperate parts as string.( ie., 300.000 1000.000 5000.000 )
global_low_temp=str2num(global_temp{2});
global_mid_temp=str2num(global_temp{3});
global_high_temp=str2num(global_temp{4});

The 'str2num' code is used to convert the string values into numbers and they are stored in the seperate variables as global low,mid & high temperatures.

for i=1:3
fgetl(f1)
end

The lines starts with exclamatory symbol are comments and we can eliminate that. And hence the above 'for loop' is used to skip the next three lines.

line1=fgetl(f1) ---------> Line consists of Local temperatures
line2=strsplit(line1,' ');
And the next line consists of the local high,mid & low temperatures and that is our mail line required for our calculations and that line is read with the help of fgetl' code and stured in a variable as line1. And in the second line of code, the line one is splitted with the help of 'strsplit' code and seperated as string by space delimiter.
The line looks as follows:- O L 1/90O 1 G 200.000 3500.000 1000.000 1

And this line will be splitted with the help of the above strsplit code. And then the important task is to get the local low, mid and high temperatures and to convert them as numbers and hence it can be used for calculation purposes.

sp_name=line2{1}; ---------> To store the species name ie., O
tl=line2{end-3}; ----------> To store the low temperature ie., 200.000
th=line2{end-2}; ----------> To store the high temperature ie., 3500.000
tm=line2{end-1}; ----------> To store the mid temperature ie., 1000.000
And all the values of tl, th &tm are stored as string values in a cell array.
tl=str2num(tl);
th=str2num(th);
tm=str2num(tm);
Now to convert the string values of tl,th &tm, 'str2num' code is again used.
And now, our next process is to take up all of the coefficients values
2.56942078E+00 -8.59741137E-05 4.19484589E-08 -1.00177799E-11 1.22833691E-15 2
2.92175791E+04 4.78433864E+00 3.16826710E+00 -3.27931884E-03 6.64306396E-06 3
-6.12806624E-09 2.11265971E-12 2.91222592E+04 2.05193346E+00 4

Now to seperate the coefficient values, we are going to find out the position of "E' and hence the rest of the values can be easily extracted.
data=fgetl(f1); -----------> This line is used to read first line of coeff. ie.,(2.56942078E+00 -8.59741137E-05 4.19484589E-08 -1.00177799E-11 1.22833691E-15 2 )
position_of_e=findstr(data2,'E'); ---------> This line of script is used to find out the position of 'E' in the first line coefficients
And the following code is used to separate the indiviual coeff values and can be stored in variables as c1,c2,c3,c4 & c5.
c1=str2double(data(1:position_of_e(1)+3))
c2=str2double(data(position_of_e(1)+4:position_of_e(2)+3));
c3=str2double(data(position_of_e(2)+4:position_of_e(3)+3));
c4=str2double(data(position_of_e(3)+4:position_of_e(4)+3));
c5=str2double(data(position_of_e(4)+4:position_of_e(5)+3));
The 'strdouble' & 'str2num' codes are same and they are used to convert the string values into numbers and the same procedure is followed to extract all the other coefficients. And all the coefficients upto c14 are extracted.
Now after all the 14 coeff. of first species ie.,(O) is got seperated , the function programs are scriptted and function calling is done in the main program to find out the values of cp, H, S & molecular weight and they can be plotted against the temperature.
----------------------------------------------------------------------------------------------------------------------------------------------------------------------------------------------------
FUNCTION PROGRAM EXPLAINATIONS TO FIND Cp VALUES:-
function [cp]=specific_heat(c1,c2,c3,c4,c5,c8,c9,c10,c11,c12,th,t,R)
if(t<=th)
cp=R*(c8+c9*t+c10*t.^2+c11*t.^3+c12*t.^4);
else
cp=R*(c1+c2*t+c3*t.^2+c4*t.^3+c5*t.^4);
end
end
In the first line of the code, the coeficients are gives as inputs for the function and an 'if else' statement is used to find out the Cp values for the Low temp. coeff & for the high temp.coeff indiviually. The mathematical formula for the calculation of Cp values are mentioned above.
FUNCTION PROGRAM EXPLAINATIONS TO FIND H ( enthalpy ) VALUES:-
function [H]=enthalpy(c1,c2,c3,c4,c5,c6,c8,c9,c10,c11,c12,c13,th,t,R)
if(t<=th)
H=((c8+(c9.*t)/2)+((c10.*t.^2)/3)+((c11.*t.^3)/4)+((c12.*t.^4)/5)+(c13./t)).*t*R;
else
H=((c1+(c2.*t)/2)+((c3.*t.^2)/3)+((c4.*t.^3)/4)+((c5.*t.^4)/5)+(c6./t)).*t*R;
end
end
The same procedure followed for the calculation of Cp values is again followed here and only some of the coefficient values will get altered according to the matametical values mentioned above.
FUNCTION PROGRAM EXPLAINATIONS TO FIND S ( entropy ) VALUES:-
function [S]=entropy(c1,c2,c3,c4,c5,c7,c8,c9,c10,c11,c12,c14,th,t,R)
if(t<=th)
S=((c8.*log(t))+(c9.*t)+((c10.*(t.^2))/2)+((c11.*(t.^3)/3))+((c12.*(t.^4))/4)+c14)*R
else
S=((c1.*log(t))+(c2.*t)+((c3.*(t.^2))/2)+((c4.*(t.^3)/3))+((c5.*(t.^4))/4)+c7)*R
end
end
The same procedure is followed which we done for the calculation of Cp and H values.
FUNCTION PROGRAM EXPLAINATIONS TO Molecular Weight :-
function mw=molecular_weight(sp_name)
species=(sp_name);
elements=['H' 'C' 'O' 'N' 'A'];
atomic_weight=[1 12 16 14 39];
mw=0;
In these scripting lines, the sp_name is given as the function input and is stored in the variable 'species'. Then the elements present in the data file and their respective atomic weight is defined in an array.
for i=1:length(species);
for j=1:length(elements);
if strcmp(species(i),elements(j));
mw=mw+atomic_weight(j);
position=j;
end
end
Now two 'for loops' are generated and the length of the species and elements are given as inputs and an 'if else' statement is used to compare both the species and elements , with the help of the 'strcmp' code. If it statisfies the comparision then the next line will be loaded. If the comparision fails, again it will get loop and will take the next element and species.
Then if the for loop doesn't get executed then it will ne a number and the following code will generate. If the value of n is greater than 1, then the molecular weight will get calculated. Or else, it will again shift to the loop counter and will take the next counter value and the process will get repeated.
n=str2num(species(i));
if n>1
mw=mw+(atomic_weight(position)*(n-1));
end
end
To print the molecular weight formula 'fprintf' code is used as follows:
fprintf('Molecular weight of %s = %d',species,mw)
end
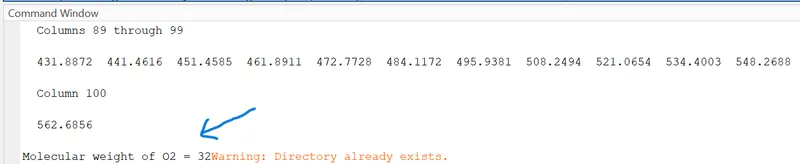
And by the help of the above scripting lne, the molecular weight will be displayed with proper string in our command box.
------------------------------------------------------------------------------------------------------------------------------------------------------------------------------------------------
Now after defining the function programs, the formula for Cp, H, S & molecular weight is called in the main program.
R=8.314;
t=linspace(tl,th,100);
R is the Gas constant and the temperature 't' is created with inbetween values of local high and low temperatures with 100 values in between, with the help of 'linspace' code.
cp=specific_heat(c1,c2,c3,c4,c5,c8,c9,c10,c11,c12,th,t,R);
h=enthalpy(c1,c2,c3,c4,c5,c6,c8,c9,c10,c11,c12,c13,th,t,R);
s=entropy(c1,c2,c3,c4,c5,c7,c8,c9,c10,c11,c12,c14,th,t,R);
molecular_weight_calc=molecular_weight(sp_name);
Here all the function statement calling is done to calculate the values for the Cp, H, S & molecular weight.
Making directory:-
cd('C:\Users\hp\OneDrive\Documents\MATLAB\Nasa File Parsing') ---------> Copy the folder link and put it along with 'cd' code and hence in the particular folder, the directory is created
mkdir(sp_name) ---------> This code 'mkdir' (make directory) is used to create a new folder in the specified folder
cd(sp_name) ----------> This code 'cd' in the directory is saved in the name of the species names, which are already defined above.
Plotting:-
figure(1)
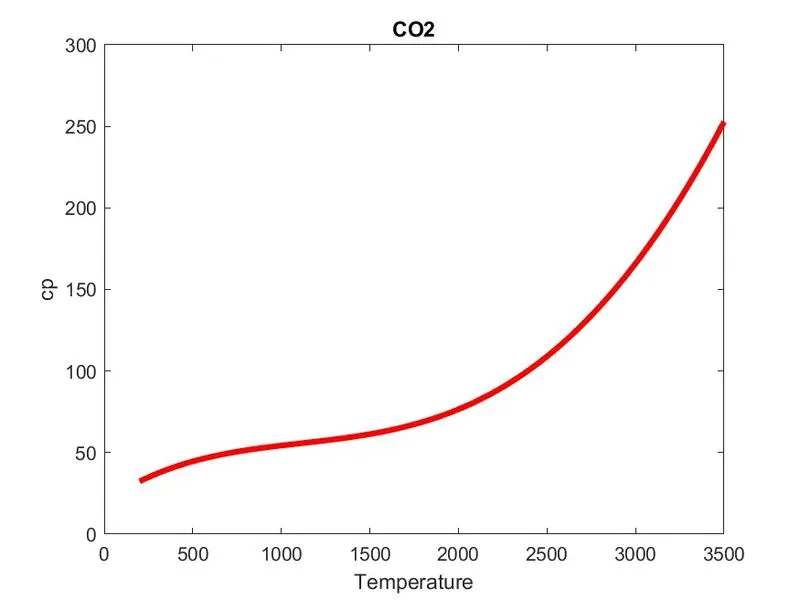
plot(t,cp,LineWidth=3,Color='r')
xlabel('Temperature')
ylabel('cp')
saveas(figure(1),'t vs cp','jpg')
figure(2)
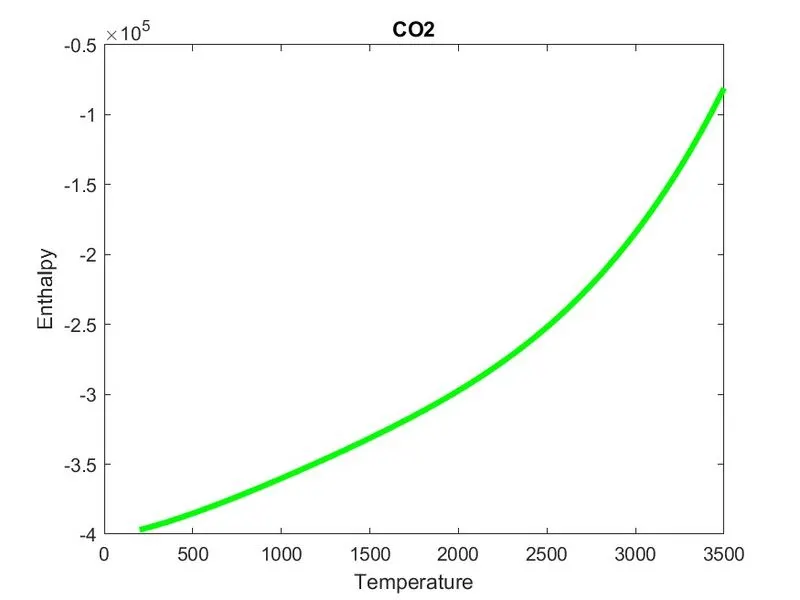
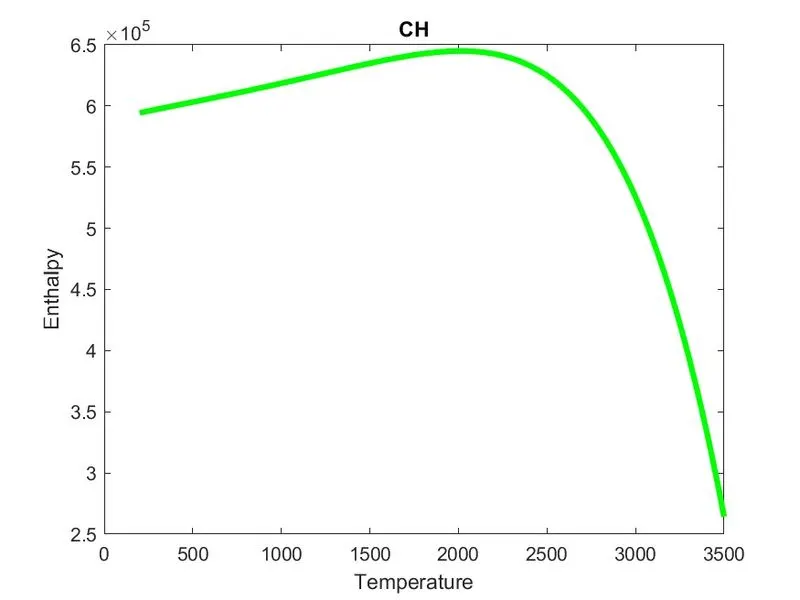
plot(t,h,LineWidth=3,Color='g')
xlabel('Temperature')
ylabel('Enthalpy')
saveas(figure(2),'Enthalpy vs t','jpg')
figure(3)
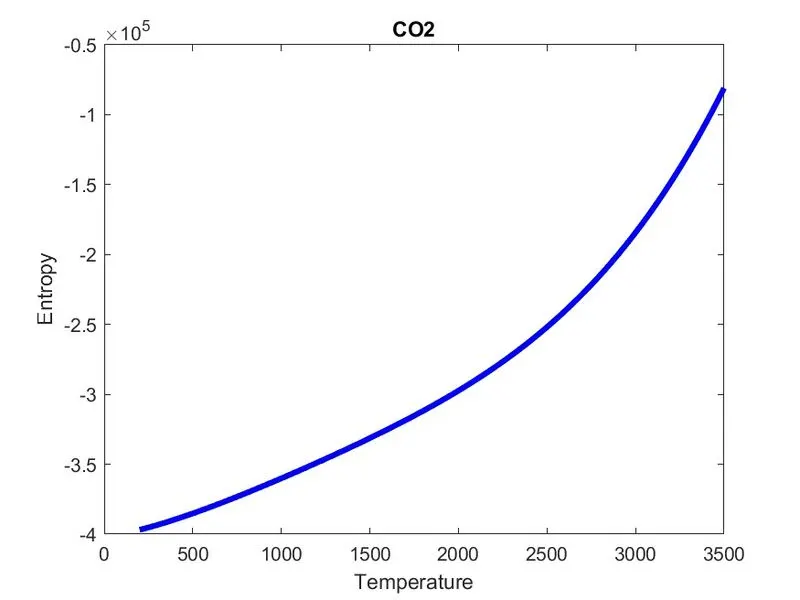
plot(t,h,LineWidth=3,Color='b')
xlabel('Temperature')
ylabel('Entropy')
saveas(figure(3),'Entropy vs t','jpg')
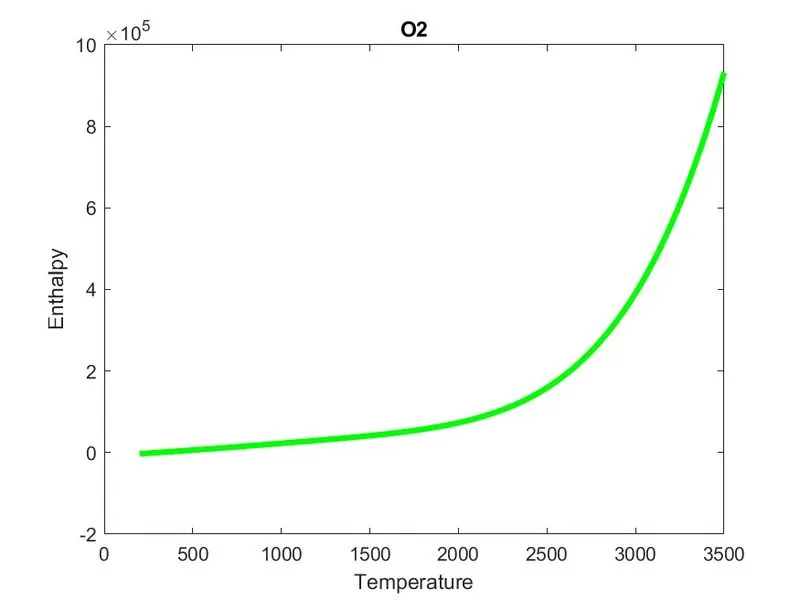
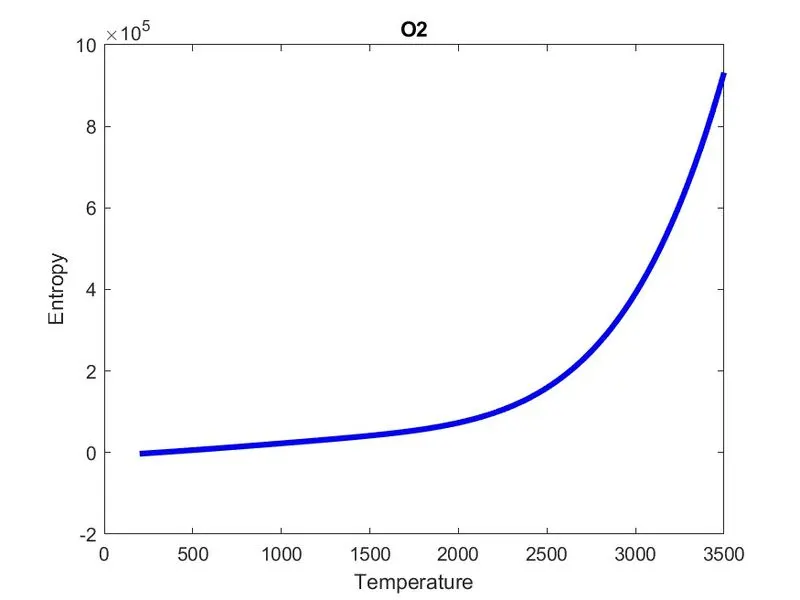
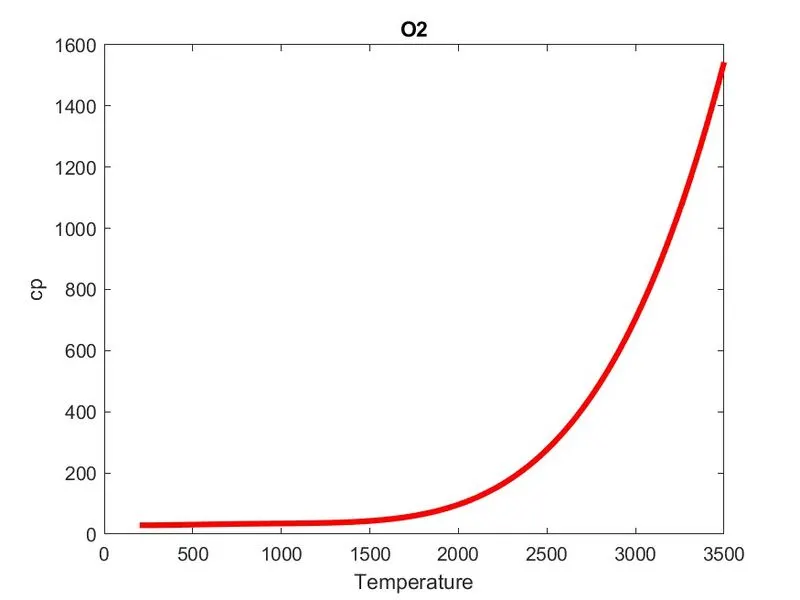
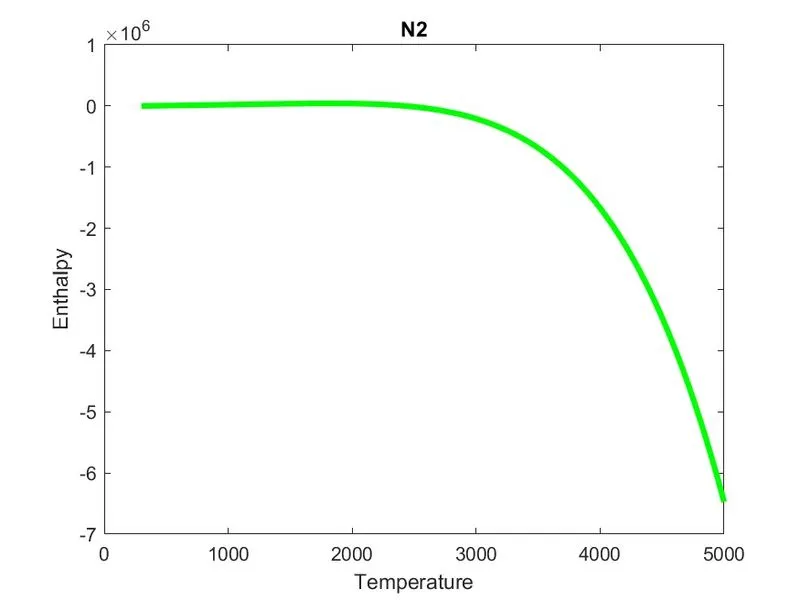
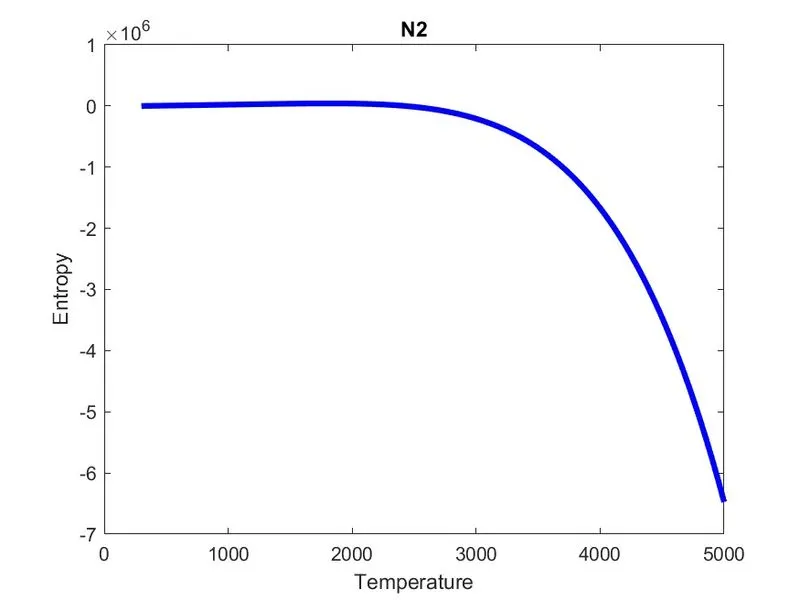
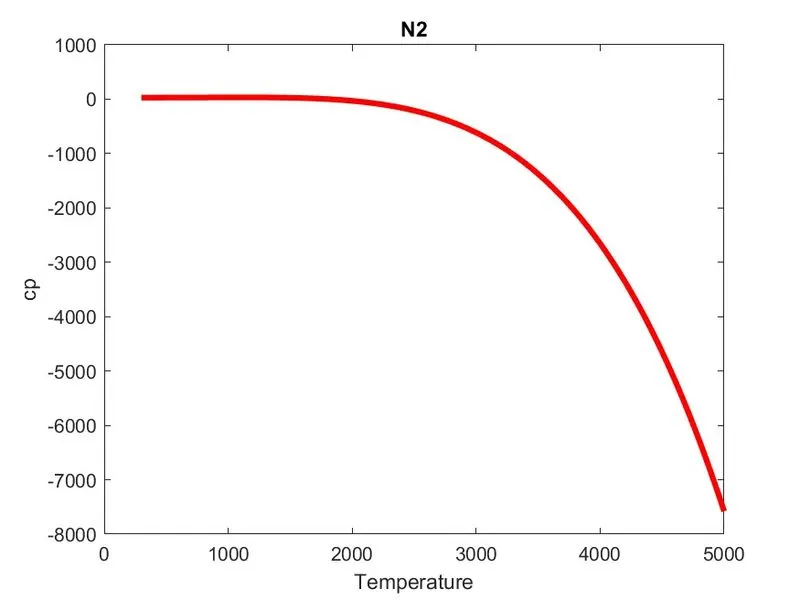
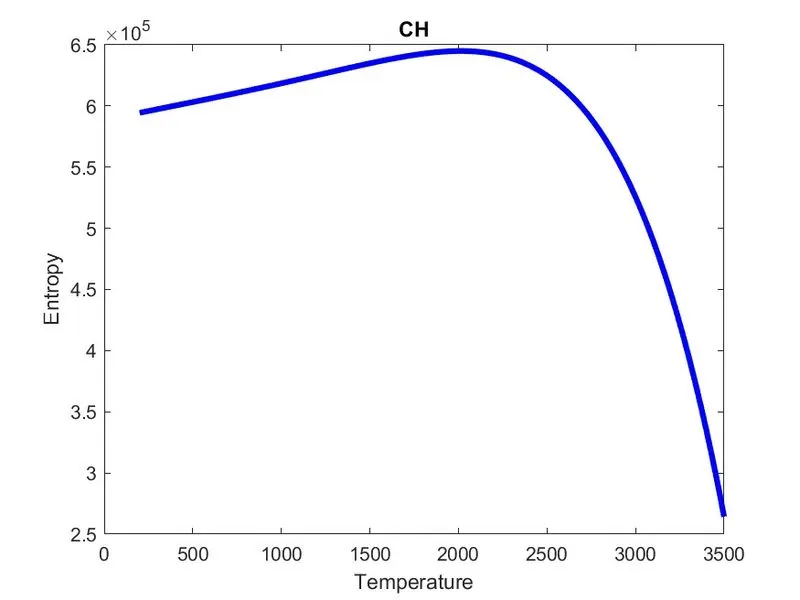
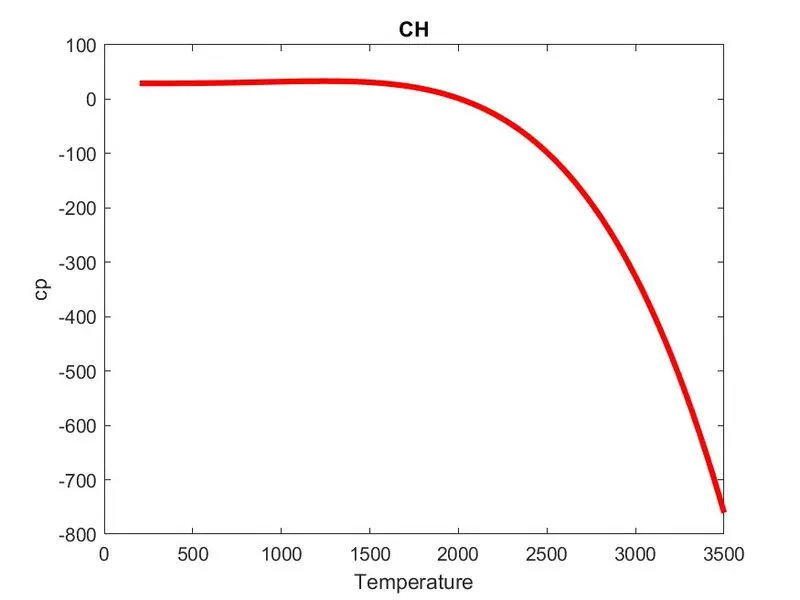
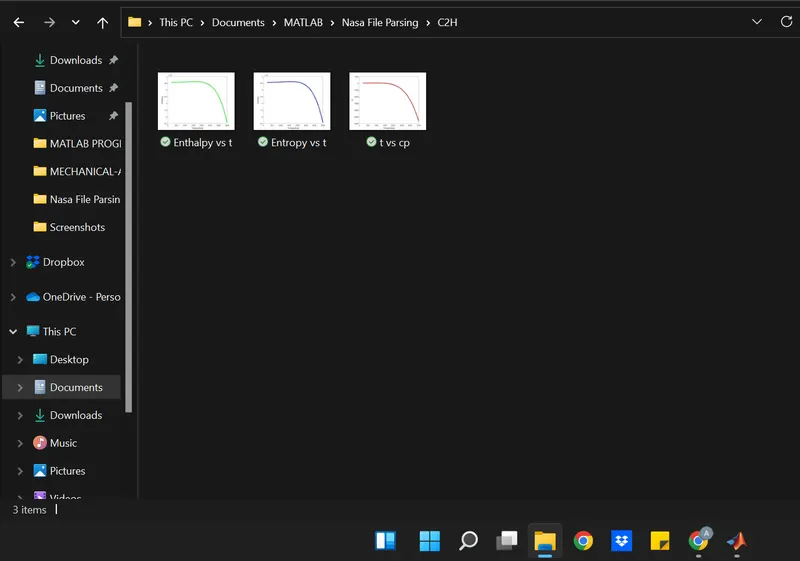
By using the above script all the values of Cp, H & S are plotted against 't' and are stored in the directory whoch we gave already.
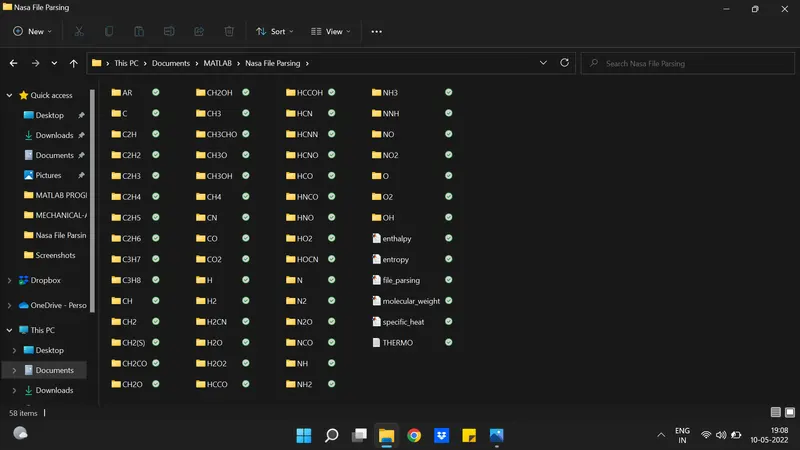
To get the folder, graph and directory for all the 52 species mentioned in the data file, a 'for loop' is used above the scripting line where we define the species name line( refer the main program)
OUTPUTS:-
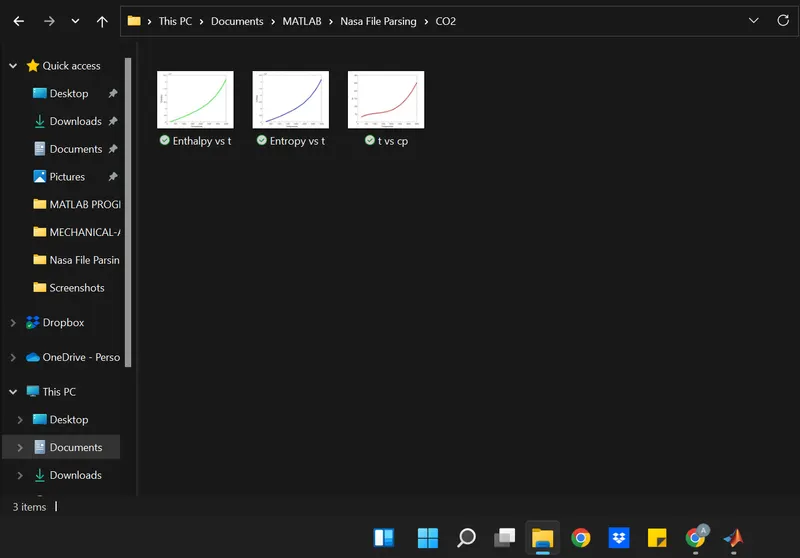
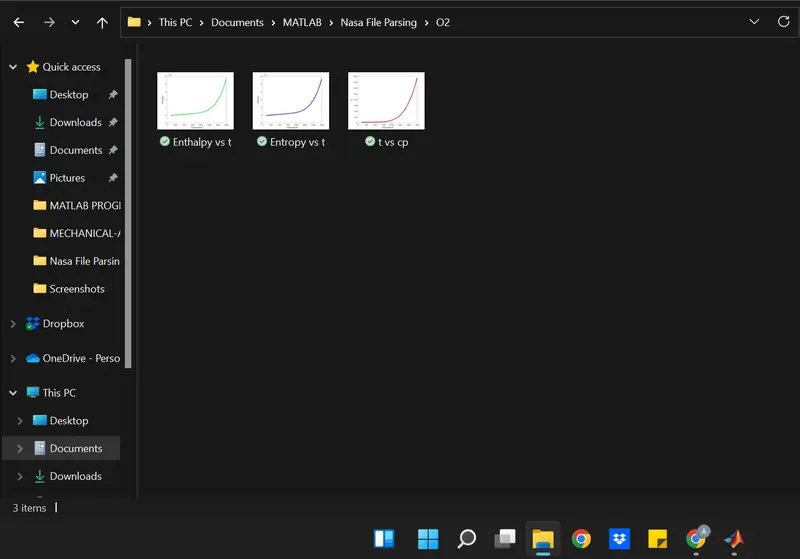
Directory created:-
Graphs inside the directories:-
Plots of Cp, H & S versus T:-

Molecular weight calculated values :-

MAIN PROGRAM:-

clear all
close all
clc

f1=fopen('THERMO.dat','r');

%To load the first two lines in the data file

first_line=fgetl(f1);
second_line_temp=fgetl(f1);

%To split the global temperature values with the help of space delimiter

global_temp=strsplit(second_line_temp,' ');

%To convert the string values as numbers 

global_low_temp=str2num(global_temp{2});
global_mid_temp=str2num(global_temp{3}); 
global_high_temp=str2num(global_temp{4});

% To skip the comment lines in between

for i=1:3
    fgetl(f1)
end

% To get the first data line consists of temperature for 'o'

for i=1:53
line1=fgetl(f1)

% To split the line

line2=strsplit(line1,' ');

%To get the low, mid & high temp seperately

sp_name=line2{1};

tl=line2{end-3};
th=line2{end-2};
tm=line2{end-1};

%To convert the string values into a number

tl=str2num(tl);
th=str2num(th);
tm=str2num(tm);

%To read the line consists of coefficient values 

data=fgetl(f1);
position_of_e=findstr(data,'E');

c1=str2double(data(1:position_of_e(1)+3))
c2=str2double(data(position_of_e(1)+4:position_of_e(2)+3));
c3=str2double(data(position_of_e(2)+4:position_of_e(3)+3));
c4=str2double(data(position_of_e(3)+4:position_of_e(4)+3));
c5=str2double(data(position_of_e(4)+4:position_of_e(5)+3));

data2=fgetl(f1);
position_of_e=findstr(data2,'E');

c6=str2double(data2(1:position_of_e(1)+3));
c7=str2double(data2(position_of_e(1)+4:position_of_e(2)+3));
c8=str2double(data2(position_of_e(2)+4:position_of_e(3)+3));
c9=str2double(data2(position_of_e(3)+4:position_of_e(4)+3));
c10=str2double(data2(position_of_e(4)+4:position_of_e(5)+3));

data3=fgetl(f1);
position_of_e=findstr(data3,'E');

c11=str2double(data3(1:position_of_e(1)+3));
c12=str2double(data3(position_of_e(1)+4:position_of_e(2)+3));
c13=str2double(data3(position_of_e(2)+4:position_of_e(3)+3));
c14=str2double(data3(position_of_e(3)+4:position_of_e(4)+3));

R=8.314;
t=linspace(tl,th,100);

cp=specific_heat(c1,c2,c3,c4,c5,c8,c9,c10,c11,c12,th,t,R);
h=enthalpy(c1,c2,c3,c4,c5,c6,c8,c9,c10,c11,c12,c13,th,t,R);
s=entropy(c1,c2,c3,c4,c5,c7,c8,c9,c10,c11,c12,c14,th,t,R);

%molecular_weight=molecular_weight(sp_name);

molecular_weight_calc=molecular_weight(sp_name);

%To make the folder directory
cd('C:\Users\hp\OneDrive\Documents\MATLAB\Nasa File Parsing')
mkdir(sp_name)
cd(sp_name)

%Plotting

figure(1)
plot(t,cp,LineWidth=3,Color='r')
xlabel('Temperature')
ylabel('cp')
title(sp_name)
saveas(figure(1),'t vs cp','jpg')

figure(2)
plot(t,h,LineWidth=3,Color='g')
xlabel('Temperature')
ylabel('Enthalpy')
title(sp_name)
saveas(figure(2),'Enthalpy vs t','jpg')

figure(3)
plot(t,h,LineWidth=3,Color='b')
xlabel('Temperature')
ylabel('Entropy')
title(sp_name)
saveas(figure(3),'Entropy vs t','jpg')
cd('C:\Users\hp\OneDrive\Documents\MATLAB\Nasa File Parsing')

end


FUNCTION PROGRAM FOR Cp:-

%For specific heat

function [cp]=specific_heat(c1,c2,c3,c4,c5,c8,c9,c10,c11,c12,th,t,R)

if(t<=th)
  cp=R*(c8+c9*t+c10*t.^2+c11*t.^3+c12*t.^4);
   
else
   cp=R*(c1+c2*t+c3*t.^2+c4*t.^3+c5*t.^4);  
end
end

FUNCTION PROGRAM FOR H (Enthalpy ):-

%For enthalpy

function [H]=enthalpy(c1,c2,c3,c4,c5,c6,c8,c9,c10,c11,c12,c13,th,t,R)

if(t<=th)
  H=((c8+(c9.*t)/2)+((c10.*t.^2)/3)+((c11.*t.^3)/4)+((c12.*t.^4)/5)+(c13./t)).*t*R;
   
else
   H=((c1+(c2.*t)/2)+((c3.*t.^2)/3)+((c4.*t.^3)/4)+((c5.*t.^4)/5)+(c6./t)).*t*R;  
end
end
FUNCTION PROGRAM FOR S (Entropy ):-
%For entropy

function [S]=entropy(c1,c2,c3,c4,c5,c7,c8,c9,c10,c11,c12,c14,th,t,R)

if(t<=th)
  S=((c8.*log(t))+(c9.*t)+((c10.*(t.^2))/2)+((c11.*(t.^3)/3))+((c12.*(t.^4))/4)+c14)*R 
   
else
   S=((c1.*log(t))+(c2.*t)+((c3.*(t.^2))/2)+((c4.*(t.^3)/3))+((c5.*(t.^4))/4)+c7)*R  
end
end​
FUNCTION PROGRAM FOR Molecular weight:-
%For molecular weight

function mw=molecular_weight(sp_name)
species=(sp_name);
elements=['H' 'C' 'O' 'N' 'A'];
atomic_weight=[1 12 16 14 39];

mw=0;

for i=1:length(species);
    for j=1:length(elements);
        if strcmp(species(i),elements(j));
            mw=mw+atomic_weight(j);
            position=j;

        end
    end
    n=str2num(species(i));
    if n>1
        mw=mw+(atomic_weight(position)*(n-1));
    end
end
  fprintf('Molecular weight of %s = %d',species,mw)
end
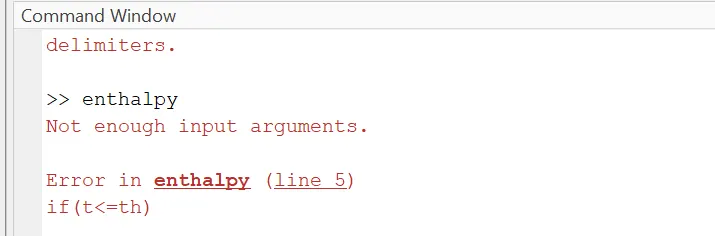
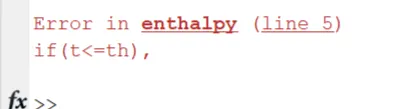
ERRORS SPOTTED:-
1) Mistakenly given the input arguments for the function handling excessively
2) Lot of common errors like missing of delimiters and paranthaseies arised and they are solved.
REFERENCES:-
Your portfolio, next

Ship work like this
in your own course.

Talk to a career counsellor

Free 20-minute call. We'll map the right course to where you want to work.

By submitting you agree to our Terms and Privacy Policy.

Talk to a career counsellor

Free 20-minute call. We'll map the right course to where you want to work.

By submitting you agree to our Terms and Privacy Policy.