Project 1 - Parsing NASA thermodynamic data
PARSING THERMODYNAMIC DATA OF NASA
In this project we have to parse the thermodynamic data file of NASA and calculates the enthalpy(`H`), entropy(`S`) and specific heats(`Cp`) for all the species given in the file.
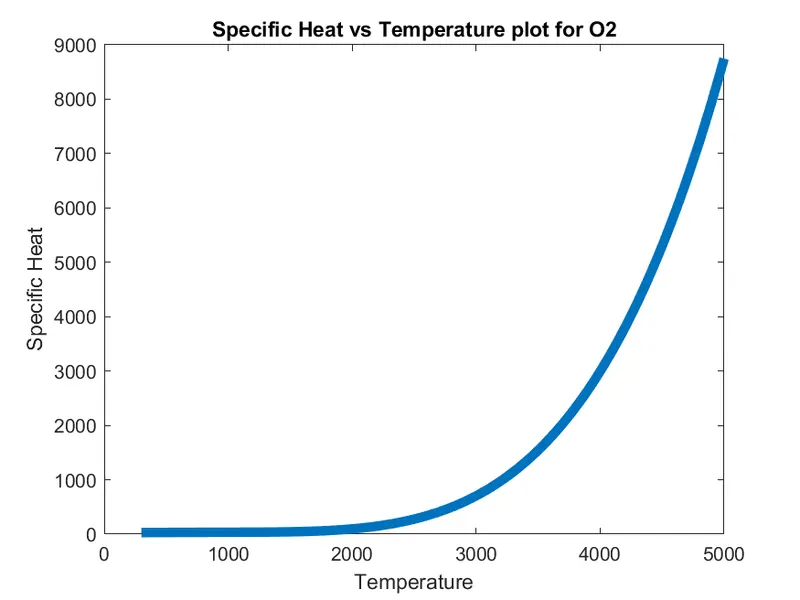
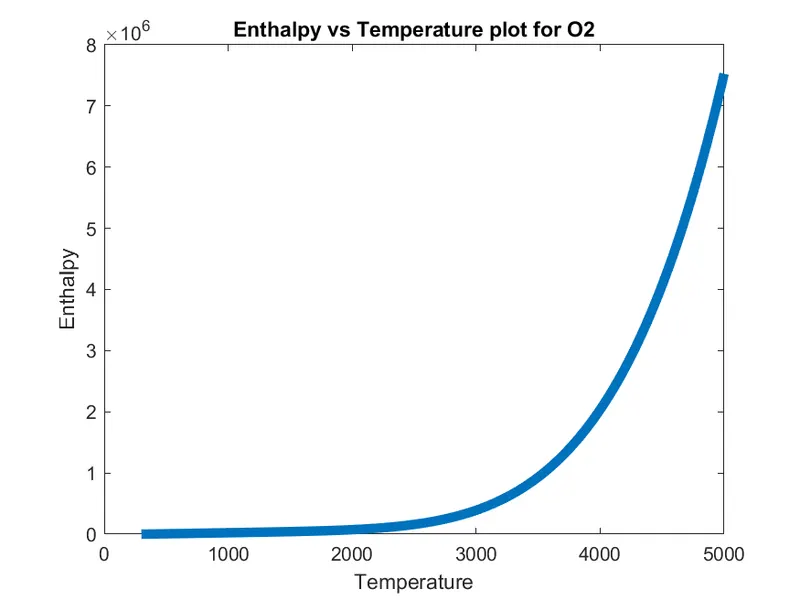
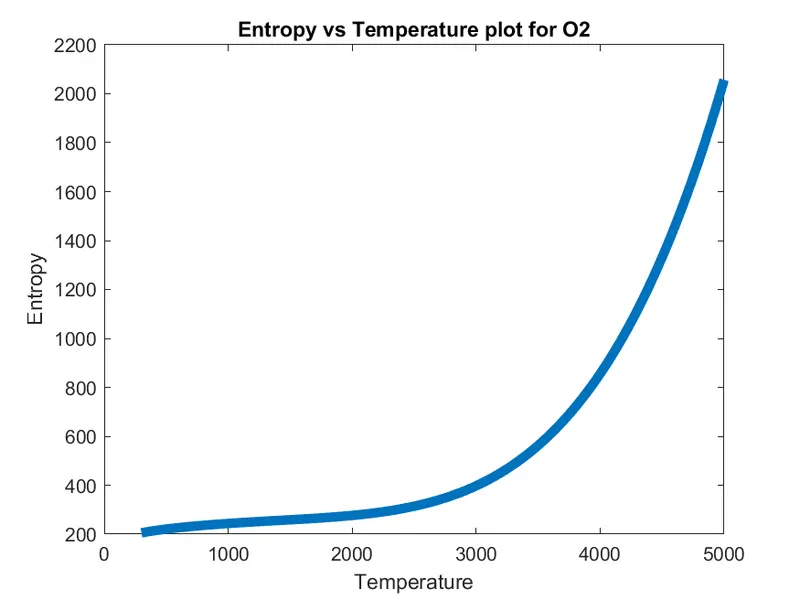
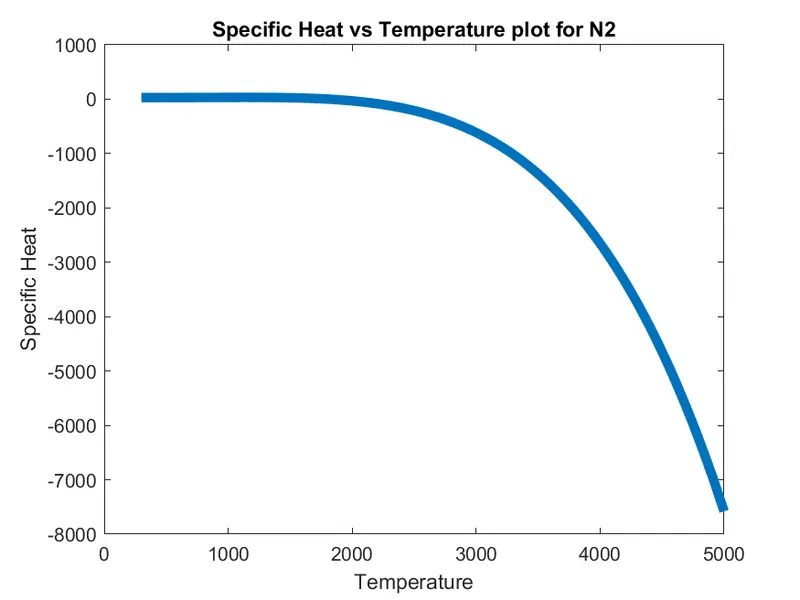
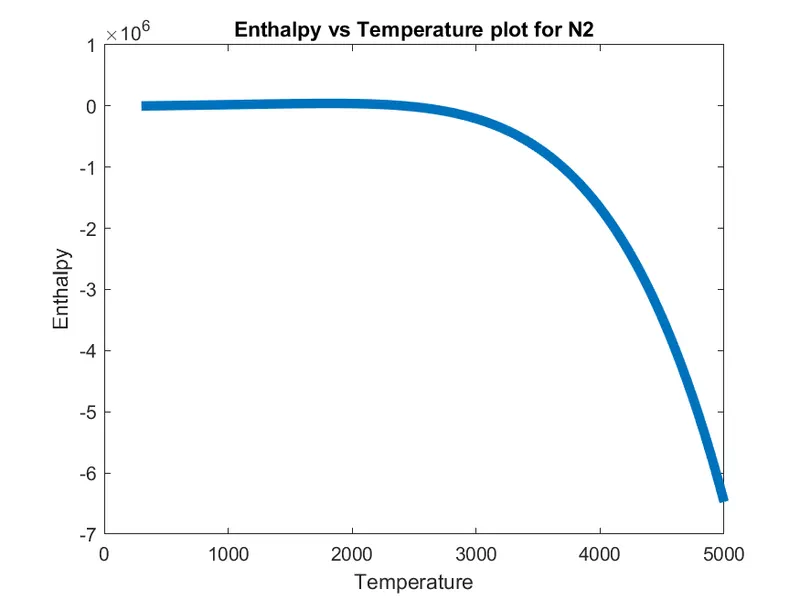
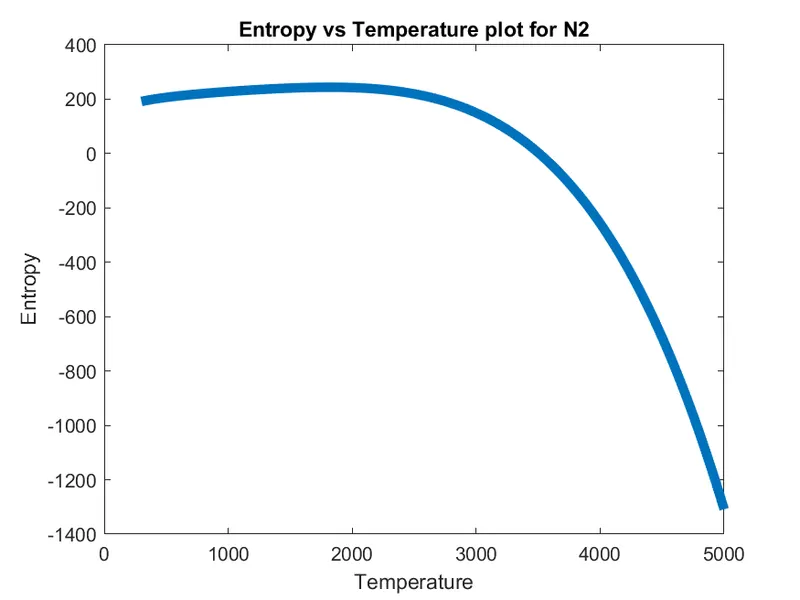
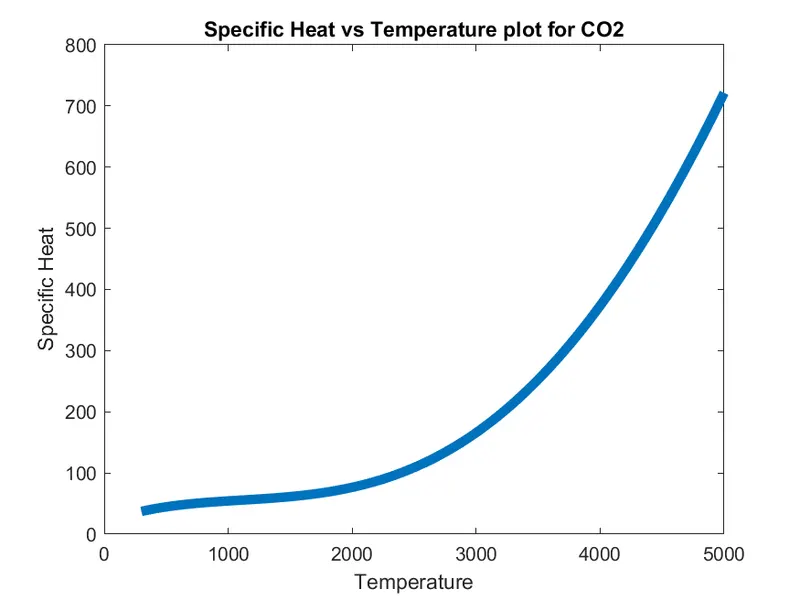
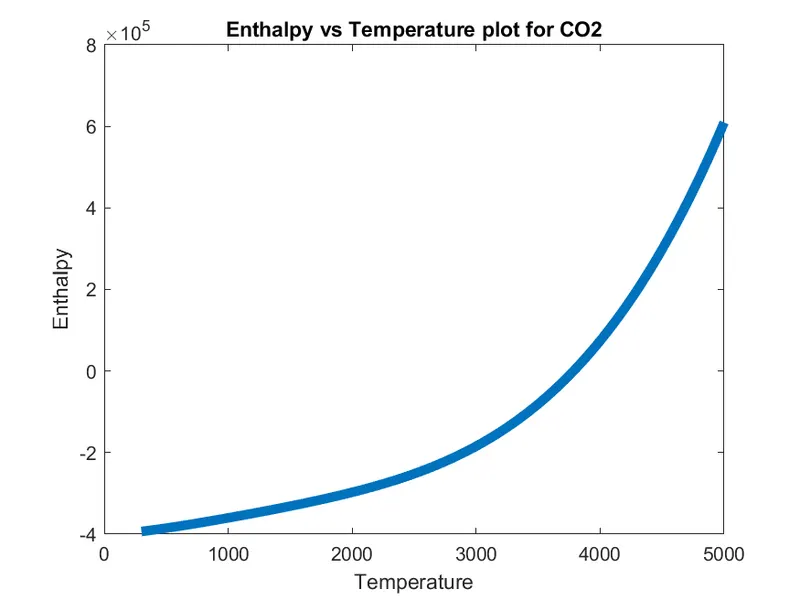
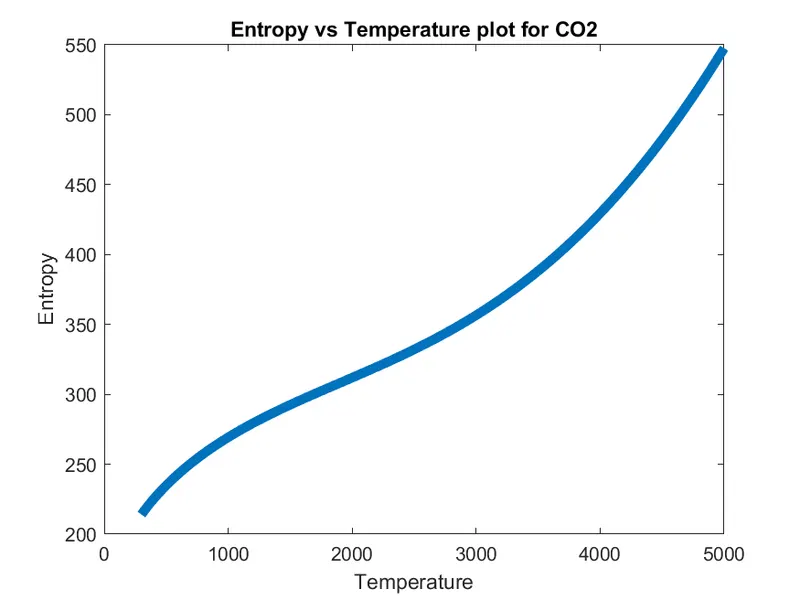
We have to plot the `Cp`, `H` and `S` data with local temperature range for every species. All the plots for each species have to save in different file with proper name and all files must be in a folder.
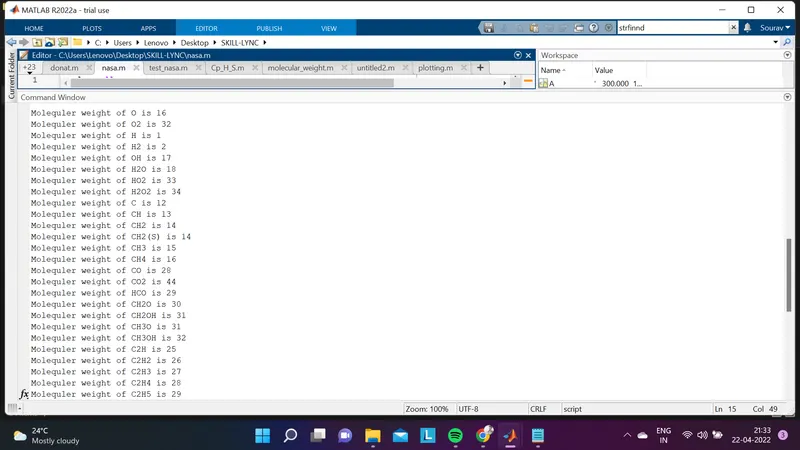
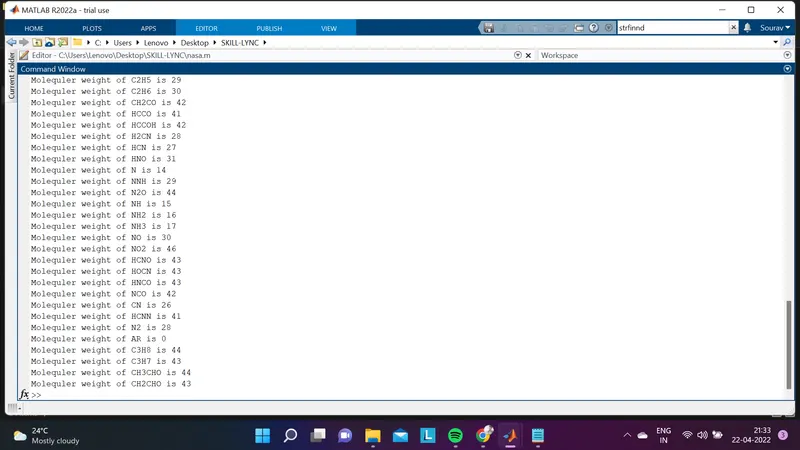
Also we have to calculate molecular weight of each species and that should be displayed on command window.
Specific Heat, Enthalpy & Entropy Calculation: The formulae for calculating Specific Heat(`Cp`), Enthalpy(`H`) & Entropy(`S`) are as below-
`Cp=R(a1+(a2*T)+(a3*T^2)+(a4*T^3)+(a5*T^4))`
`H=(R*T)(a1+(a2*T/2)+(a3*T^2/3)+(a4*T^3/4)+(a5*T^4/5)+(a6)/T)`
`S=R*((a1*lnT)+(a2*T)+(a3*T^2/2)+(a4*T^3/3)+(a5*T^4/4)+a7)`
Here T is the global temperature range. Universal Gas Constant(R) will be taken as a input and its value will be `8.314`. Now we will create a function name 'Cp_H_S' for calculating all three thermodynamic properties. Here temperature coefficients that would be useed for calculations are devided into two parts. 'ht1' to 'ht7' will be used as high temperature coefficients and 'lt1' to 'lt7' will be used as a low temperature coefficients. So in this function three output will be there, 'Cp', 'H' & 'S'. And inputs will be 7 high temperature coefficients, 7 low temperature coefficients, 'T'(Global temperature range), 'R'(Universal Gas Constant), Global minimum temperature, Global maximum temperature & Global mid temperature. Here we will also use 'if'-'else' command for calculating three thermodynamic properties for two different temperature coefficients. If values of Global temperature is greater than Global mid temperature then high temperature coefficients(ht1-ht7) will be used. Other wise low temperature coefficients(lt1-lt7) will be used.
so the function code will be-
function [Cp,H,S] = Cp_H_S(ht1,ht2,ht3,ht4,ht5,ht6,ht7,lt1,lt2,lt3,lt4,lt5,lt6,lt7,T,R,global_min_temp,global_mid_temp,global_max_temp)
if T>=global_mid_temp
    Cp=R.*(ht1+(ht2.*T)+(ht3.*T.^2)+(ht4.*T.^3)+(ht5.*T.^4))
    H=(R.*T).*(ht1+(ht2.*(T./2))+(ht3.*((T.^2)./3))+(ht4.*((T.^3)./4))+(ht5.*((T.^4)./5))+(ht6./T))
    S=R.*((ht1.*log(T))+(ht2.*T)+(ht3.*((T.^2)./2))+(ht4.*((T.^3)./3))+(ht5.*((T.^4)./4))+ht7)
else
    Cp=R.*(lt1+(lt2.*T)+(lt3.*T.^2)+(lt4.*T.^3)+(lt5.*T.^4))
    H=(R.*T).*(lt1+(lt2.*(T./2))+(lt3.*((T.^2)./3))+(lt4.*((T.^3)./4))+(lt5.*((T.^4)./5))+(lt6./T))
    S=R.*((lt1.*log(T))+(lt2.*T)+(lt3.*((T.^2)./2))+(lt4.*((T.^3)./3))+(lt5.*((T.^4)./4))+lt7)
end
end
MOLECULAR WEIGHT CALCULATION: Molecular weight or molecular mass is a measure of the sum of the atomic weight values of the atoms in a molecule. Here we have 53 different molecule. To calculate molecular weight of all 53 molecules we will write a function. In this function output will be molecular weight(MW) and input will be element name. Next we will call a cell array 'S' where all common molecule of 53 molecules will be included and thats are 'H', 'C', 'N', 'O' and 'AR'. Next we will call a array 'atomic_wt' which contain the atomic weight of all molecules given in cell array 'S' accordingly. Then we declear moleculer weight 'MW' as '0' at starting. After that we creat a 'for' loop where all operations inside the 'for' loop will be applied for all 53 species. Inside that 'for' loop one more 'for' loop, we will creat where all species of cell array 'S' will be considered for all operation. Inside that 'for' loop we will use 'if' loop and will compare all the element name with cell array 'S' to find identicals using 'strcmp' command. If there is any identical then for that identical moleculer weight will be calculated using array 'atomic_wt' by sequence of cell array 'S'. Here we will close the 'if' loop and second 'for' loop also. Then we will use 'str2double' command to convert character vector or string scalar to numeric scalar of all elements name to a new variable 'n'. Next we will run another 'if' loop where more than one primary molecules of cell array 'S' existence considered for moleculer weight calculation. So here condition will be if 'n' is greater than one then moleculer weight will be calculated as sum of moleculer weight of one molecule(as per cell array 'S') and (n-1) times of that perticuler molecule. For showing the moleculer weight in command window we will use 'fprintf' command. So the final code will be-
function [MW]=molecular_weight(element_name);
S={'H' 'C' 'N' 'O' 'AR'};%specifying all common molecules
atomic_wt=[1 12 14 16 40];%atomic weight of 4 common molecules respectively
MW=0;%initialising moleculer weight as zero
for i=1:length(element_name);
    for j=1:length(S);
        if strcmp(element_name(i),S(j));%finding identicals of all element names and common molecules
            MW=MW+atomic_wt(j);%declaring moleculer weights of all common molecules
            position=j;
        end
    end
    n=str2double(element_name(i));
    if n>1;
        MW=MW+atomic_wt(position)*(n-1);
    end
end
mol_wt(i)=MW;
fprintf('Molequler weight of %s is %d',element_name,mol_wt(i))%printing moleculer weight of all elements
molecular_wt=fopen('moleculer_wt.dat','a+');%creating a new file for storing moleculer weight data of all molecules
fprintf(molecular_wt,'Moleculer weight of %s is %f \n',element_name,mol_wt(i));%printing all the moleculer weight in the file
fclose(molecular_wt);
end
PLOTTING 'Cp', 'H' & 'S' WITH RESPECT TO 'T': Here we will creat a function where all three thermodynamic properties(Cp, S & H) will be ploted with resperct to temperature tange(T). So we will create function name 'plloting' with inputes of 'Cp', 'S', 'H', 'T' & element name. Now we will use 'mkdir' command to create new file where all plotes for different molecules will be saved. As we know for every different molecules there will be three plots, so we will use 'figure' command and will specify the nubber. Then using 'plot' command 'Cp' vs 'T' graph will be ploted and then proper name of plot & label will be given. For saving the particular plot in a particular file with name of that perticular molecule we will use 'saveas' command. Inside that command 'gcf' command will be use for specifying the current figure that will bve saved and also 'fullfile' command will be used for specifying the proper file path. As like this plot, other two plots will be saved. So the final function come will look like below.
function plotting(Cp,H,S,T,element_name)
mkdir('nasa.thermo',element_name)
figure(1)
plot(T,Cp,'LineWidth',5)
xlabel('Temperature')
ylabel('Specific Heat')
title(sprintf('Specific Heat vs Temperature plot for %s',element_name))
saveas(gcf,fullfile('C:','Users','Lenovo','Desktop','SKILL-LYNC','nasa.thermo',element_name,'Cp_vs_T.png'))
figure(2)
plot(T,S,'LineWidth',5)
xlabel('Temperature')
ylabel('Entropy')
title(sprintf('Entropy vs Temperature plot for %s',element_name))
saveas(gcf,fullfile('C:','Users','Lenovo','Desktop','SKILL-LYNC','nasa.thermo',element_name,'S_vs_T.png'))
figure(3)
plot(T,H,'LineWidth',5)
xlabel('Temperature')
ylabel('Enthalpy')
title(sprintf('Enthalpy vs Temperature plot for %s',element_name))
saveas(gcf,fullfile('C:','Users','Lenovo','Desktop','SKILL-LYNC','nasa.thermo',element_name,'H_vs_T.png'))

end
MAIN PROGRAMME: In main programme first we will diclear the value of 'R' as 8.314. Then we will use 'fopen' command to read the file 'THERMO.dat'. To read all the line we will use 'fgetl' command. First line is not so importent, so we will simply skip the line by using 'fgetl' command. Then declear a variable 'A' as second line using 'fgetl' command. Next from second line three number will be seperated as 'global_min_temp' for first one, 'global_mid_temp' for second one and 'global_max_temp' for third one. And will also use 'str2num' command to convert those temperature values from string to numeric. Next we will use 'linspace' command to get local temperature range as 'T' and its limit will be 500 values from global minimun temperature to global maximum temperature. Next three line is not so importent, so will skip those lines using 'fgetl' command. Rest of the lines are about co-efficients of 53 molecules. Now we will declear a new variable 'B' for to get the first line of first molecule. Then we will use 'strtok' command to seperate set of first string untill space(' '), that is nothing but the element name. We will get next three line with different variable('a1' 'a2' 'a3') using 'fgetl' command. Then using 'strfind' command will find string 'E' among all other strings that is seperating co-efficients. Next we will declear new variables ('ht1' to 'ht7' for first seven high temperature co-efficients and 'lt1' to 'lt7' for last 7 low temperature co-efficients) where co-efficients will be numeric from string values using 'str2double' command. After that function 'Cp_H_S' will be used for calculatig 'Cp', 'H', and 'S' values. Then 'plotting' function will be used for plotting all the graphes and saving them into perticuler folder. And lastly function 'moleculer_weight' will be used for calculating moleculer weight of all molecules and showing them in command window as well as saving them into a seperate file. So the final code will be
close all
clear all
clc


R=8.314
F=fopen('THERMO.dat','r');
fgetl(F)
A=fgetl(F)
%temp=A(20+3:30)
global_min_temp=str2num(A(1+3:10))
global_mid_temp=str2num(A(10+3:20))
global_max_temp=str2num(A(20+3:30))

T=linspace(global_min_temp,global_max_temp,500);

for i=1:3
    fgetl(F)
end

for j=1:53
B=fgetl(F);
element_name=strtok(B);

a1=fgetl(F);
a2=fgetl(F);
a3=fgetl(F);

l1=strfind(a1,'E');
l2=strfind(a2,'E');
l3=strfind(a2,'E');

ht1=str2double(a1(1:l1(1)+3));
ht2=str2double(a1(l1(1)+3+1:l1(2)+3));
ht3=str2double(a1(l1(2)+3+1:l1(3)+3));
ht4=str2double(a1(l1(3)+3+1:l1(4)+3));
ht5=str2double(a1(l1(4)+3+1:l1(5)+3));
ht6=str2double(a2(1:l2(1)+3));
ht7=str2double(a2(l2(1)+3+1:l2(2)+3));


lt1=str2double(a2(l2(2)+3+1:l2(3)+3));
lt2=str2double(a2(l2(3)+3+1:l2(4)+3));
lt3=str2double(a2(l2(4)+3+1:l2(5)+3));
lt4=str2double(a3(1:l3(1)+3));
lt5=str2double(a3(l3(1)+3+1:l3(2)+3));
lt6=str2double(a3(l3(2)+3+1:l3(3)+3));
lt7=str2double(a3(l3(3)+3+1:l3(4)+3));

[Cp H S] = Cp_H_S(ht1,ht2,ht3,ht4,ht5,ht6,ht7,lt1,lt2,lt3,lt4,lt5,lt6,lt7,T,R,global_min_temp,global_mid_temp,global_max_temp);

plotting(Cp,H,S,T,element_name)

[MW]=molecular_weight(element_name);

end
Here are the screenshots of command window showing moleculer weight of all 53 elements.
And below screenshot is about the folder where all figures of element's plot are saved.

Plots for O2:
Plots for N2:
Plots for CO2:
Link for all plots file:
https://drive.google.com/drive/folders/1BR_HoXa2At69CwaCLGL_iJkCK94bsgJ3?usp=sharing
Link for moleculer weight file:
https://drive.google.com/file/d/1qjAM7MotZjyARxK5c_9V6zD3p10ClCPR/view?usp=sharing
Reference: