Project 1 - Parsing NASA thermodynamic data
AIM_ To write a code in Matlab to parse the data of the NASA thermodynamic properties of the various gases species and evaluate the thermodynamic properties such as cp, H, and S, and also document the coefficients that are required to evaluate these polynomials for 1000+ species.
Explanation about parsing- In a computer science file parsing a file means reading a data stream of some sort and building in a memory model of the semantic content of the data. this aims at facilitating performing some kind of transformation on the data.
Parsing splits up the file into pieces of data that can be easily stored or manipulated.
Data Source-
1)NASA thermodynamic data file-https://drive.google.com/file/d/1AikCHDlz9s_fu8whE81qee_GD4AyYpCP/view?usp=sharing
2) The file contains coefficients required to calculate the polynomials taht can be used to evaluate the thermodynamic properties such as the entropy(s), specific heat(cp) and the enthalpy(h).
3) SO the equations to calculate the cp and the H and s are as foloows-
- cp/R = a1 +a2*T + a3*T^2 +a4*T^3+a5*T^4
- H/RT = a1+a2*T/2 +a3*T^2/3 + a4*T^3/4 + a5*T^4/5+ a6/T
- s/R = a1*lnT +a2*T +a3*T^2/2 +a4*T^3/3 +a5*T^4/4 +a*7
The 1st 7 coefficient are high-temperature coefficients and the last 7 coefficients are low-temperature coefficients. Also use the local temperature ranges which are unique for each individual species, not the global temperature ranges.
code - of the file parsing -
% Program to do the file parsing from the NASA thermodynamic data given

clear all
close all
clc

% Reading the file from the thermodynamic data file
f1 = fopen('THERMO.dat','r') ;
fgetl(f1) ;

% Global temperatures
t_line = fgetl(f1) ;
a_temp = strsplit(t_line,' ') ;
global_low_temp = str2double(a_temp{2}) ;
global_mid_temp = str2double(a_temp{3}) ;
global_high_temp = str2double(a_temp{4}) ;
% neglecting the 3 lines
fgetl(f1) ;
fgetl(f1) ;
fgetl(f1) ;

% Reading species back
for i = 1:53
    t_line2 = fgetl(f1) ;
    s = strsplit(t_line2,' ') ;
    species_name = s{1} ;
    A = strfind(t_line2,'G') ;
    temp_values = t_line2(A+4:length(t_line2)) ;
    B = strsplit(temp_values,' ') ;
    local_low_temp = str2double(B{1}) ;
    local_mid_temp = str2double(B{2}) ;
    local_high_temp = str2double(B{3}) ;
    t_line = fgetl(f1);
    a = findstr(t_line , 'E') ;

    % Then we have to extract the coefficients from the thermodynamic datas

    % 1 st coefficients
    a1 = t_line(1:a(1)+3) ;
    a1 = str2num(a1) ;

    % 2 nd coefficient
    a2 = t_line(a(1)+4:a(2)+3) ;
    a2 = str2num(a2) ;

    % 3rd coefficient
    a3 = t_line(a(2)+4:a(3)+3) ;
    a3 = str2num(a3) ;

    % 4th coefficient
    a4 = t_line(a(3)+4:a(4)+3) ;
    a4 = str2num(a4) ;

    % 5 th coefficient
    a5 = t_line(a(4)+4:a(5)+3) ;
    a5 = str2num(a5) ;

    % line 2

    line2 = fgetl(f1) ;
    % 6 th coefficients
    a6 = line2(1:a(1)+3) ;
    a6 = str2num(a6) ;

    a7 = line2(a(1)+4:a(2)+3) ;
    a7 = str2num(a7) ;
    a8 = line2(a(2)+4:a(3)+3) ;
    a8 = str2num(a8) ;
    % 9 th coefficients
    a9 = line2(a(3)+4:a(4)+3) ;
    a9 = str2num(a9) ;
    % 10 th coefficient
    a10 = line2(a(4)+4:a(5)+3) ;
    a10 = str2num(a10);

    line3 = fgetl(f1) ;
    a11 = line3(1:a(1)+3) ;
    a11 = str2num(a11) ;
    a12 = line3(a(1)+4:a(2)+3) ;
    a12 = str2num(a12) ;

    a13 = line3(a(2)+4:a(3)+3) ;
    a13 = str2num(a13) ;

a14 = line3(a(3)+4:a(4)+3) ;
a14 = str2num(a14) ;

    % universal gas constant
    R = 8.314 ;

    t = linspace(local_low_temp,local_high_temp,100) ;

    % to calculate the thermodynamic parameters
    c_p = specific_heat(a1,a2,a3,a4,a5,a6,a7,a8,a9,a10,a11,a12,a13,a14,local_low_temp,local_mid_temp,local_high_temp,t,R) ;

    % to calculate enthalpy
    H = enthalpy(a1,a2,a3,a4,a5,a6,a7,a8,a9,a10,a11,a12,a13,a14,local_low_temp,local_mid_temp,local_high_temp,t,R) ;
    % to calculate the entropy
    s = entropy(a1,a2,a3,a4,a5,a6,a7,a8,a9,a10,a11,a12,a13,a14,local_low_temp,local_mid_temp,local_high_temp,t,R) ;

    % Creating a folder
    mkdir(['C:',species_name])
    cd(species_name)

    % plotting for
    % Temperature vs specific heat
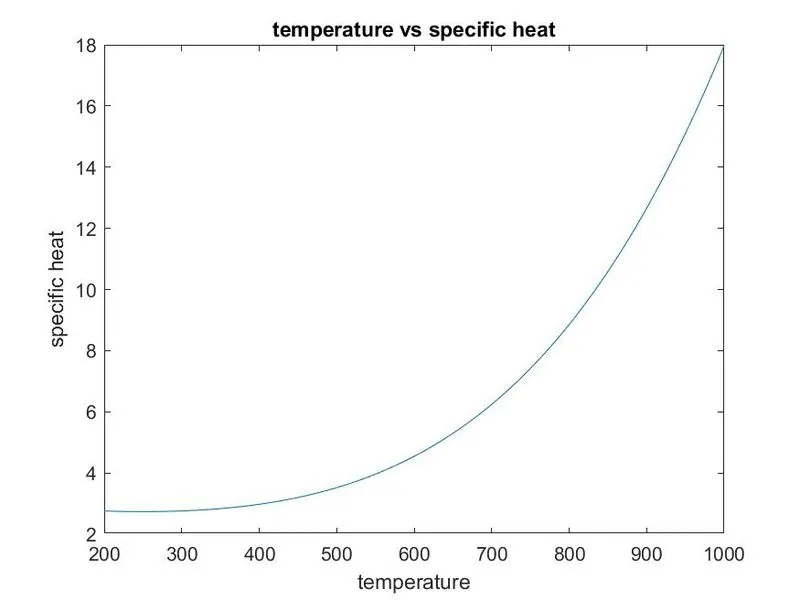
    figure(1)
    plot(t,c_p)
    xlabel('temperature')
    ylabel('specific heat')
    title('temperature vs specific heat')
    image = getframe(gcf) ;
    imwrite(image.cdata,'t vs cp.png') ;
    saveas(1,'specific heat','jpg')

    % Temperature vs enthalpy plot
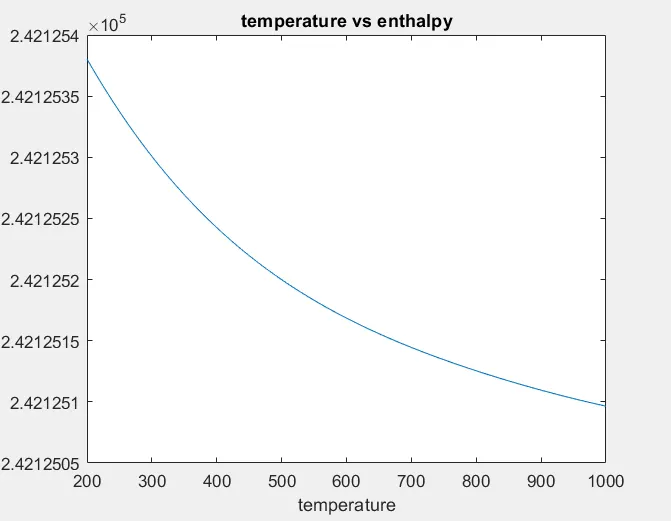
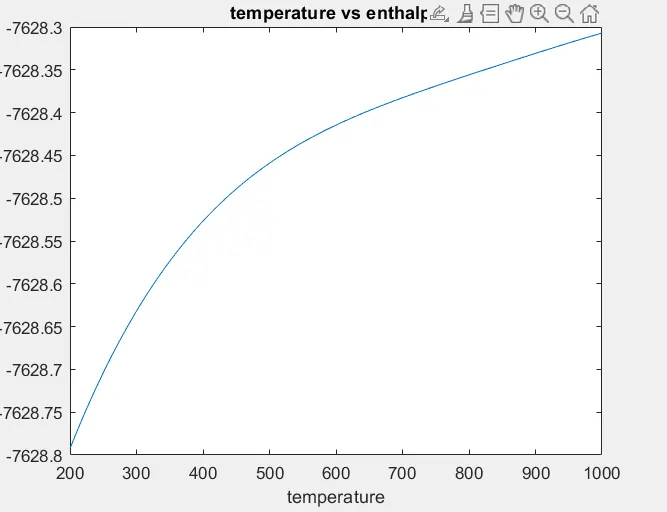
    figure(2)
    plot(t,H)
    xlabel( 'temperature')
    ylabel('enthalpy')
    title('temperature vs enthalpy')
    image = getframe(gcf) ;
    imwrite(image.cdata,'t vs H.png') ;
saveas(2,'enthalpy','jpg') ;


    % temperature vs entropy
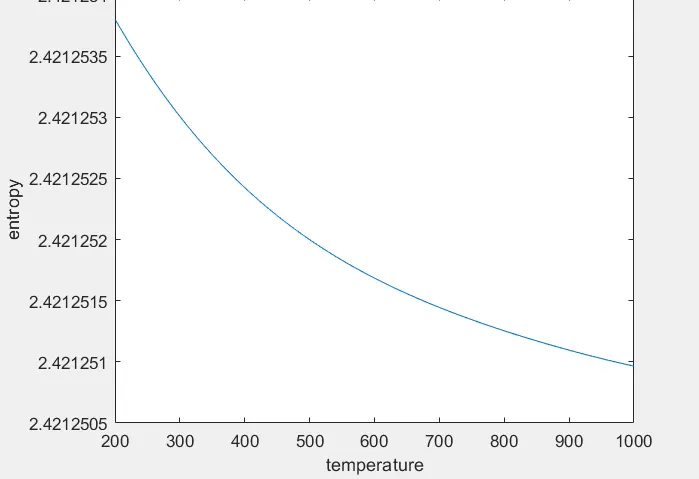
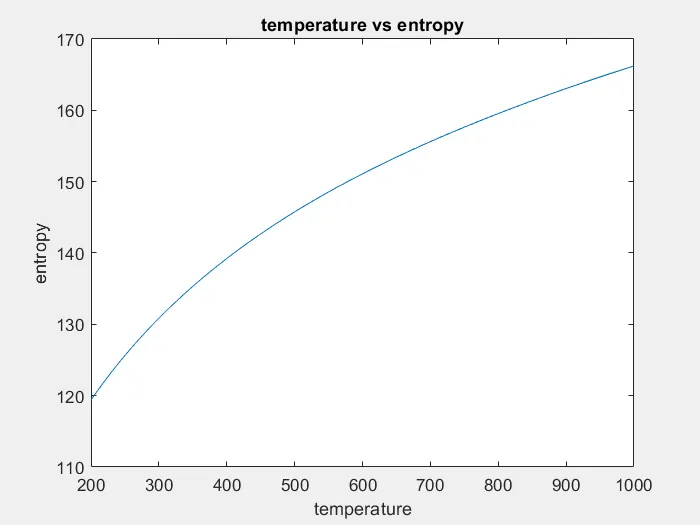
    figure(3)
    plot(t,s)
    xlabel('temperature')
    ylabel('entropy')
    title('temperature vs entropy')
    image = getframe(gcf) ;
    imwrite(image.cdata,'t vs s.png')
    saveas(3,'entropy','jpg')
    cd

    % calculating molecular mass
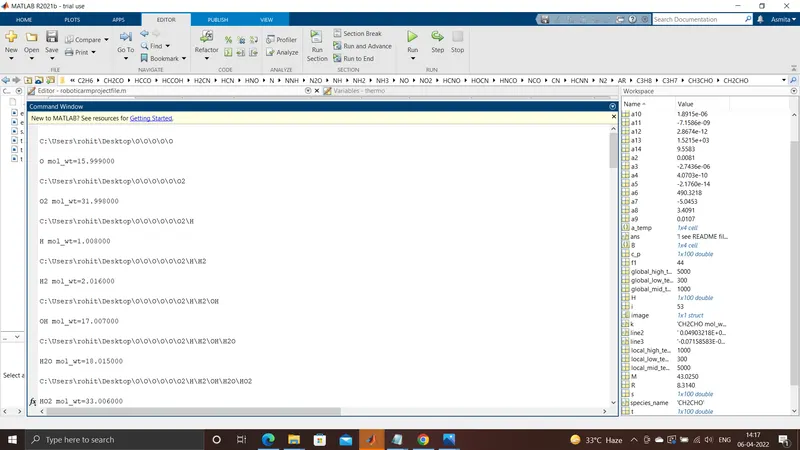
    [M] = molecular_wt(species_name) ;
    k = sprintf('%s mol_wt=%f',species_name,M) ;
    disp(k)
end
#)Explanations of the code-
1) We are using the fopen command to open the thermodynamic data file and the use the fgetl command to extract the thermodynamic datas and the global temperature data is stored in the t_line variable.
2) Then strsplit command is used to convert it into some string, it is stored in the atemp and the delimiter ' ' is used to extract the temperature string.
3) Then str2double is used extract each temperature whose position is used at the second , third and the fourth position. The position used is (a_temp{2}) and the (a_temp{3}) and the (a_temp{4}).
4) Then the three lines does not contain any important data to be used . so it is to be negelcted using the fgetl command . The format is the fgetl(f1) command for the three times to neglect the three lines.
5) After that the local temperature of each and every molecule is extracted using the same format for the global temperature.
the strfind command is used to find out the position of the exponential because that will help us to extract the position of the exponential because it will help to extract the entire value of the coefficients.
6) Now to read the species data we have to use the for loop from i = 1:53 . t_ine 2 is the variable in which the string is stored. then the 14 coefficients of each and every molecule are stored from coefficients 1 to 14.
7) Then the temperature array is defined from local low temperature to local high temperature and 100 divisions is done in the array.
8) Then the function of the c_p , s ,H and molecular_wt is coded separately for the specific heat, entropy and the enhalpy and the molecular weight . it is called
into the main function by the functions.
#) Code for the specific heat
function [c_p] = specific_heat(a1,a2,a3,a4,a5,a6,a7,a8,a9,a10,a11,a12,a13,a14,local_low_temp, local_mid_temp,local_high_temp,t,R)

if(t>local_mid_temp)

    c_p =  (a1+(a2.*t))+(a3.*(t.^2))+(a4.*(t.^3)) + (a5.*(t.^4))*R ;
else
    c_p = (a8+(a9.*t))+(a10.*(t.^2))+(a11.*(t.^3))+(a12.*(t.^4))*R ;
end
end
#) code for the entropy function
% 4) Function for entropy
function [s] = entropy(a1,a2,a3,a4,a5,a6,a7,a8,a9,a10,a11,a12,a13,a14,local_low_temp,local_mid_temp,local_high_temp ,t,R)
if(t>local_mid_temp)
    s = ((a1.*log(t))) +(a2.*t)+(((a3.*t.^2))/2) + ((a4.*(t.^3))/3) + ((a5.*(t.^4))/4) +(a7) ;
else
    s = (a8.*log(t) +(a9.*t)+ ((a10.*(t.^2))/2) + ((a11.*(t.^3))/3)+((a12.*(t.^4))/4) +a14)*R ;

end
end
#) Function for enthalpy-
% 3) Function for enthalpy
function [H] = enthalpy(a1,a2,a3,a4,a5,a6,a7,a8,a9,a10,a11,a12,a13,a14,local_low_temp,local_mid_temp,local_high_temp,t,R)
if(t>local_mid_temp)
    H = (a1+(a2.*t)./2) +((a3.*(t.^2))./3) + ((a4.*(t.^3))./4) + ((a5.*(t.^4))./5) + (a6./t).*(R.*t) ;
else
    H = (a8+((a9.*t)/2)) + (((a10.*t.^2))./3) + (((a11.*t.^3))./4) + (((a12.*t.^4))./5) +(a13./t).*(R.*t) ;
end
end
#) Function for the molecular weight
% Function for molecular weight
% Creating function for molecular weight
function [M] = molecular_wt(species_name)
atomic_mass = [15.999,1.008,12.001,14,39.948] ;
elements = ['O','H','C','N','A'] ;
mol_wt = 0 ;
% Now using two for loops to read the string
for i = 1: length(species_name)
    for j = 1:length(elements)
        if strcmpi(species_name(i),elements(j)) ;
            mol_wt = mol_wt +atomic_mass(j) ;
            Z = j ;
        end
    end
    t = str2double(species_name(i)) ;
    if(t>1)
        mol_wt = mol_wt +(atomic_mass(Z)*(t-1)) ;
    end
end
M = mol_wt ;
end
- Outcomes of the project -
#) Output plots-
For monoatomic oxygen- o
#) Entropy vs temperature-
#)graph of enthalpy and temperature-
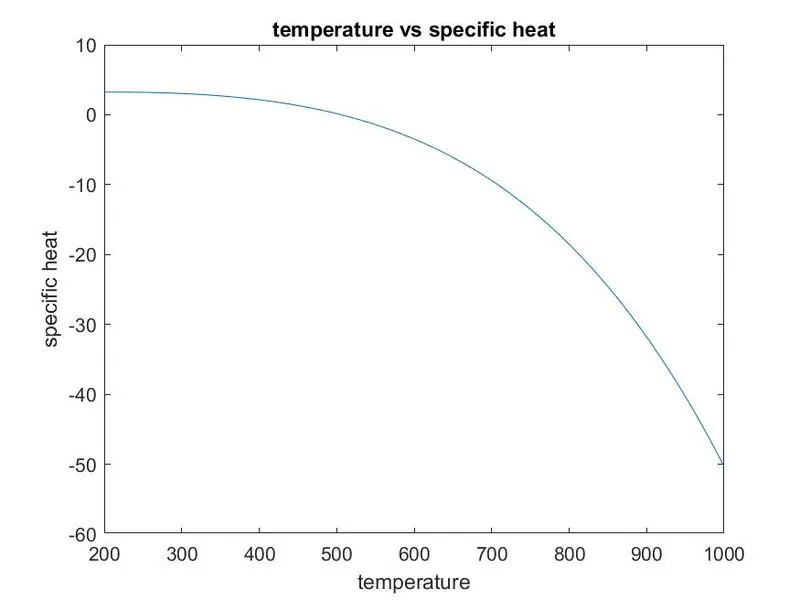
#) For the H2 molecule
-) graph between specific heat and temperature
3) Graph between enropy and temperature-
#) plot between enthalpy and temperature
#) for different molecules the atomic mass is calculated it is shown as follows-
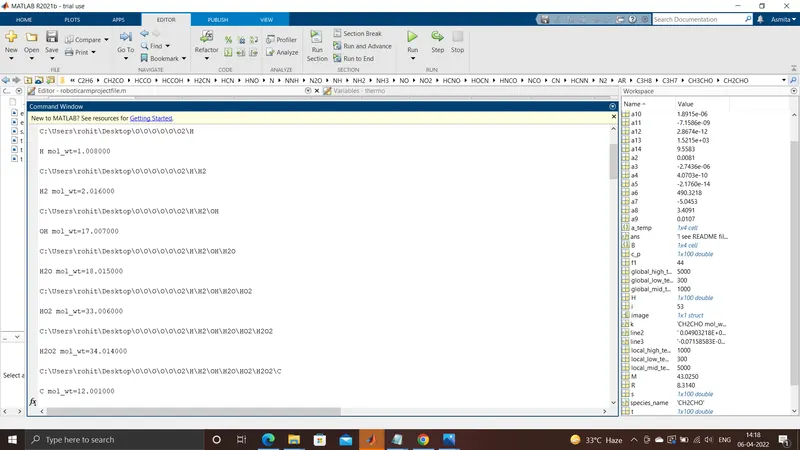
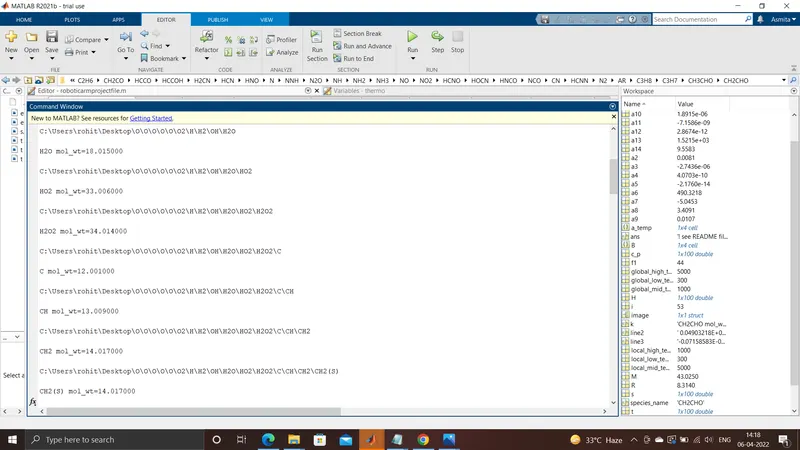
#) Screenshot of the workspace showing different molecules and their thermodynamic parameter calculation
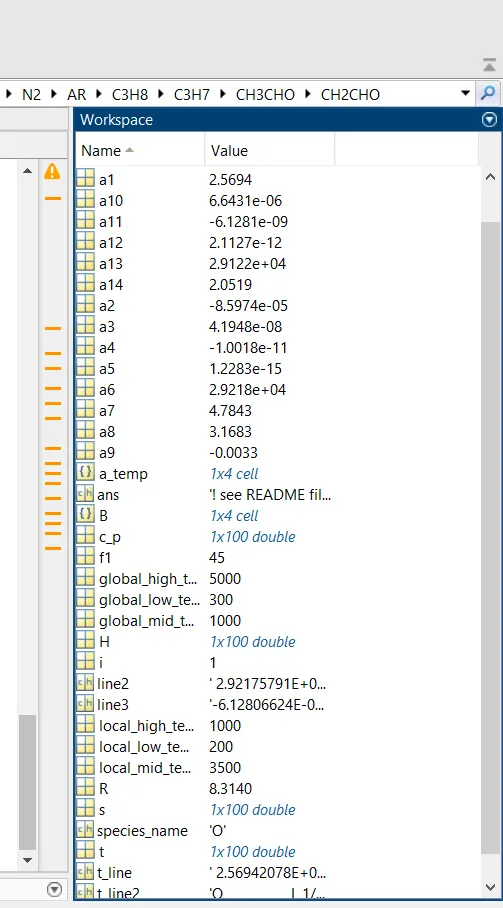
#) Screenshot showing the different plots for the different molecules

#) Problems faced in the project-
There was certain problem in calculating the coefficients. It was fixed by refining the logic to extract the code
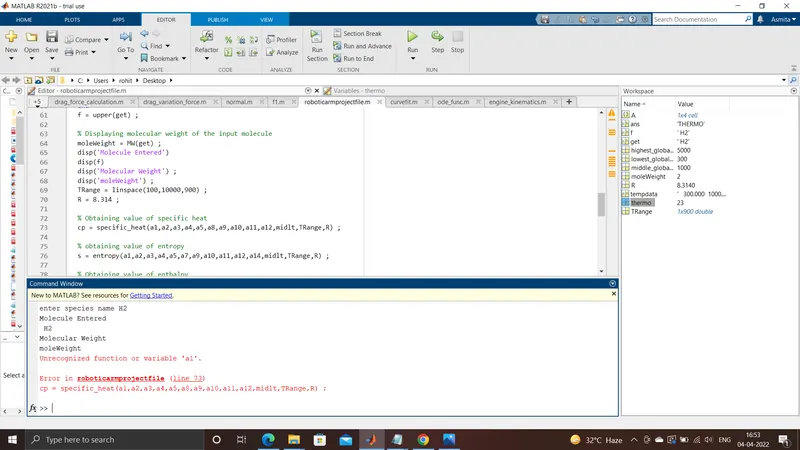
2)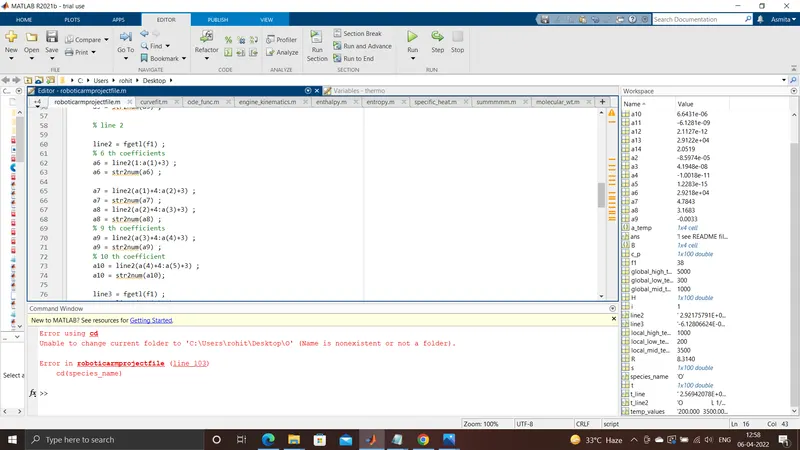
The wrong syntax was used in the cd . It was corrected.
3) Problem in mkdir -
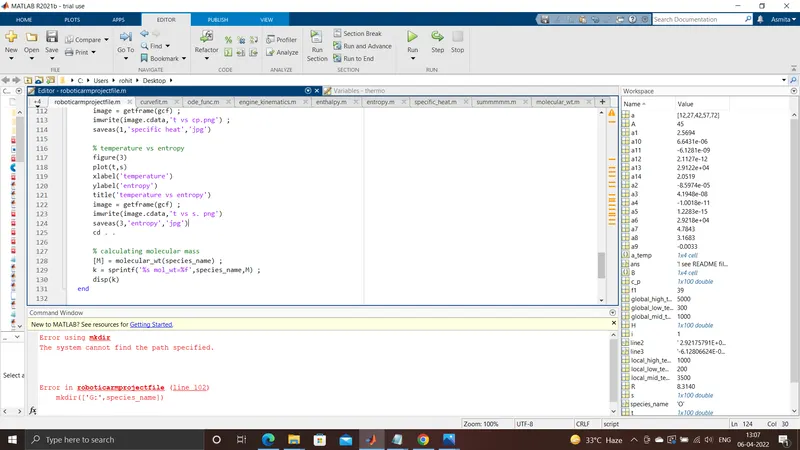
The wrong syntax was used one semi colon was not used.
Conculsion-
1) The file parsing was done for all the molecules and the plot and molecular weight of the molecules are calculated.
2) The graph of monoatomic oxygen and hydrogen is plotted.
3) Molecular weights are calculated and screenshots are being pasted.