Project 1 - Parsing NASA thermodynamic data
AIM:
Parse the NASA thermodynamic data file.
FORMULA USED:
Cp/R = a1 + a2*T + a3*(T^2) + a4*(T^3) + a5*(T^4)
H/RT = a1 + a2*T/2 + a3*(T^2)/3 + a4*(T^3)/4 + a5*(T^4)/5 + a6/T
S/R = a1*lnT + a2*T + a3*(T^2)/2 + a4*(T^3)/3 + a5*(T^4)/4 + a7
where, Cp is the specific heat capacity
H is the enthalpy
S is the entropy
T is the temperature
R is the universal gas constant
a1 to a7 are the coefficients as provided in the thermodynamic data
OBJECTIVES:
1. Write a function that extracts the 14 coefficients and calculates the enthalpy, entropy and specific heats for all the species in the data file.
2. Calculate the molecular weight of each species and display it in the command window.
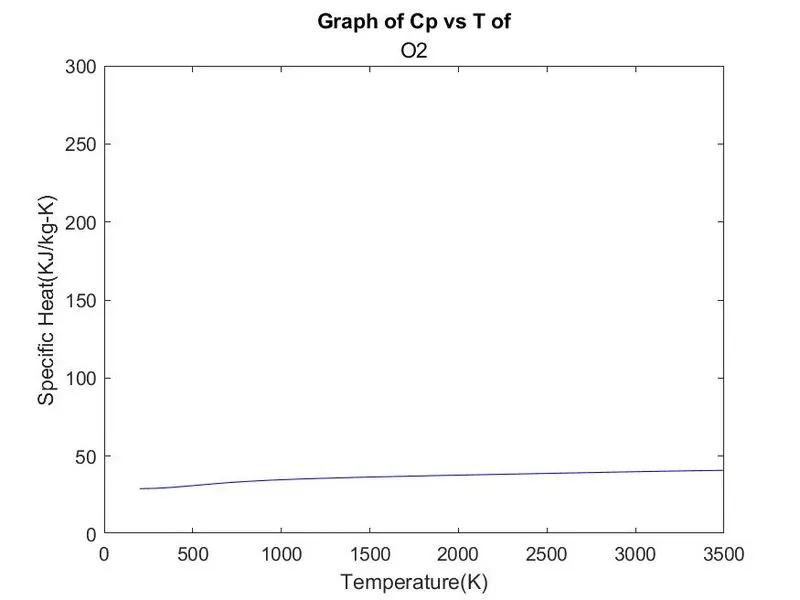
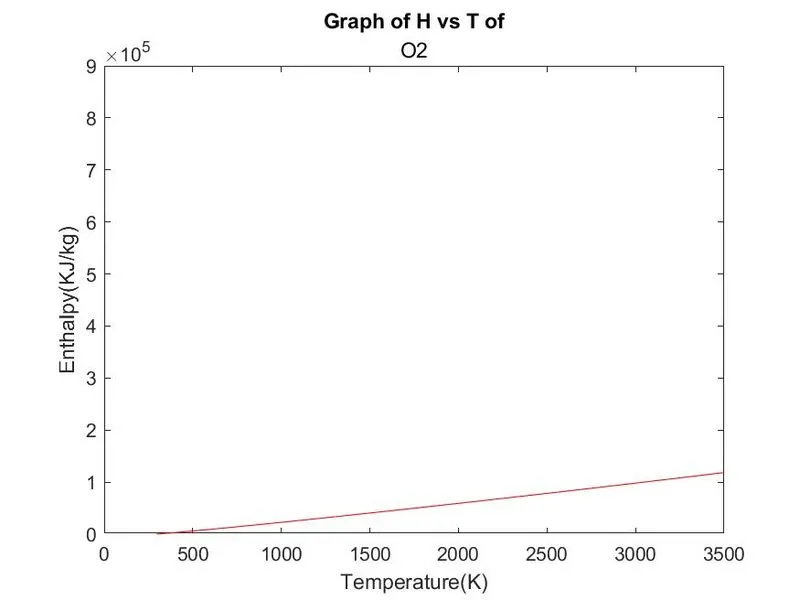
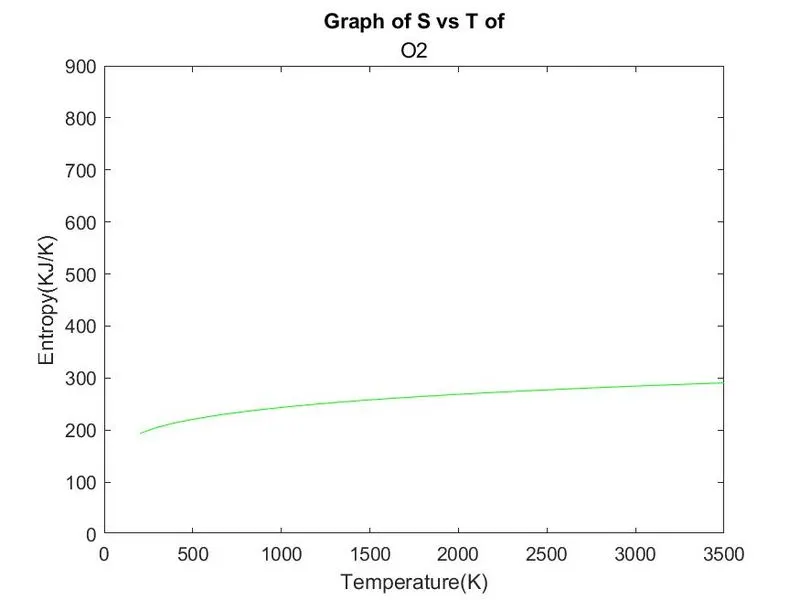
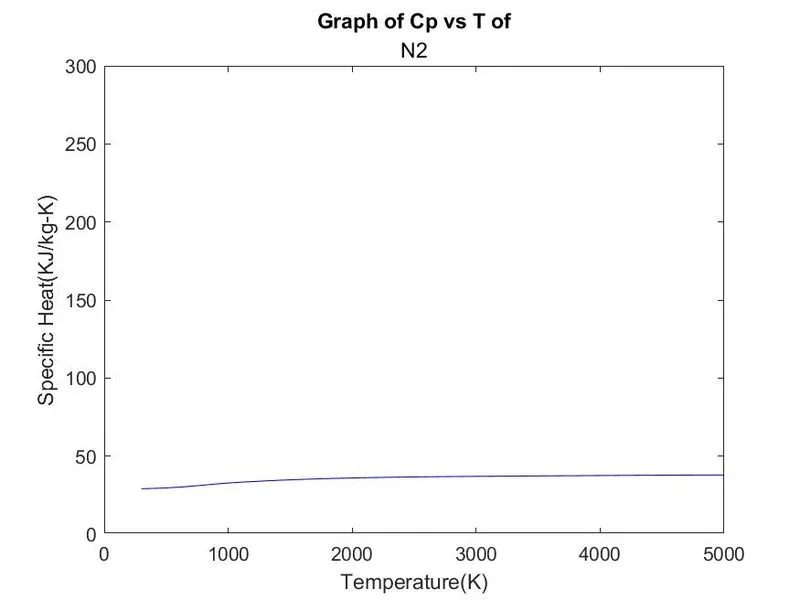
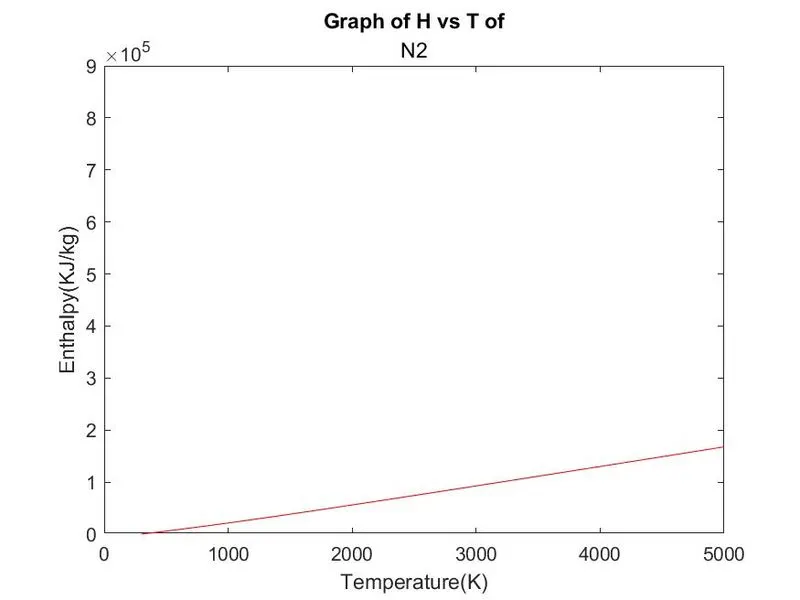
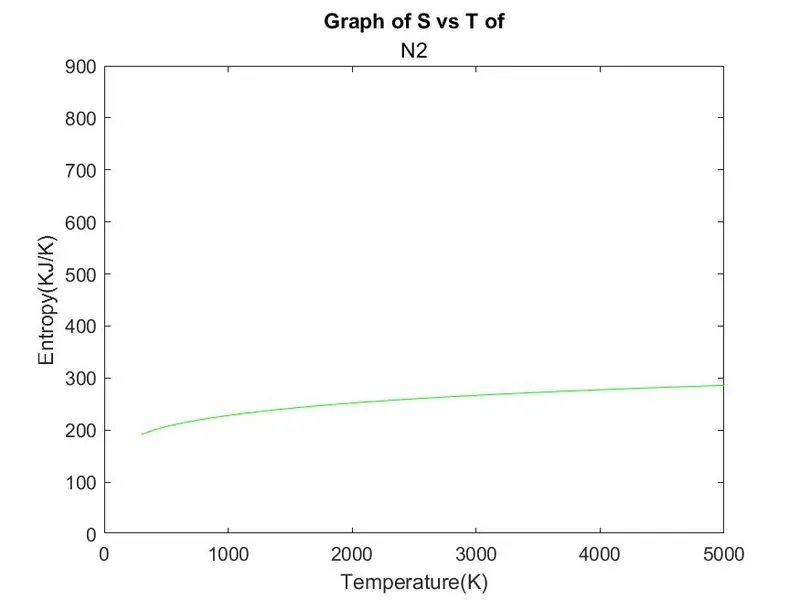
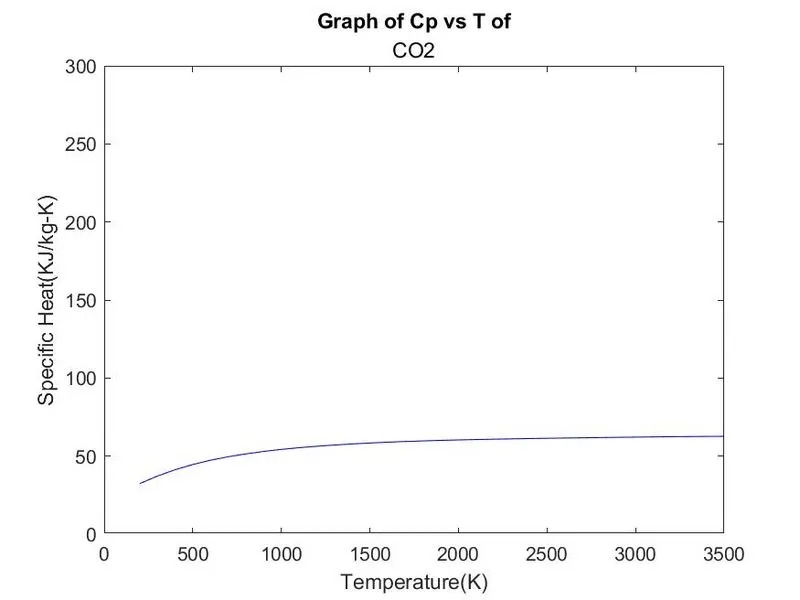
3. Plot the Cp, Enthalpy and Entropy for the local temperature range.
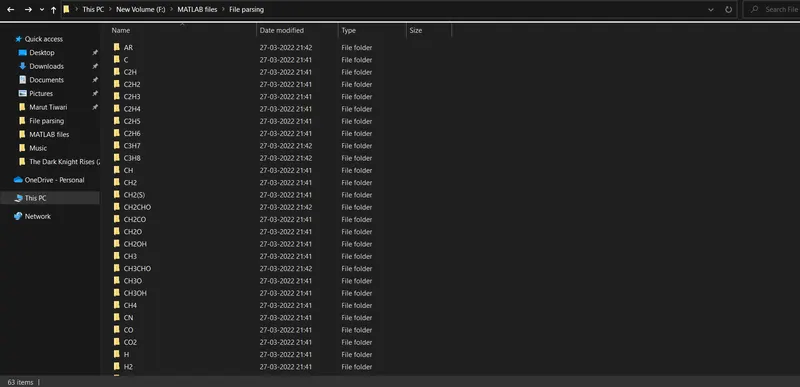
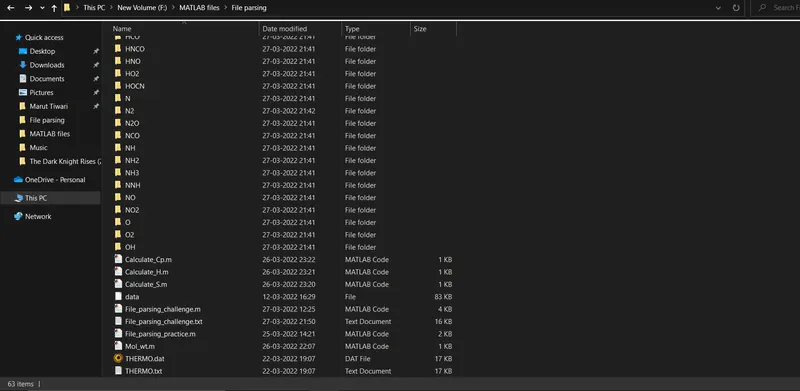
4. Save the plots as images with appropriate names and dump them in seperate folders.
MAIN CODE:
%NASA data file parsing

%Access to the file
A= fopen('THERMO.dat','r');
fgetl(A)
%Reading data
nasa_data= fscanf(A,'%c');
B= strsplit(nasa_data,'\n');
%Universal gas constant
R= 8.314;

%Line numbered 1 of the species
species_line_1= linspace(5,213,53);

%Extracting info
for i=species_line_1
    %Line numbered 1 of the species
    species_line1= B{i};
    C= strsplit(species_line1,' ');
    %Name of species/molecule
    species_name= C{1};
    Molecular_weight= Mol_wt(species_name);
    %Temperature limits
    local_low_temp= str2double(C{end-3});
    local_mid_temp= str2double(C{end-1});
    local_high_temp= str2double(C{end-2});
    T= local_low_temp:100:local_high_temp;

    %Line numbered 2 of the species
    species_line2= B{i+1};
    %Line numbered 3 of the species
    species_line3= B{i+2};
    %Line numbered 4 of the species
    species_line4= B{i+3};


    %Extracting coefficients from line 2
    D= strfind(species_line2,'E');
    a1_1= species_line2(1:D(1)+3);
    a1= str2double(a1_1);
    a2_1= species_line2(D(1)+4:D(2)+3);
    a2= str2double(a2_1);
    a3_1= species_line2(D(2)+4:D(3)+3);
    a3= str2double(a3_1);
    a4_1= species_line2(D(3)+4:D(4)+3);
    a4= str2double(a4_1);
    a5_1= species_line2(D(4)+4:D(5)+3);
    a5= str2double(a5_1);

    %Extracting coefficients from line 3
    E= strfind(species_line3,'E');
    a6_1= species_line3(1:E(1)+3);
    a6= str2double(a6_1);
    a7_1= species_line3(E(1)+4:E(2)+3);
    a7= str2double(a7_1);
    a8_1= species_line3(E(2)+4:E(3)+3);
    a8=str2double(a8_1);
    a9_1= species_line3(E(3)+4:E(4)+3);
    a9= str2double(a9_1);
    a10_1= species_line3(E(4)+4:E(5)+3);
    a10= str2double(a10_1);

    %Extracting coefficients from line 4
    F= strfind(species_line4,'E');
    a11_1= species_line4(1:F(1)+3);
    a11= str2double(a11_1);
    a12_1= species_line4(F(1)+4:F(2)+3);
    a12= str2double(a12_1);
    a13_1= species_line4(F(2)+4:F(3)+3);
    a13= str2double(a13_1);
    a14_1= species_line4(F(3)+4:F(4)+3);
    a14= str2double(a14_1);


    %Calculating heat capacity, enthalpy, entropy
    Cp= zeros(1,length(T));
    H= zeros(1,length(T));
    S= zeros(1,length(T));
    for j= 1:length(T)
        Cp(j)= Calculate_Cp(a1,a2,a3,a4,a5,a8,a9,a10,a11,a12,local_mid_temp,T(j),R);
        H(j)= Calculate_H(a1,a2,a3,a4,a5,a6,a8,a9,a10,a11,a12,a13,local_mid_temp,T(j),R);
        S(j)= Calculate_S(a1,a2,a3,a4,a5,a7,a8,a9,a10,a11,a12,a14,local_mid_temp,T(j),R);
    end


    %Creating new folder
    mkdir(species_name)
    %changing directory
    cd(species_name)

    %Graph of Cp vs T
    figure(1)
    plot(T,Cp,'color','b')
    xlabel('Temperature(K)')
    ylabel('Specific Heat(KJ/kg-K)')
    title('Graph of Cp vs T of',sprintf('%s',species_name))
    axis([0 local_high_temp 0 300])
    saveas(figure(1),'Cp vs T.jpg')

    %Graph of H vs T
    figure(2)
    plot(T,H,'color','r')
    xlabel('Temperature(K)')
    ylabel('Enthalpy(KJ/kg)')
    title('Graph of H vs T of',sprintf('%s',species_name))
    axis([0 local_high_temp 0 900000])
    saveas(figure(2),'H vs T.jpg')

    %Graph of S vs T
    figure(3)
    plot(T,S,'color','g')
    xlabel('Temperature(K)')
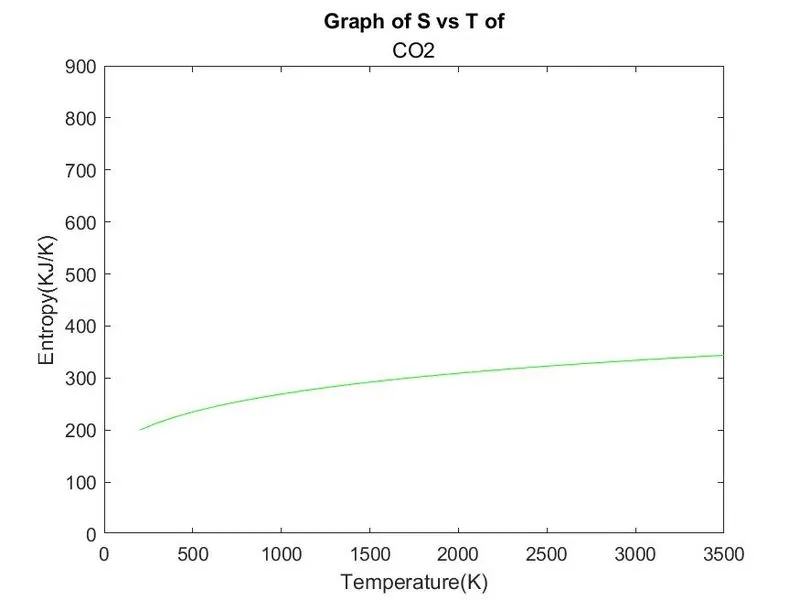
    ylabel('Entropy(KJ/K)')
    title('Graph of S vs T of',sprintf('%s',species_name))
    axis([0 local_high_temp 0 900])
    saveas(figure(3),'S vs T.jpg')

    %Coming back to program directory
    cd ..
end
OUTPUT:
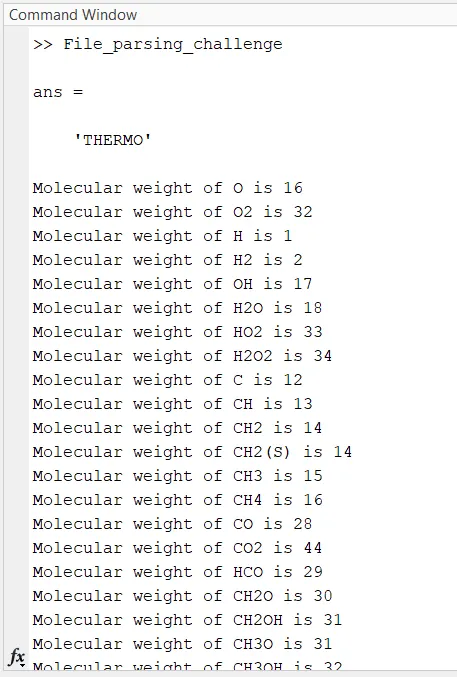
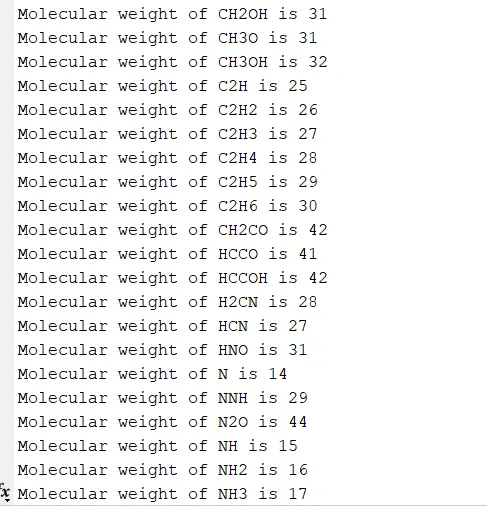
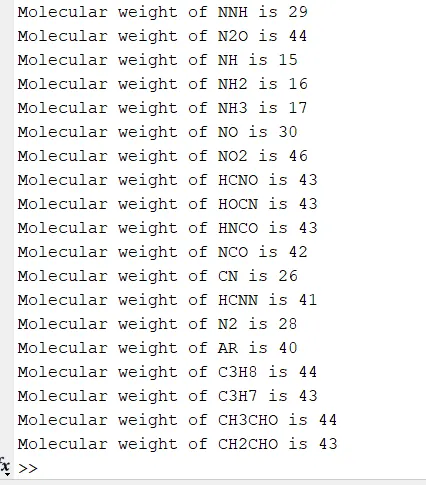
ATTACHMENTS:
EXPLANATION:
1. Comment
2.
3. Comment
4. 'fopen' opens the file for MATLAB to access. The filename is written in brackets as a string and arguement designates the action of read, write, open, close etc.
5. 'fgetl' reads the file line-wise discarding the new line character.
6. Comment
7. MATLAB designates all data in array form. To convert the data from text or string form to array form 'fscanf' is used. 'fscanf' coverts the data into array with respect to columns. The filename and the data type hve to be defined to get the required output which is assigned variable 'nasa_data'.
8. Using a string in the data, the data is divided for the convinience of assembly of data in a orderly fashion. The variable 'B' stores the divided data as columns.
9. Comment
10. variable 'R' is assigned to the universal gas constant.
11.
12. Comment
13. In the text, the headings of the species numbered as 1 are picked by their line position. The position of line 1 headings of the species is assigned variable 'species_line_1'.
14.
15. Comment
16. The for loop is started for the species. This loop runs 53 times which is same as the total number of species in the data. 'i' is the count index variable which take the same values as 'species_line_1'. Hence, it is started from 5 and is incremented by 4 for each instance of the for loop.
17. Comment
18. The data for line 1 of the species is extracted from variable 'B' and is assigned variable 'species_line1'.
19. By 'strsplit' command, strings in the line 1 are divied from the space characters in the data. The variable 'C' stores seperated strings as columns.
20. Comment
21. The species name is extracted from the string. For every species, the formula is always the first element of 'C'. It is assigned vairable 'species_name'.
22. The function 'Mol_wt' is called to calculate the molecular weight of the species based on its formula. It is assigned variable 'Molecular_weight'.
23. Comment
24. The numeric values of local temperatures are also stored as strings in 'C', thus to convert string to numeric value for MATLAB to perform operations 'str2double' command is used. The position of local temperature string changes for species is started from 1st column, thus reference is end of the array. The value is stored in 'local_low_temp'.
25. Similarly middle temperature value is stored in 'local_mid_temp'.
26. Similarly high temperature value is stored in 'local_high_temp'.
27. For the plots, different values of temprature are required. Thus 'T' variable ranges from local low temperature to local high temperature.
28.
29. Comment
30. For individual species, data is extracted of species line 2 which is just one column ahead in 'B' and is assigned variable 'species_line2'.
31. Comment
32. For individual species, data is extracted of species line 3 which is just two columns ahead in 'B' and is assigned variable 'species_line3'.
33. Comment
34. For individual species, data is extracted of species line 4 which is just three columns ahead in 'B' and is assigned variable 'species_line4'.
35.
36.
37. Comment
38. Looking at the data, it is quite difficult and impractical to distinguish/seperate the coefficients. Thus, the exponential term string is found and its position is stored in variable 'D'. A pattern is found that numeric strings for a single coefficient always end up three places from the exponential term E. And other coefficient string comes right after the end of previous coefficient string.
39. The first coefficient start from the first string in line 2 of the species and end three positions after the position of string E. All the strings from the first coefficient are stored in variable 'a1_1'.
40. String data is converted to numerical data and assigned variable 'a1'.
41. The strings of second coefficient are extracted from four positions after the first E string to three positions after the second E string.
42. String data is converted to numerical data and assigned variable 'a2'.
43. Similarly the strings of third coefficient are extracted.
44. String data is converted to numerical data and assigned variable 'a3'.
45. Similarly the strings of fourth coefficient are extracted.
46. String data is converted to numerical data and assigned variable 'a4'.
47. Similarly the strings of fifth coefficient are extracted.
48. String data is converted to numerical data and assigned variable 'a5'.
49.
50. Comment
51. E string positions of line 3 are given variable 'E'.
52. Similarly the strings of sixth coefficient are extracted.
53. String data is converted to numerical data and assigned variable 'a6'.
54. Similarly the strings of seventh coefficient are extracted.
55. String data is converted to numerical data and assigned variable 'a7'.
56. Similarly the strings of eighth coefficient are extracted.
57. String data is converted to numerical data and assigned variable 'a8'.
58. Similarly the strings of ninth coefficient are extracted.
59. String data is converted to numerical data and assigned variable 'a9'.
60. Similarly the strings of tenth coefficient are extracted.
61. String data is converted to numerical data and assigned variable 'a10'.
62.
63. Comment
64. E string positions of line 4 are given varibale 'F'.
65. Similarly the strings of eleventh coefficient are extracted.
66. String data is converted to numerical data and assigned variable 'a11'.
67. Similarly the strings of twelfth coefficient are extracted.
68. String data is converted to numerical data and assigned variable 'a12'.
69. Similarly the strings of thirteenth coefficient are extracted.
70. String data is converted to numerical data and assigned variable 'a13'.
71. Similarly the strings of fourteenth coefficient are extracted.
72. String data is converted to numerical data and assigned variable 'a14'.
73.
74.
75. Comment
76. 'Cp' is pre allocated as a row matrix of zeros.
77. 'H' is pre allocated as a row matrix of zeros.
78. 'S' is pre allocated as a row matrix of zeros.
79. for loop for calculating value of Cp, H, S for each value of 'T' from low temperature value to hgih temperature value is initiated with count index as 'j'.
80. Function for calculating Cp is called.
81. Function for calculating H is called.
82. Function for calculating S is called.
83. End of for loop for calculating Cp, H, S.
84.
85.
86. Comment
87. 'mkdir' creates a new directory/folder for saving of files of a MATLAB code.
88. Comment
89. 'cd' sets the current directory accessed by MATLAB to the directory in the brackets.
90.
91. Comment
92. 'figure(1)' sets the graphical commands to display on Figure1 window.
93. Plotting the graph with 'T' as x-coordinate and 'Cp' as y-coordinate.
94. Assigning title to x-axis.
95. Assigning title to y-axis.
96. Assigning title to graph.
97. Defining the range of x and y axes.
98. Figure(1) is saved as specified.
99.
100. Comment
101. 'figure(2)' sets the graphical commands to display on Figure1 window.
102. Plotting the graph with 'T' as x-coordinate and 'H' as y-coordinate.
103. Assigning title to x-axis.
104. Assigning title to y-axis.
105. Assigning title to graph.
106. Defining the range of x and y axes.
107. Figure(2) is saved as specified.
108.
109. Comment
110. 'figure(3)' sets the graphical commands to display on Figure1 window.
111. Plotting the graph with 'T' as x-coordinate and 'S' as y-coordinate.
112. Assigning title to x-axis.
113. Assigning title to y-axis.
114. Assigning title to graph.
115. Defining the range of x and y axes.
116. Figure(3) is saved as specified.
117.
118. Comment
119. 'cd ..' assigns the directory specified above the current directory. So the default directory is returned.
120. End of for loop for the species. The prpgram will be executed for every instance of 'i' hence for every species.
MOLECULAR WEIGHT CODE:
%Calculating molecular weight of species
function [M]= Mol_wt(species_name)

atomic_names=['H','C','O','N','Ar'];
atomic_masses=[1,12,16,14,40];

M=0;
for i=1:length(species_name)
    for j=1:length(atomic_names)
        if species_name(i)==atomic_names(j)
            M= M+atomic_masses(j);
            mark=j;
        end
    end
   n= str2double(species_name(i));
   if n>=1
       M= M+(n-1)*atomic_masses(mark);
   end
end
fprintf('Molecular weight of %s is %d',species_name,M)
fprintf('\n')
end
EXPLANATION:
1. Comment
2. Function 'Mol_wt' takes species name/formula as an input.
3.
4. An array of strings is generated and given variable 'atomic_names'.
5. An array of numbers to assign is generated and given variable 'atomic_masses'.
6.
7. 'M' is pre allocated.
8. for loop is inititated for each element of the 'string species_name'.
9. for loop is inititated for each element comparison of 'atomic_names'.
10. 'if' statement sets a consition to equal to 'species_name' to 'atomic_names'.
11. 'M' variable is used to store the atomic mass previous for current and previous instance of the for loop.
12. If the 'if' condition is satisfied to mark that value of 'j' a new variable take the value of 'j'.
13. end of 'if' statement.
14. End of for loop of which 'j' is count variable.
15. To check numeric value in the species string/formula 'str2double' is used.
16. 'if' condition is imposed for numeric value.
17. 'M' is the current value of 'M' added the numeric value of the string before it. Hence, the string which satisfies the species_name is equal to atomic_names condition. Thus 'mark' variable.
18. End of 'if' statement.
19. End f for loop.
20. A statement for output in the command window is printed using the 'fprintf' command.
21. Line break is introduced after the statement.
22. End of function.
HEAT CAPACITY CODE:
%Calculating heat capacity
function[Cp]= Calculate_Cp(a1,a2,a3,a4,a5,a8,a9,a10,a11,a12,mid_temp,T,R)

if T<= mid_temp
    Cp= (a8+a9.*(T)+a10.*(T.^2)+a11.*(T.^3)+a12.*(T^4)).*R;
else
    Cp= (a1+a2.*(T)+a3.*(T.^2)+a4.*(T.^3)+a5.*(T^4)).*R;
end
end
EXPLANATION:
1. Comment
2. The function 'Calculate_Cp' takes inputs as 10 coefficients out of the 14 coefficients in the data and middle temperature value, temperature range and value of universal gas constant.
3.
4. The condition is imposed of value of 'T' less than or equal to middle temperature value.
5. Formula for calculating 'Cp' using coefficients used to calculate Cp for low temperature range.
6. Else statement
7. Formula for calculating 'Cp' using coefficients used to calculate Cp for high temperature range.
8. End of 'if & else' statement
9. End of function
ENTHALPY CODE:
%Calculating enthalpy
function[H]= Calculate_H(a1,a2,a3,a4,a5,a6,a8,a9,a10,a11,a12,a13,mid_temp,T,R)

if T<= mid_temp
    H= (a8+(a9/2).*(T)+(a10/3).*(T.^2)+(a11/4).*(T.^3)+(a12/5).*(T.^4)+a13./T).*R.*T;
else
    H= (a1+(a2/2).*(T)+(a3/3).*(T.^2)+(a4/4).*(T.^3)+(a5/5).*(T.^4)+a6./T).*R.*T;
end
end
EXPLANATION:
1. Comment
2. The function 'Calculate_H' takes inputs as 12 coefficients out of the 14 coefficients in the data and middle temperature value, temperature range and value of universal gas constant.
3.
4. The condition is imposed of value of 'T' less than or equal to middle temperature value.
5. Formula for calculating 'H' using coefficients used to calculate H for low temperature range.
6. Else statement
7. Formula for calculating 'H' using coefficients used to calculate H for high temperature range.
8. End of 'if & else' statement
9. End of function
ENTROPY CODE:
%Calculating entropy
function[S]= Calculate_S(a1,a2,a3,a4,a5,a7,a8,a9,a10,a11,a12,a14,mid_temp,T,R)

if T<= mid_temp
    S= (a8.*(log(T))+a9.*(T)+(a10/2).*(T.^2)+(a11/3).*(T.^3)+(a12/4).*(T.^4)+a14).*R;
else
    S= (a1.*(log(T))+a2.*(T)+(a3/2).*(T.^2)+(a4/3).*(T.^3)+(a5/4).*(T.^4)+a7).*R;
end
end
EXPLANATION:
1. Comment
2. The function 'Calculate_S' takes inputs as 12 coefficients out of the 14 coefficients in the data and middle temperature value, temperature range and value of universal gas constant.
3.
4. The condition is imposed of value of 'T' less than or equal to middle temperature value.
5. Formula for calculating 'S' using coefficients used to calculate S for low temperature range.
6. Else statement
7. Formula for calculating 'S' using coefficients used to calculate S for high temperature range.
8. End of 'if & else' statement
9. End of function
REFERENCES:
1. https://skill-lync.com/premium/coursevideos/64142/en/34
2. https://skill-lync.com/premium/coursevideos/64142/en/1362
3. https://skill-lync.com/premium/coursevideos/64142/en/1281