Project 1 - Parsing NASA thermodynamic data
clear all
close all
clc

% Opening THERMO.dat file.
% Skipping the header using fgetl function.
fid = fopen('THERMO.dat','r');
fgetl(fid);
fgetl(fid);
fgetl(fid);
fgetl(fid);
fgetl(fid);

% One loop process data for one species:
for i = 1:53
% Reading species name
species = fscanf(fid,'%s',1);

% Reading temperature values & converting cellarray to char array to num.
line1= fgetl(fid);
A = strsplit(line1,' ');
Tlow = A(end-3);
Tmid = A(end-1);
Thigh = A(end-2);
tlow = cell2mat(Tlow);
tmid = cell2mat(Tmid);
thigh = cell2mat(Thigh);
temp_low = str2num(tlow);
temp_mid = str2num(tmid);
temp_high = str2num(thigh);

% Reading coefficients values line by line
line2 = fgetl(fid);
E = strfind(line2,'E');
A1 = line2(1:E(1)+3);
a1 = str2num(A1);
A2 = line2(E(1)+4:E(2)+3);
a2 = str2num(A2);
A3 = line2(E(2)+4:E(3)+3);
a3 = str2num(A3);
A4 = line2(E(3)+4:E(4)+3);
a4 = str2num(A4);
A5 = line2(E(4)+4:E(5)+3);
a5 = str2num(A5);


line3 = fgetl(fid);
E = strfind(line3,'E');
A6 = line3(1:E(1)+3);
a6 = str2num(A6);
A7 = line3(E(1)+4:E(2)+3);
a7 = str2num(A7);
A8 = line3(E(2)+4:E(3)+3);
a8 = str2num(A8);
A9 = line3(E(3)+4:E(4)+3);
a9 = str2num(A9);
A10 = line3(E(4)+4:E(5)+3);
a10= str2num(A10);

line4 = fgetl(fid);
E = strfind(line4,'E');
A11 = line4(1:E(1)+3);
a11 = str2num(A11);
A12 = line4(E(1)+4:E(2)+3);
a12 = str2num(A12);
A13 = line4(E(2)+4:E(3)+3);
a13= str2num(A13);
A14= line4(E(3)+4:E(4)+3);
a14= str2num(A14);

% Using user defined function, 'calculate' to get Cp,h & s values for high & low temperatures.
trange_low = linspace(temp_low,temp_mid);
trange_high = linspace(temp_mid,temp_high);
[cp_lo cp_hi h_lo h_hi s_lo s_hi] = calculate(a1,a2,a3,a4,a5,a6,a7,a8,a9,a10,a11,a12,a13,a14,trange_low,trange_high);

% Making new folder in 'Species' directory & giving species name to the folders inside.
cd 'C:\Users\Bhargav\Desktop\temp_mat_projects\Species'
mkdir (species)
cd (species)

% Plotting graphs & saving them to the folder of each species
figure('Name','Specific heat vs Temperature','visible','off')
plot(trange_low,cp_lo,trange_high,cp_hi,'linewidth',2)
xlabel('Temperature')
ylabel('Specific Heat')
grid on
saveas(gcf,'Specific heat vs Temperature.png')

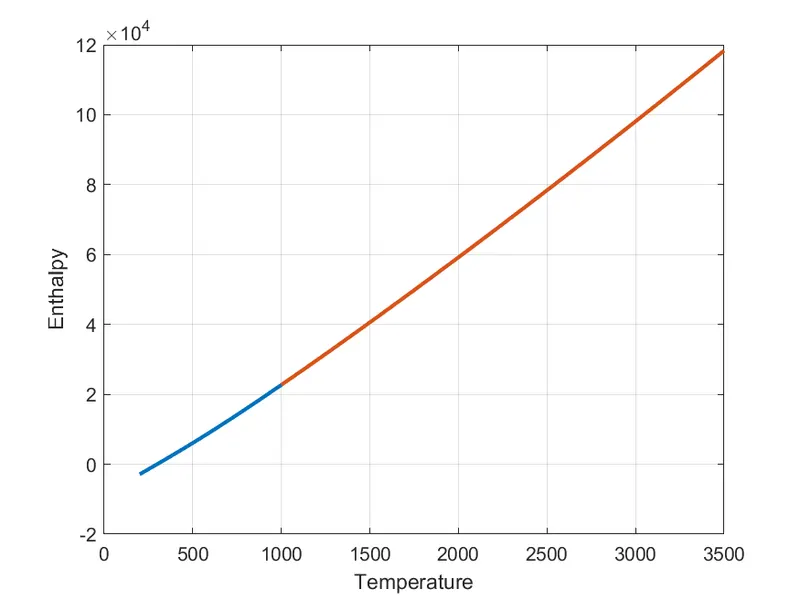
figure('Name','Enthalpy vs Temperature','visible','off')
plot(trange_low,h_lo,trange_high,h_hi,'linewidth',2)
xlabel('Temperature')
ylabel('Enthalpy')
grid on
saveas(gcf,'Enthalpy vs Temperature.png')

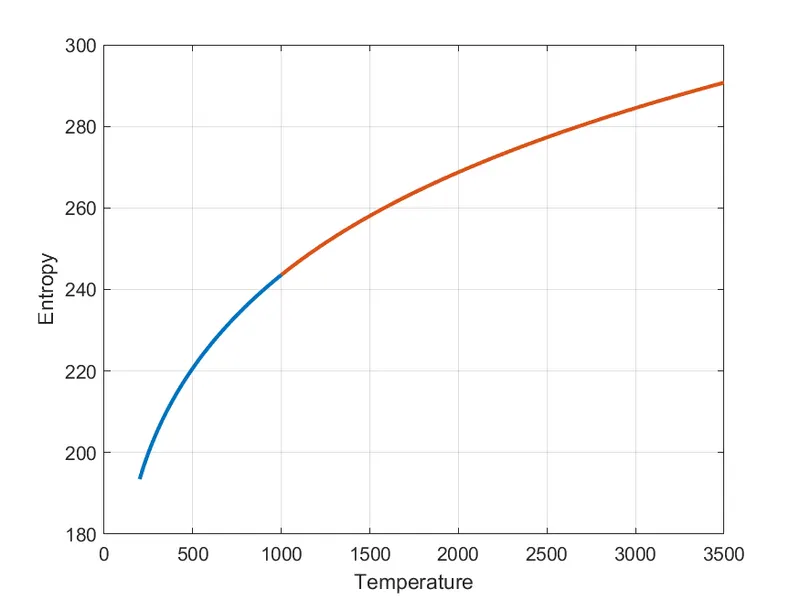
figure('Name','Entropy vs Temperature','visible','off')
plot(trange_low,s_lo,trange_high,s_hi,'linewidth',2)
xlabel('Temperature')
ylabel('Entropy')
grid on
saveas(gcf,'Entropy vs Temperature.png')

% Returning to original directory
cd 'C:\Users\Bhargav\Desktop\temp_mat_projects'

% Calculation of molecular weight
elements = ['C', 'H', 'A', 'O', 'N'];
atm_wt = [12.0107 1.0079 39.948 15.999 14.0067];
mol_mass = 0;
for k = 1:length(species)
    for l = 1:length(atm_wt)
        if strcmpi(species(k),elements(l))
            mol_mass = mol_mass + atm_wt(l);
            pos = l;
        end
    end

n = str2num(species(k));
if n>1
    mol_mass = mol_mass  + atm_wt(pos)*(n-1);
end
end

% Displaying molecular weight in command window
W = sprintf('Molecular Weight of %s: %f',species,mol_mass);
disp(W)

end
Function to calculate Cp,h & s:
function [Cp_lo Cp_hi H_lo H_hi S_lo S_hi] = calculate(a1,a2,a3,a4,a5,a6,a7,a8,a9,a10,a11,a12,a13,a14,trange_low,trange_high)

R = 8.314;

Cp_lo = ((a8) + (a9.*trange_low) + (a10.*trange_low.^2) + (a11.*trange_low.^3) + (a12.*trange_low.^4)).*R;
H_lo = ((a8) + (a9.*trange_low)./2 + ((a10.*trange_low.^2)./3) + ((a11.*trange_low.^3)./4) + ((a12.*trange_low.^4)./5) + a13./trange_low).*R.*trange_low;
S_lo = ((a8.*log(trange_low)) + (a9.*trange_low) + (a10.*trange_low.^2)./2 + ((a11.*trange_low.^3)./3) + ((a12.*trange_low.^4)./4) + a14).*R;

Cp_hi = ((a1) + (a2.*trange_high) + (a3.*trange_high.^2) + (a4.*trange_high.^3) + (a5.*trange_high.^4)).*R;
H_hi = ((a1) + (a2.*trange_high)./2 + ((a3.*trange_high.^2)./3) + ((a4.*trange_high.^3)./4) + ((a5.*trange_high.^4)./5) + a6./trange_high).*R.*trange_high;
S_hi = ((a1.*log(trange_high)) + (a2.*trange_high) + (a3.*trange_high.^2)./2 + ((a4.*trange_high.^3)./3) + ((a5.*trange_high.^4)./4) + a7).*R;


end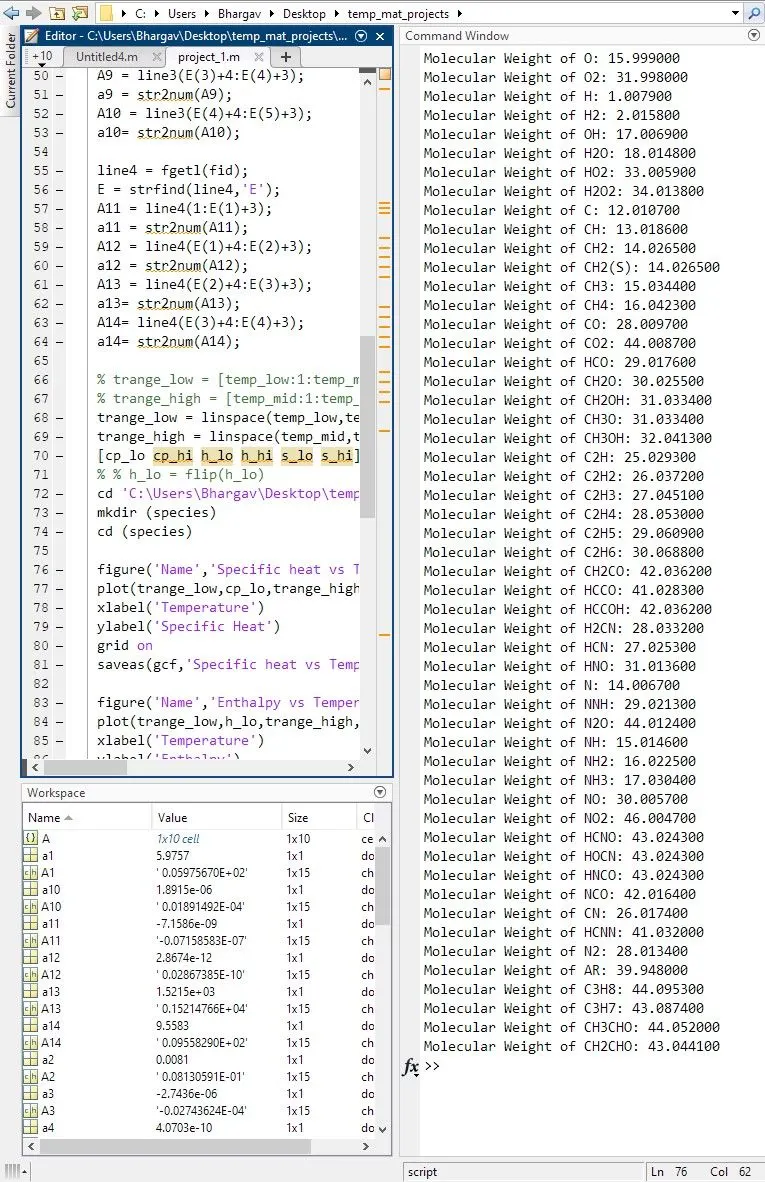

Gdrive link: https://drive.google.com/drive/folders/168ulg8MAXHEoVWq7FQjAv7N3-YuCjbqm?usp=sharing
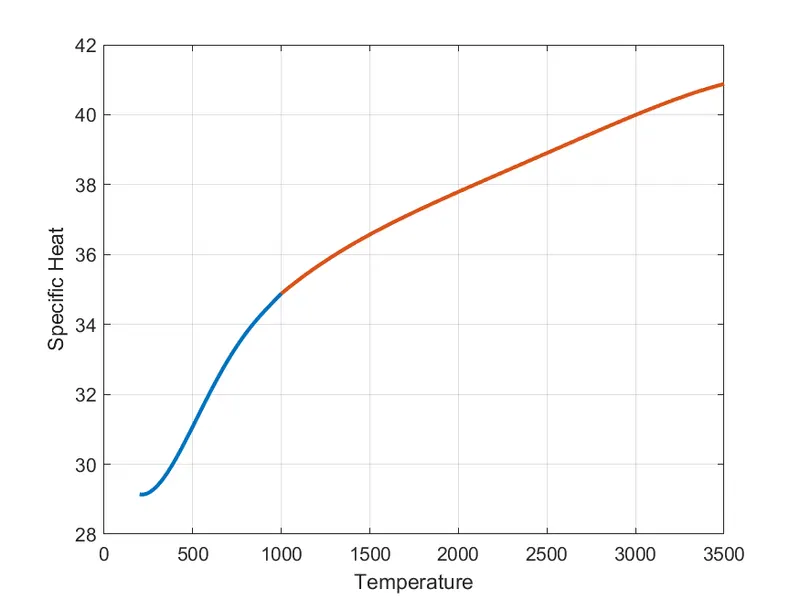
Plot of O2:
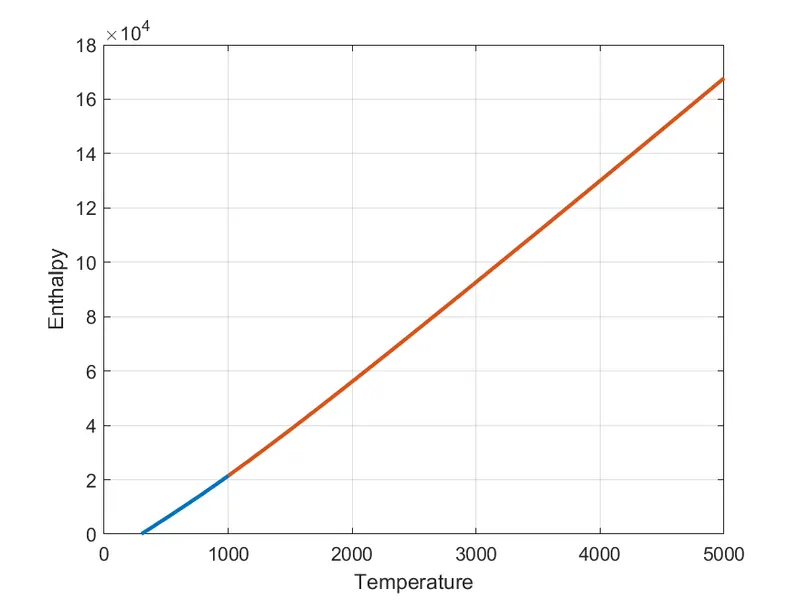
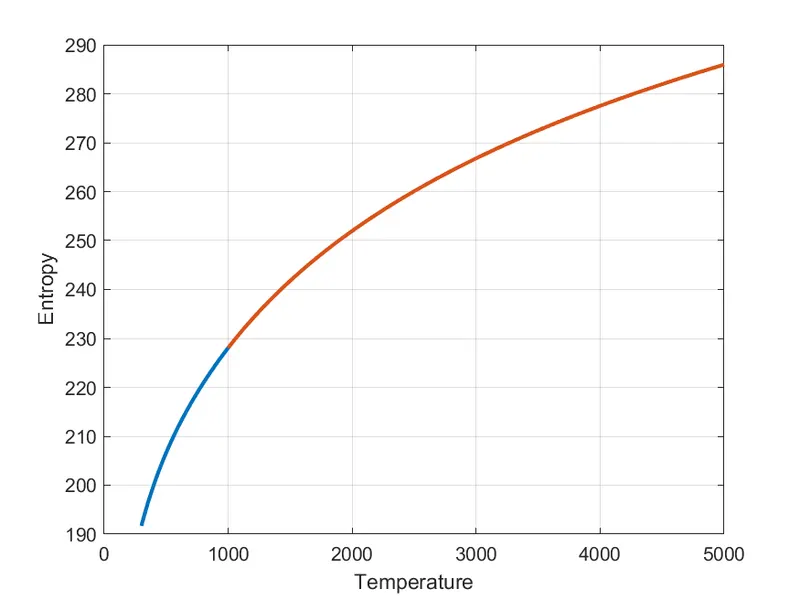
Plot of N2:
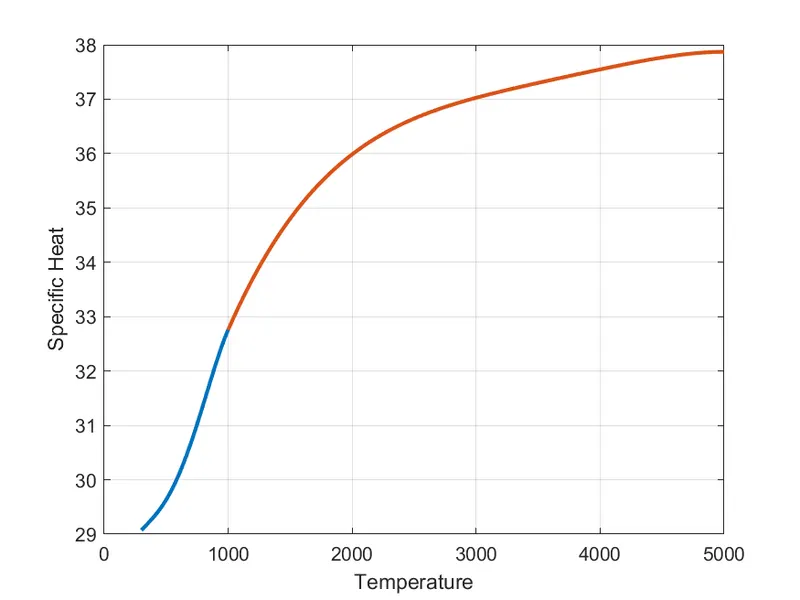
Plot of CO2:
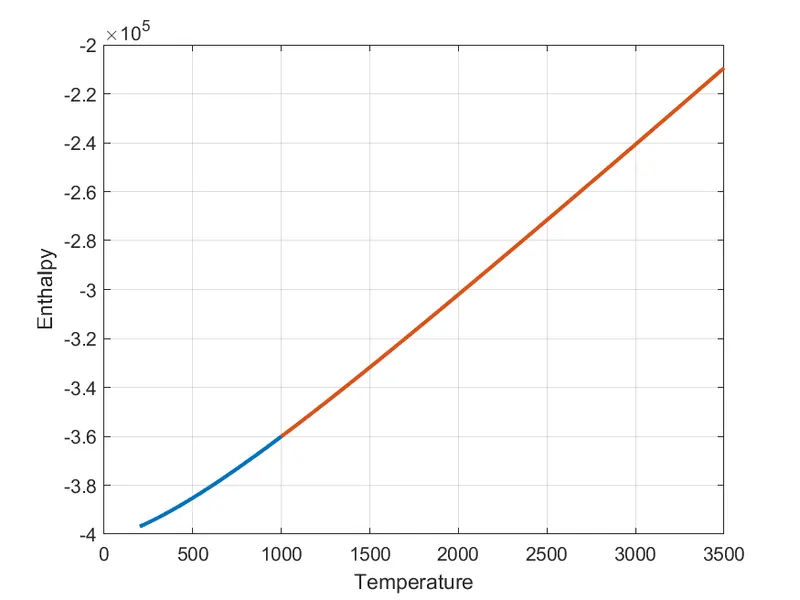
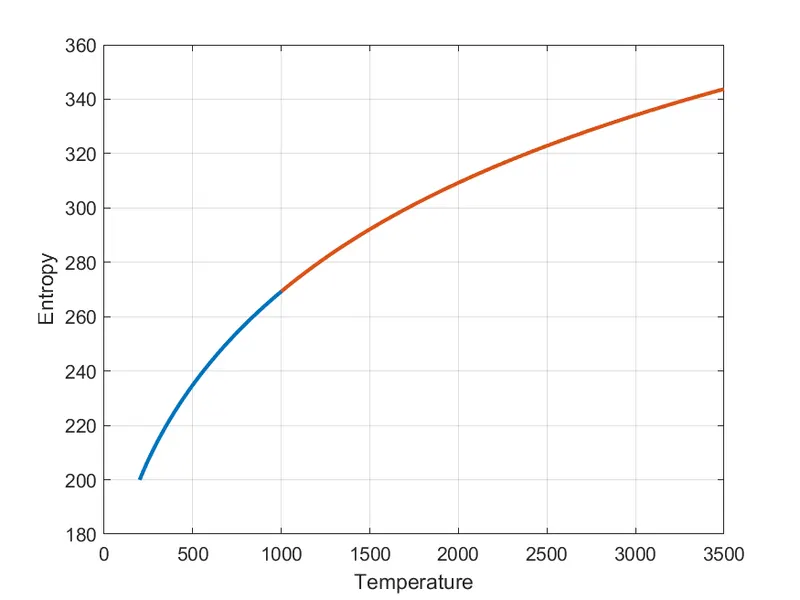
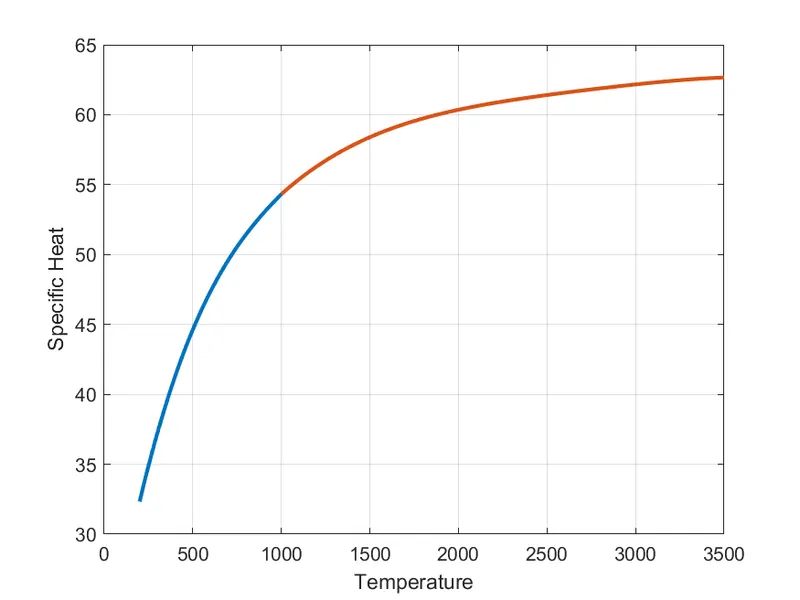
Stepwise explanation:
- Use fopen to open THERMO,dat file.
Use fgetl to skip header lines. - Create a for loop with iterations = no. of species.
- Use fscanf to read species name and save it to a character array.
- For reading temperature values, use strsplit to split the line using 'space' as delimiter.
Temperature values are read & stored to cell array. Cell arrays are converted to numeric arrays.
Assign names to temperature arrays distinguishing them betweem low,mid & high. - Read coefficient values & save them to separate numeric arrays naming a1,a2...a14.
- Create temperature ranges, low to mid & mid to high, to use them for plotting.
- Use user defined 'calculate' function to output values of cp, h & s for low & high temperature ranges.
- Create 'Species' folder in main directory.
Create new folder named after current species, that is being used in the loop.
Use cd to change directory to current species folder . - Plot 3 graphs for Cp, h & s. Use same axes to plot values of both low & high temp ranges.
Save them as .png format. - Return to original directory.
- Calculate molecular weight:
- Create element matrix containing element names (same as in data file) as a char array.
- Create atomic weight matrix of respective elements as num array.
- Use nested for loop to each letter of the species.
Use if statement to compare letters of species & element & add mol wt if strcmp statement is true.
Convert char array containing the letter/num of species to num array & if the number is greater than on, multiply it with respective atm weight and it to molecular mass.
- Display molecular mass in a sentence form in command window.
Errors faced:
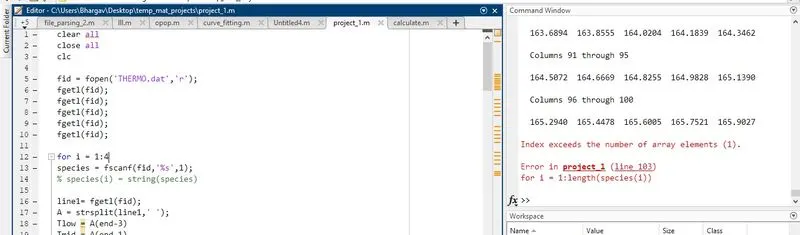
- Error faced in the plot as 'calculate' function had a typo.
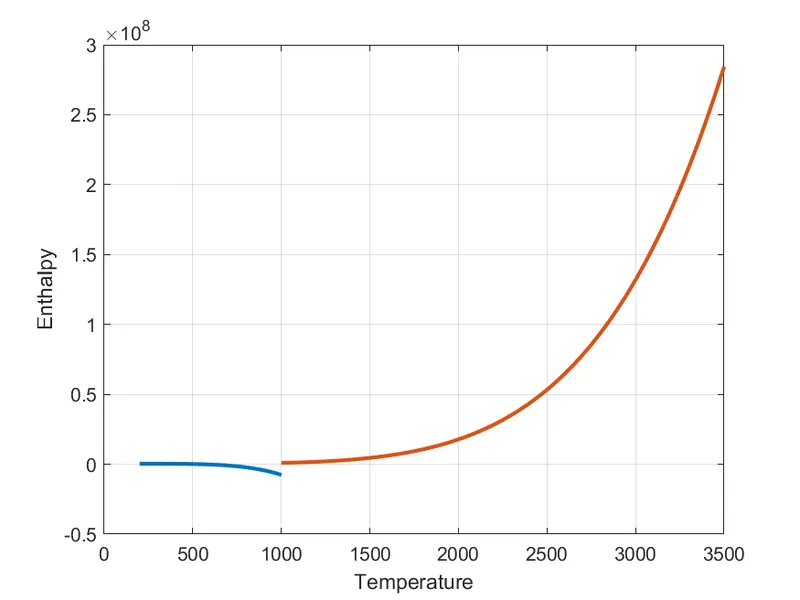
- Error faced in molecular weight calculation because same indexing variable was used for both for loops.