Project 1 - Parsing NASA thermodynamic data
AIM :
- To write a code in Matlab to parsing the NASA thermodynamics data file and to calculate the thermodynamic properties of various gas species .
OBJECTIVES :
- To write a program that extracts the 14 co -efficienets and to calculate the enthaply, entropy and specific heats for all the species in the data file .
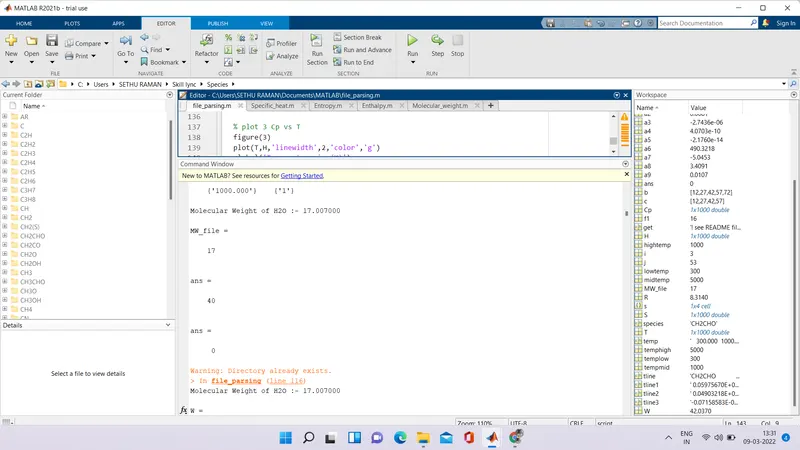
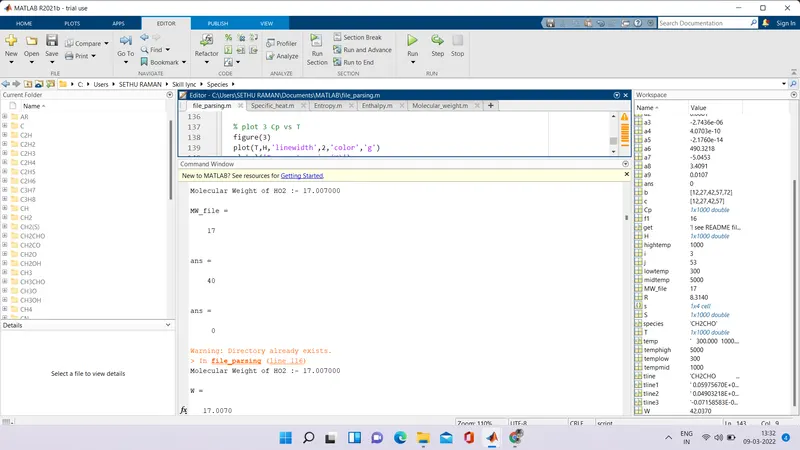
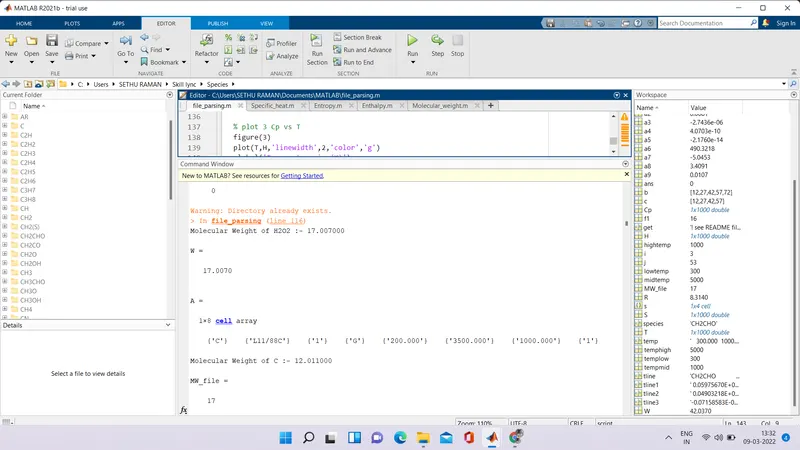
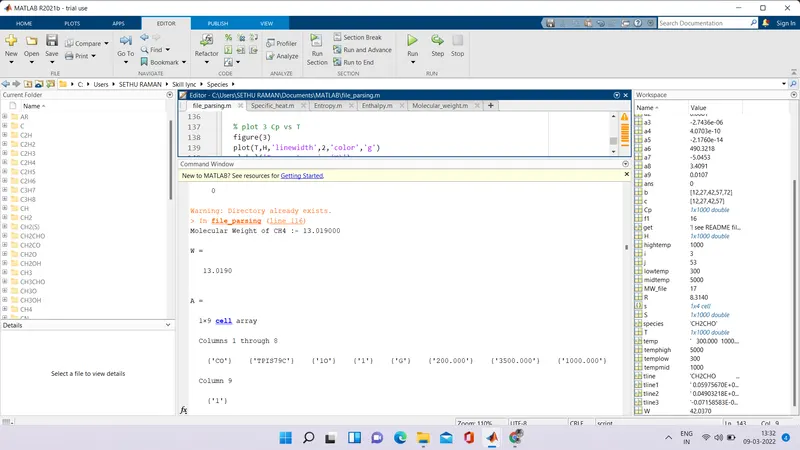
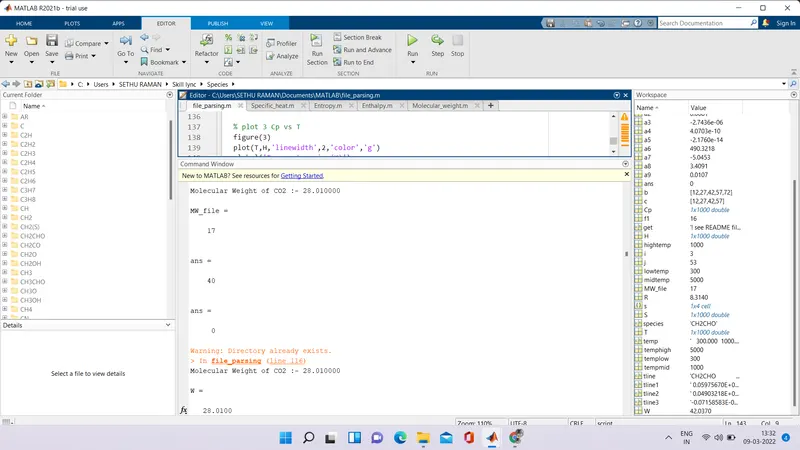
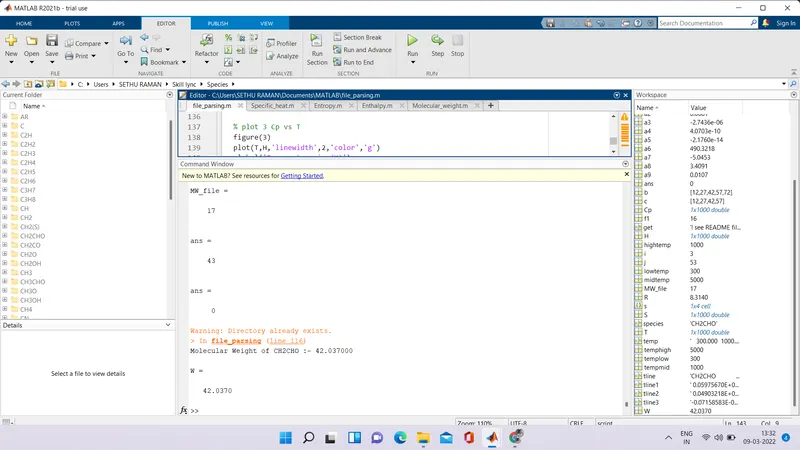
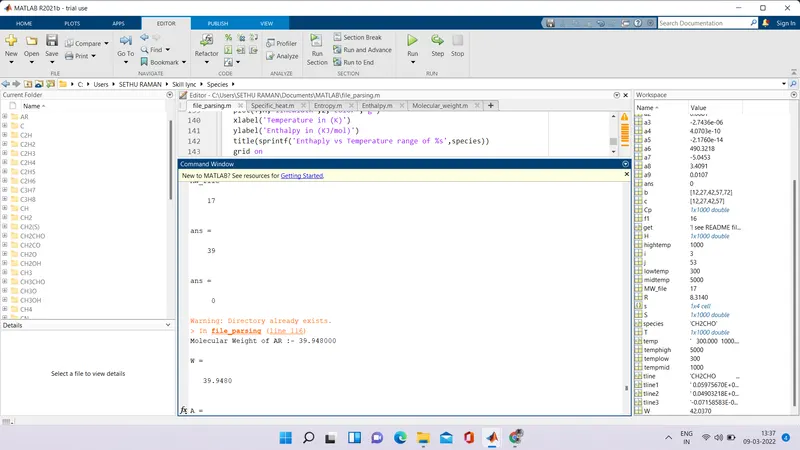
- To calculate the molecular weight of each species and display in the command window .
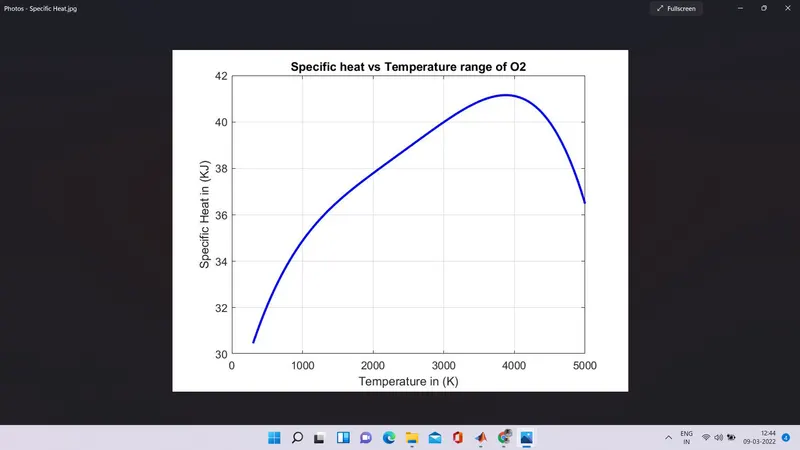
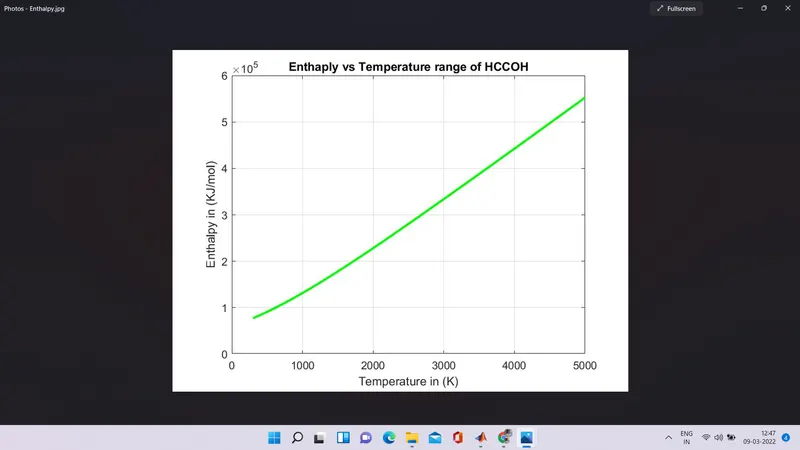
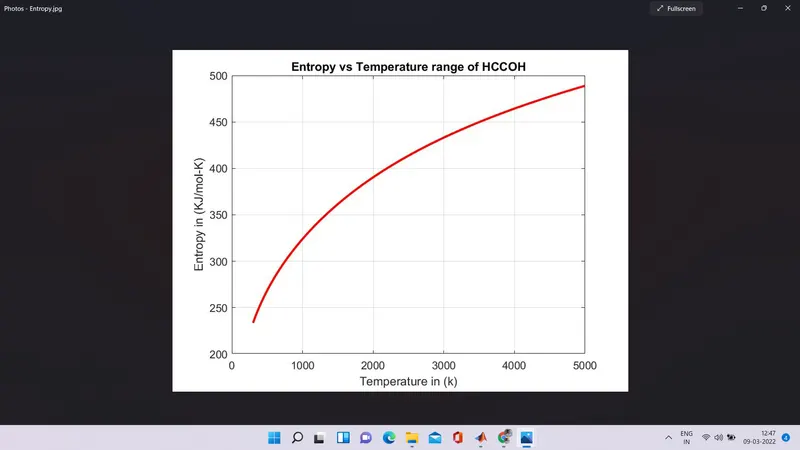
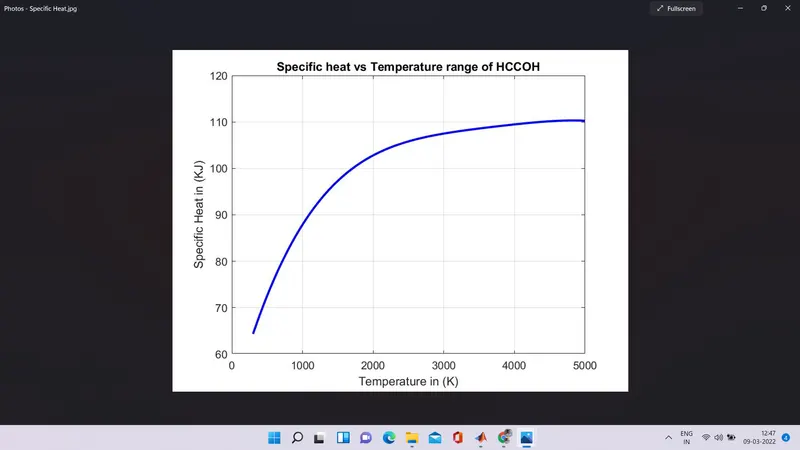
- To plot the Cp,Enthaply and Entropy for the local temperature range (low temperature : high temperature ) specific for the each species .
- Save the plots as images with appropriate names and dump them in separate folders for each species with suitable name. All these should be generated automatically.
- The main program that you will submit will just take the "THERMO.dat" file as an input and generate Cp, H and S plots
- To plot for o2, N2, and Co2 species .
FILE PARSING : DEFINITION
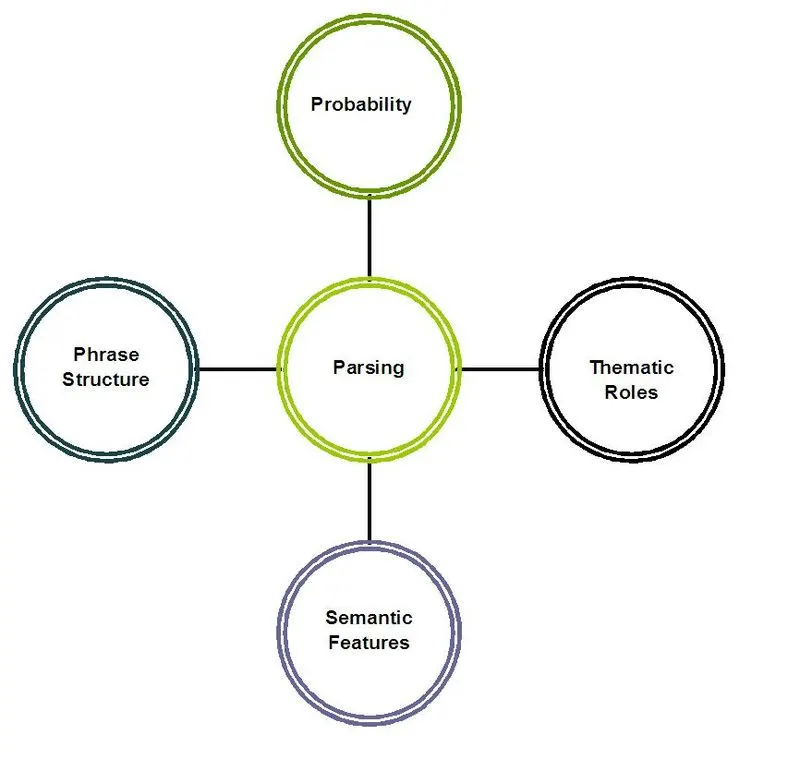
- Parsing , syntax analysis or syntactic analysis is the process of analyzing a string of symbols , either in natural language, computer languages or data structures , conforming to the rules of a formal grammar .
- The term parsing comrs from the latin pars (orationis), meaning part (of speech ) .
- within the computional linguistics the term is used to refer the formal analysis by a computer of a sentence or the string of words into the constituents , resulting in a prase tree showing their syntactic relation to each other , which may also contain semantic and other information ( p - values ).
- Some parsing alogrithms may generate a parse forest or list of pars trees for a syntactically ambiguous input .
DIAGRAM :
NASA Thermodynamic File :
- NASA thermodynamic file which is THERMO.dat file in which temperature range and species are given in these data and each species contains 14 co - efficients and temperature ranges .we have to parse these 14 co - effeicients to find the Specific heat , Entropy , Enthalpy using equation as follows ,
where,
- R = Universal Gas Constant .
- T = Temperature .
- Cp = Specific heat (KJ) .
- S = Entropy (KJ/mol-K) .
- H = Enthaply (kJ/mol) .
- a(i) = Cofficients where i = 1 to 14 .
SPECIFIC HEAT :
- Specific heat can be define as 'the quantity of heat required to raise the temperature of one gram of a substance by one celsius degree.
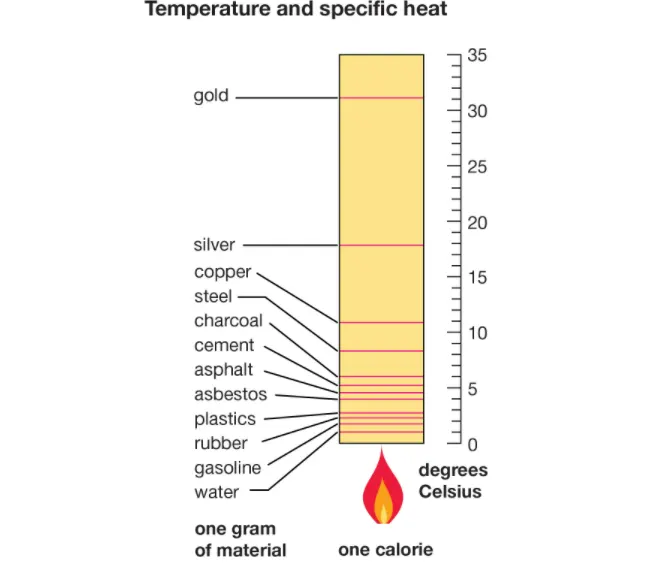
- The unit of specific heat is calories or joules per gram per celsius degree .
EXPRESSION OF SPECIFIC HEAT (Cp) :
`Cp = R*(a1 +(a2*T) +(a3*(T).^2)+(a4*(T).^3+(a5*(T).^4)
ENTHAPLY :
- Enthaply is defined as a property of a thermodynamic system , is the sum of system's internal energy and the product of its pressure and volume .
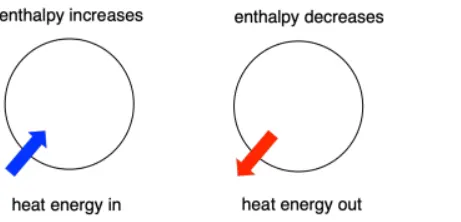
- The unit of enthalpy is joule per kilogram .
EXPRESSION OF ENTHALPY :
`H = R*T.*(a1+((a2*T)/2)+((a3*(T).^2)/3)+((a4*(T).^3)/4)+((a5*(T).^4)/5)+(a6./T)).`
ENTROPY :
- Entropy is defined as , the measure of a system's thermal energy per unit temperature that is unavaible for doing useful work .
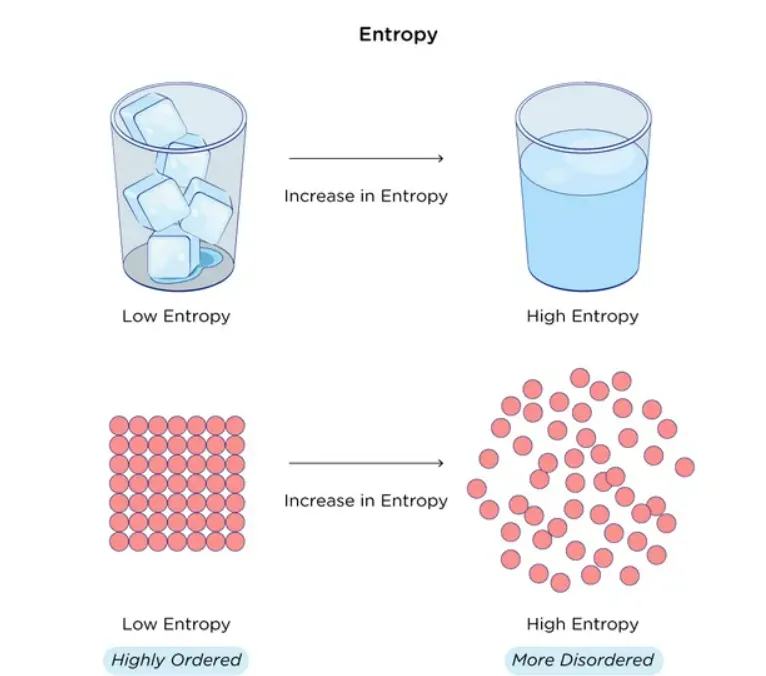
- The unit of entropy is joule per kelvin .
EXPRESSION OF ENTROPY (S) :
`S = R*(a1.*log(T) +(a2*T) +((a3*(T).^2)/2)+((a4*(T).^3)/3)+((a5*(T).^4)/4)+a7)`
MAIN PROGRAM :
% A program to calculate NASA parasing

clear  all
close all
clc

% Inputs
% Universal gas constant
R = 8.314 ;

% Reading the file data
% Open file and reading THERMO.dat file
f1 = fopen('THERMO.dat','r')
get = fgetl(f1);

% Now reading the temperature from this file
temp = fgetl(f1);

% splitting
s = strsplit(temp);

% Coverting strings cells into numbers
templow  = str2num(s{2});
tempmid  = str2num(s{3});
temphigh = str2num(s{4});

% Temperature range
T = linspace(templow,temphigh,1000);

% skipping comment lines
for i = 1:3
    get = fgetl(f1);
end

% Reading the species
 for  j = 1:53
    tline = fgetl(f1);

% Splitting into cell array
 A = strsplit(tline,' ')

% To read the name of the species
 species = (A{1});

% Converting strings to number
lowtemp  = str2num(A{end-3});
midtemp  = str2num(A{end-2});
hightemp = str2num(A{end-1});

% Getting next lines
tline1 = fgetl(f1);

% Finding the string E
a = findstr(tline1,'E');

% Finding Higher coefficents and lower coefficients
% Finding first 7 higher coefficients

a1 = tline1(1:a(1)+3);
a1 =str2num(a1);
a2 = tline1(a(1)+4:a(2)+3);
a2 = str2num(a2);
a3 = tline1(a(2)+4:a(3)+3);
a3 = str2num(a3);
a4 = tline1(a(3)+4:a(4)+3);
a4 = str2num(a4);
a5 = tline1(a(4)+4:a(5)+3);
a5 = str2num(a5);

tline2 = fgetl(f1);
b  = findstr(tline2,'E');
a6 = tline2(1:b(1)+3);
a6 = str2num(a6);
a7 = tline2(b(1)+4:b(2)+3);
a7 = str2num(a7);

% Next finding the second 7 coefficents which is lower order
a8  = tline2(b(2)+4:b(3)+3);
a8  = str2num(a8);
a9  = tline2(b(3)+4:b(4)+3);
a9  = str2num(a9);
a10 = tline2(b(4)+4:b(5)+3);
a10 = str2num(a10);

tline3 =fgetl(f1);
c   = findstr(tline3,'E');
a11 = tline3(1:c(1)+3);
a11 = str2num(a11);
a12 = tline3(c(1)+4:c(2)+3);
a12 = str2num(a12);
a13 = tline3(c(2)+4:c(3)+3);
a13 = str2num(a13);
a14 = tline3(c(3)+4:c(4)+3);
a14 = str2num(a14);

% Calculate the Specific heat
Cp = Specific_heat(a1,a2,a3,a4,a5,a8,a9,a10,a11,a12,T,R,tempmid);

% Calculate the Entropy
S = Entropy(a1,a2,a3,a4,a5,a7,a8,a9,a10,a11,a12,a14,T,R,tempmid);

% calculate the Enthalpy
H = Enthalpy(a1,a2,a3,a4,a5,a6,a8,a9,a10,a11,a12,a13,T,R,tempmid);

% Calculate the Molecular weight of the species
W = Molecular_weight(species);

% Writing molecular weight file
MW_file = fopen('Molecular Weight.txt','w')
fprintf(MW_file,'Molecular weight of %s is %d ',species,W)
fclose(MW_file)

% Plotting Cp, H and S with temperature
% Saving in a folder
cd('C:/Users/SETHU RAMAN/Skill lync/Species/')
mkdir(species);
cd(species);

% Plot 1 Cp vs T
figure(1)
plot(T,Cp,'Linewidth',2,'color','b')
xlabel('Temperature in (K)')
ylabel('Specific Heat in (KJ)')
title(sprintf('Specific heat vs Temperature range of %s',species))
grid on
saveas(figure(1),'Specific Heat.jpg')

% plot 2 S vs T
figure(2)
plot(T,S,'linewidth',2,'color','r')
xlabel('Temperature in (k)')
ylabel('Entropy in (KJ/mol-K)')
title(sprintf('Entropy vs Temperature range of %s',species))
grid on
saveas(figure(2),'Entropy.jpg')

% plot 3 Cp vs T
figure(3)
plot(T,H,'linewidth',2,'color','g')
xlabel('Temperature in (K)')
ylabel('Enthalpy in (KJ/mol)')
title(sprintf('Enthaply vs Temperature range of %s',species))
grid on
saveas(figure(3),'Enthalpy.jpg')
cd('C:/Users/SETHU RAMAN/Skill lync/Species')

% Molecular weight
W = Molecular_weight(species)

end
CODE EXPLANATION :
- The program starts with clear all, close all and clc .
- clear all command is used to clear all the varaibles from the workspace .
- close all command is used to close all the plots and figures .
- clc command is used to clear all the txt from the comman window .
- Then we need to input the universal gas constant R = 8.314 parameter and then we need to open the file of THERMO. dat after that reading this file using the fopen command .
- Then fgetl command is used to read the THERMO file and temperature is been readed ,after that need to split the temperature file .
- so, strsplit command is used to convert it into the cell array and then convert this string to the number by using the str2num command . so now we will able to find the high mid low temperatures respectively .
- Now the linspace command is used to assign the temperature range .
- Then the loop statement is used to skip the comment data from the THERMO file . and again we running the loop statement to find the 53 elements from the file respectively .
- findstr command is used to find the 'E' from the species .
- Molecular Weight function is used to find the differenet species of molecular weight .
- Then we will plot the Specific heat , Entropy and Enthalpy with the temperatures of different species .
- Then saveas command is used to save the plots of differnet species .
FUNCTION OF SPECIFIC HEAT :
function Cp = Specific_heat(a1,a2,a3,a4,a5,a8,a9,a10,a11,a12,T,R,tempmid)

% Calculating specific heat
% Calculating the specific heat for higher and lower Temperatures

if (T <=tempmid)
    Cp = R*(a8 + (a9*T) + (a10*(T).^2) + (a11*(T).^3) + (a12*(T).^4));
else
    Cp = R*(a1 + (a2*T) + (a3*(T).^2) + (a4*(T).^3) + (a5*(T).^4));
end
end
FUNCTION OF ENTROPY :
function S = Entropy(a1,a2,a3,a4,a5,a7,a8,a9,a10,a11,a12,a14,T,R,tempmid)

% calculate the entropy
% calculate the entropy for higher and lower temperatures

if (T <= tempmid)
    S = R*(a8.*log(T) + (a9*T) + ((a10*(T).^2)/2) + ((a11*(T).^3)/3) + ((a12*(T).^4)/4) +a14);
else
    S = R*(a1.*log(T) + (a2*T) + ((a3*(T).^2)/2) + ((a4*(T).^3)/3) + ((a5*(T).^4)/4) + a7);
end
end
FUNCTION OF ENTHALPY :
function H = Enthalpy(a1,a2,a3,a4,a5,a6,a8,a9,a10,a11,a12,a13,T,R,tempmid)

% Calculate the enthalpy
% Calculating the enthaply for higher and lowerR * temperatures

if (T <= tempmid)
    H = R*T.*(a8 + ((a9*T)/2) + ((a10*(T).^2)/3) + ((a11*(T).^3)/4) + ((a12*(T).^4)/5) + ((a13./T)));
else
    H = R*T.*(a1 + ((a2*T)/2) + ((a3*(T).^2)/3) + ((a4*(T).^3)/4) + ((a5*(T).^4)/5) + ((a6./T)));
end
end
FUNCTION OF MOLECULAR WEIGHT :
function W = Molecular_weight(species)

% Defining the Atomic name of the Species
atomic_name = ['H','C','O','N','A'];

% Defining the Atomic masses of the Main Species
atomic_weight = [1.008 12.011 15.999 14.007 39.948 ];

% Molecular weight starting range
W = 0;

for i = 1:length(species)
    for j = 1:length(atomic_name)
        if strcmp(species(i), atomic_name(j))
            W = W + atomic_weight(j);
            position = j;
        end
    end
    n = str2num(species);

    if n>1
        W = W + atomic_weight(position)*(n-1);
    end
end

fprintf('Molecular Weight of %s :- ',species);
fprintf('%f',W);
disp(' ')
end
EXPLANATION :
- Molecular weight function is beed initiated to assign the species , then define the main of all 53 elements in an array of atomic_name which is 'H' 'C' 'O' 'N' 'A' .
- The atomic _weight array has been created which is 1.008 12.011 15.999 14.007 39.948 .
- Then molecular weight range is assinged to zero .
- strcmp command is used to compare the species and the atomic_name strings to calculate the molecular masses.
- str2num command is used to convert strings into number .
- fprintf command is used to print the molecular weight .
- disp command is used to display it .
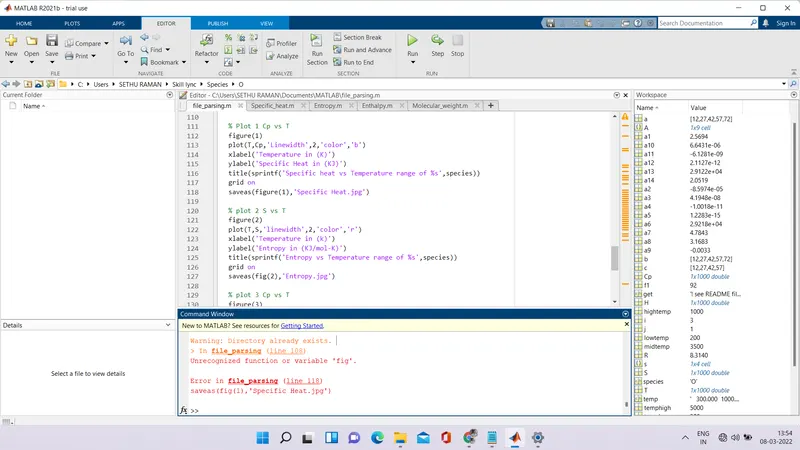
ERRORS :
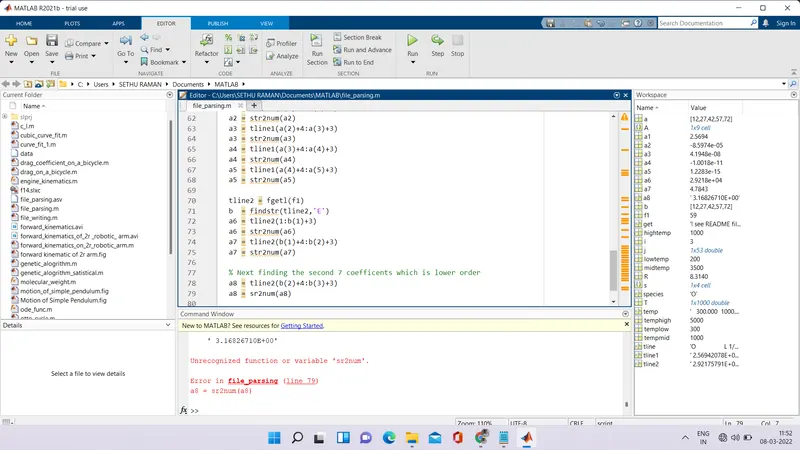
- Repeatedly the watching the videos , and couple of the lectures guided me whenever i had doubts .
RESULTS :
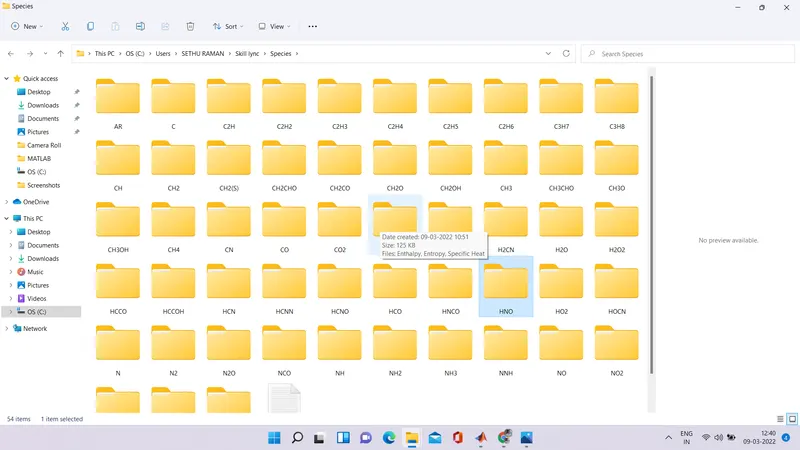
- Screenshots of different species .
- .
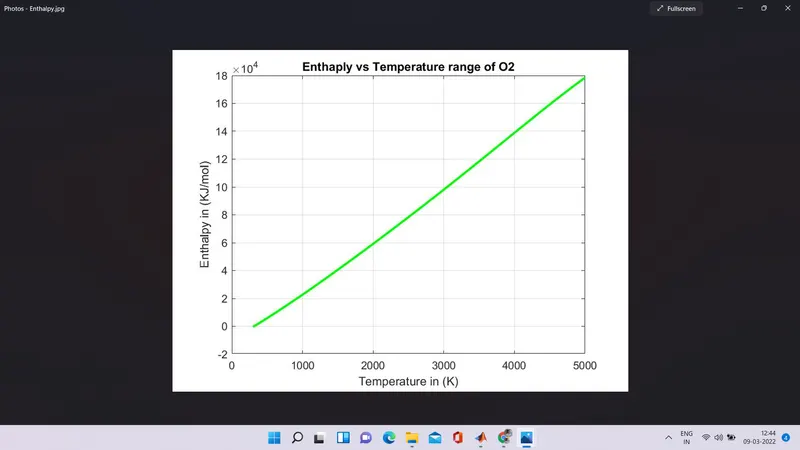
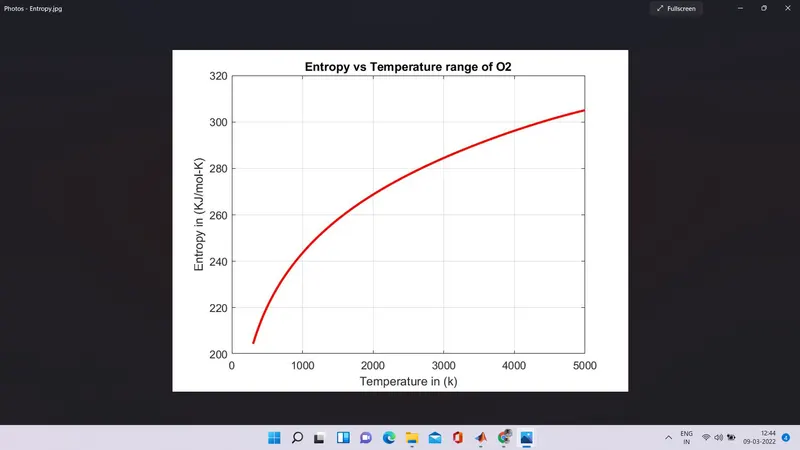
- Plots of O2 :
- Plots of HCCOH :
MOLECULAR WEIGHT RESULTS :