Project 1 - Parsing NASA thermodynamic data
AIM: To write code in MATLAB to parse NASA thermodynamic data file and then calculate the thermodynamic properties of various species.
OBJECTIVE:
- Write a function that extracts the 14 coefficients and calculates the enthalpy, entropy and specific heats for all the species in the ‘THERMO.dat’ file from the given formulae.

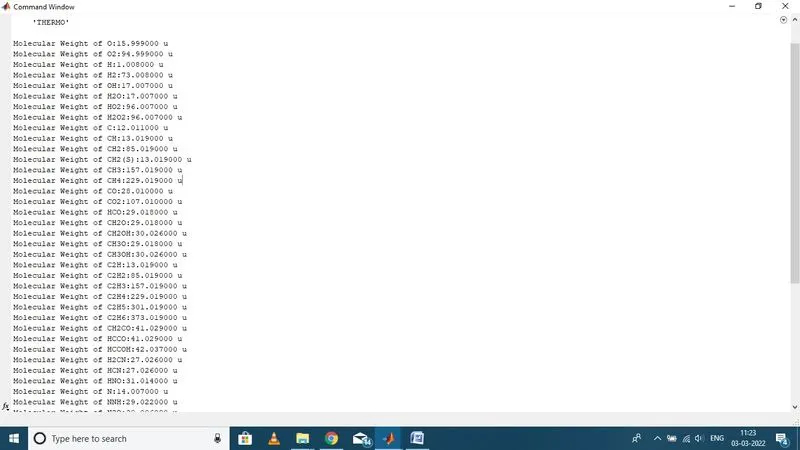
- Calculate the molecular weight of each species and display it in command window.
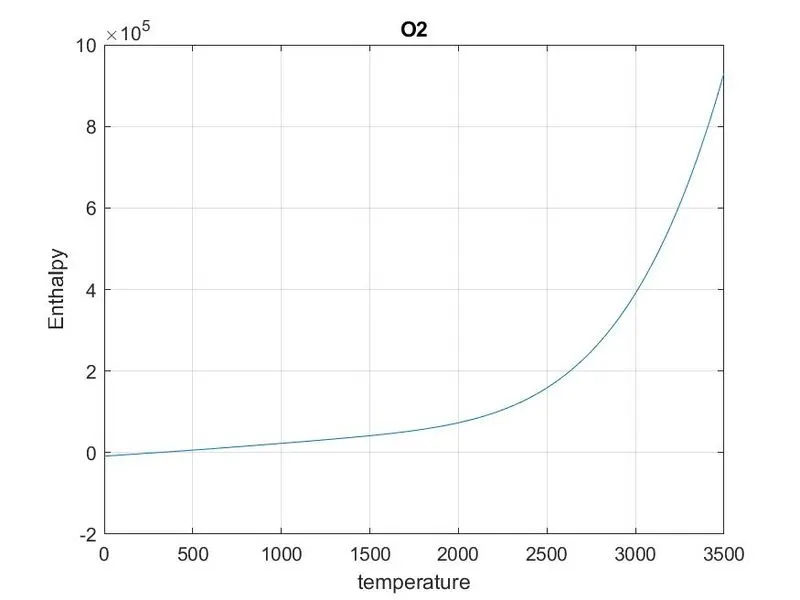
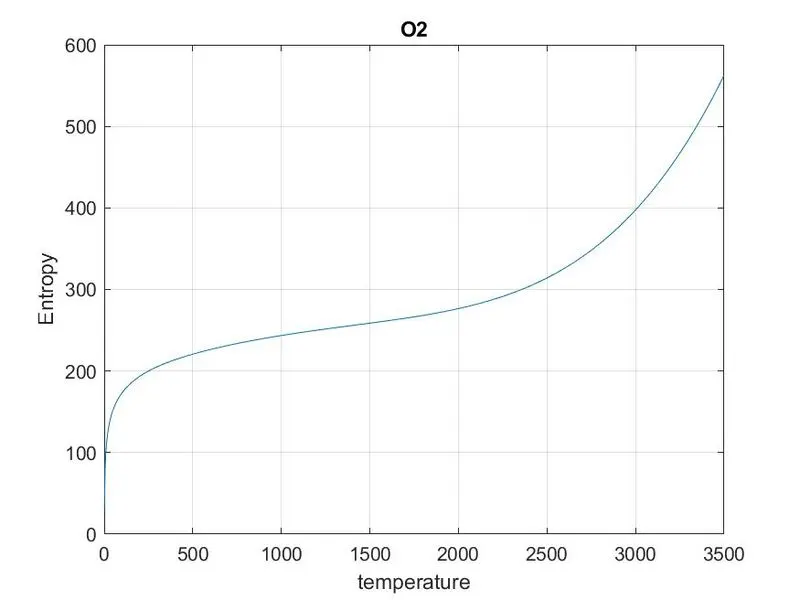
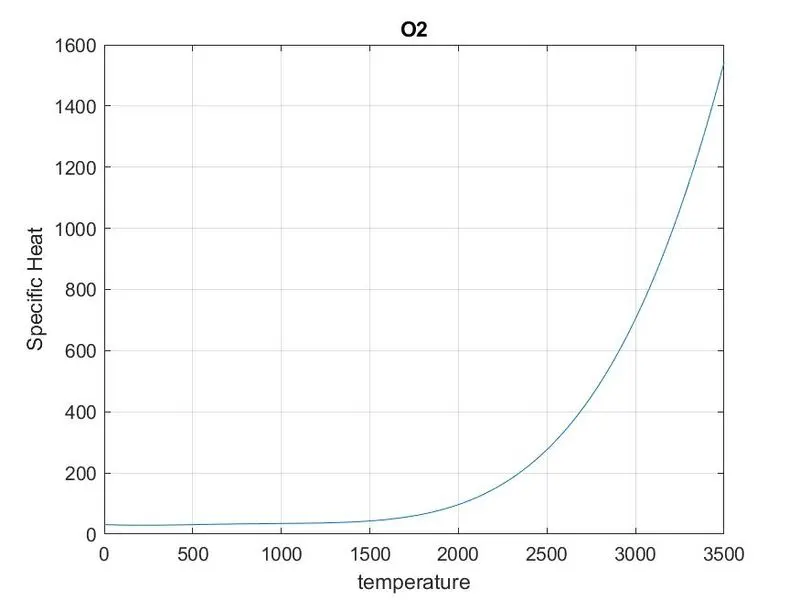
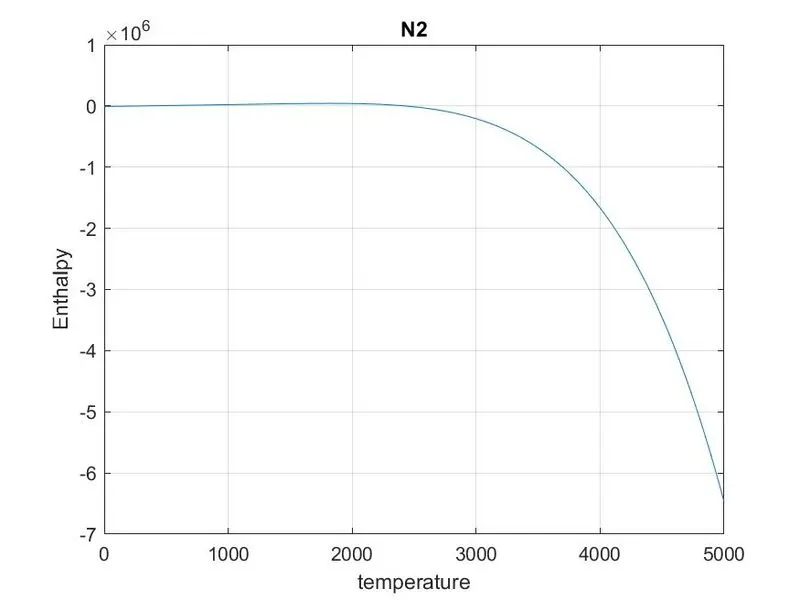
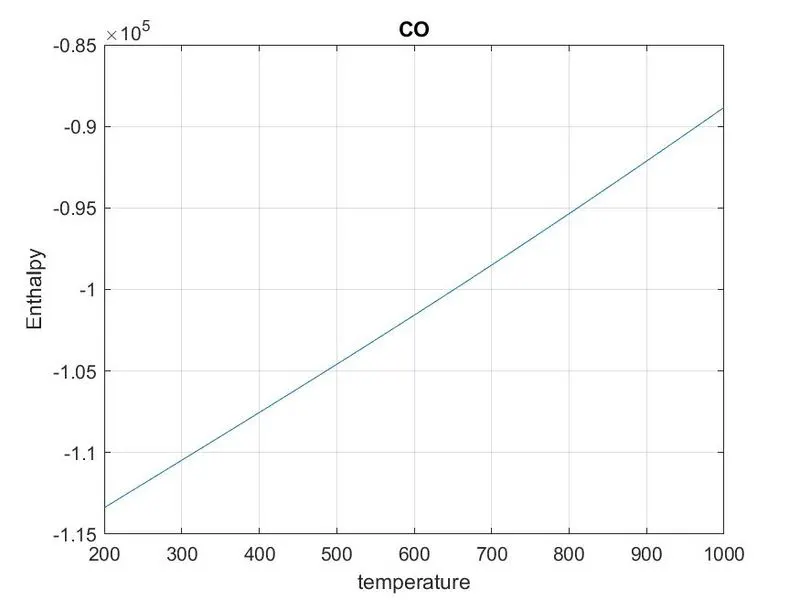
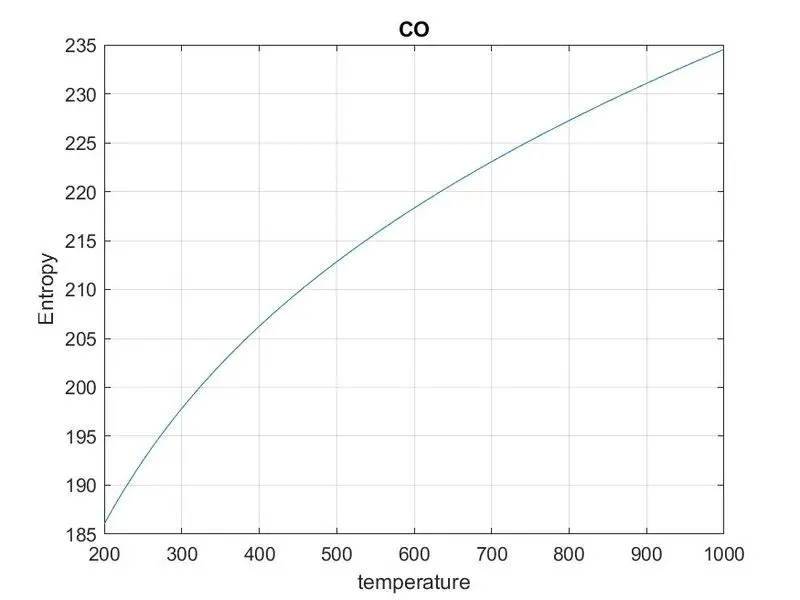
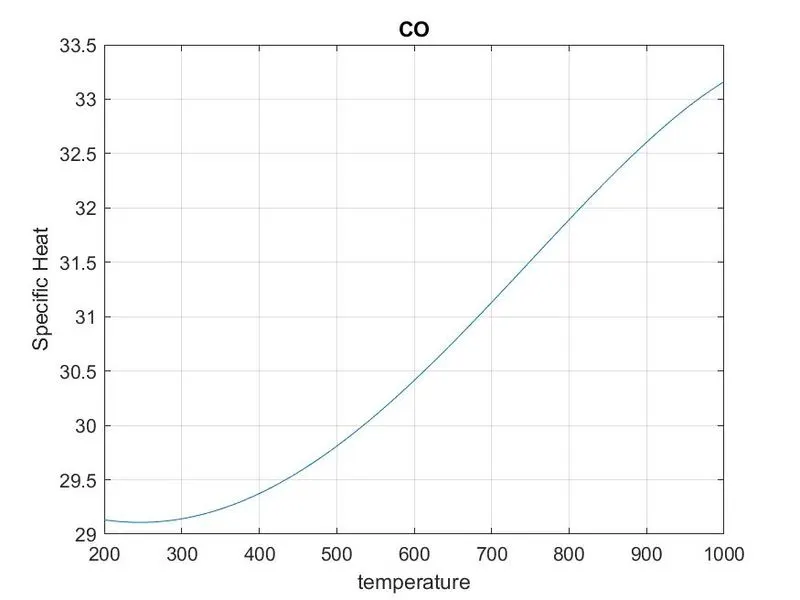
- Plot the cp, Enthalpy and Entropy for the local temperature range specific for each species.
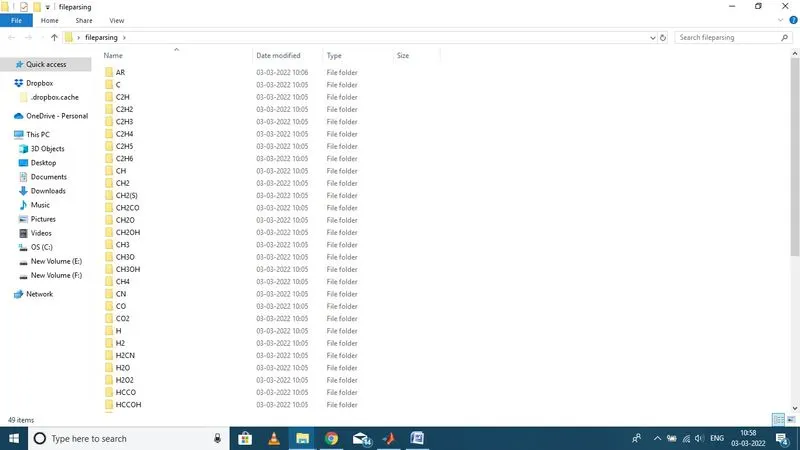
- Save the plots as images with appropriate names and dump them in separate folders for each species.
THEORY:
Data Parsing:
Data parsing is a process of extracting data from the file and use that data for further calculation, study or making important conclusions.
NASA Thermodynamic Data file:
‘THERMO.dat’ file is a data file containing 14 coefficients for 53 different elements given by NASA. These coefficients are used to calculate the specific heat, enthalpy and entropy for a particular species using the given formula.
where,
R = universal gas constant
T = Temperature
Cp = specific heat(KJ)
S = Entropy(KJ/mol-K)
H = Enthalpy(KJ/mol)
a(i) = coefficients where i = 1 to 14
MATLAB Code:
clear all
close all
clc

% getting the data file
f1 = fopen('THERMO.dat','r');
fgetl(f1)

% Reading the header information
A = fgetl(f1);
A = strsplit(A,' ');
global_low_temp = str2num(A{2});
global_mid_temp = str2num(A{3});
global_high_temp = str2num(A{4});

% skipping next three lines
for i = 1:3
    fgetl(f1);
end

% reading the species
for i = 1:53
    header = fgetl(f1);
speciesheader = strsplit(header,' ');
species_name = speciesheader{1};

t1 = str2double(speciesheader{6});
t2 = str2double(speciesheader{7});
t3 = str2double(speciesheader{8});

% getting first line coefficients(a1-a5)
line_1 = fgetl(f1);

a = strfind(line_1,'E');
a1 = str2double(line_1(1:a(1)+3));
a2 = str2double(line_1(a(1)+4:a(2)+3));
a3 = str2double(line_1(a(2)+4:a(3)+3));
a4 = str2double(line_1(a(3)+4:a(4)+3));
a5 = str2double(line_1(a(4)+4:a(5)+3));

% getting second line coefficients(a6 - a10)
 line_2 = fgetl(f1);

 a_1 = strfind(line_2,'E');
 a6 = str2double(line_2(1:a_1(1)+3));
 a7 = str2double(line_2(a_1(1)+4:a_1(2)+3));
 a8 = str2double(line_2(a_1(2)+4:a_1(3)+3));
 a9 = str2double(line_2(a_1(3)+4:a_1(4)+3));
 a10 = str2double(line_2(a_1(4)+4:a_1(5)+3));

% Getting third line coefficients( a11 - a14)
line_3 = fgetl(f1);
a_2 = strfind(line_3,'E');
a11 = str2double(line_3(1:a_2(1)+3));
a12 = str2double(line_3(a_2(1)+4:a_1(2)+3));
a13 = str2double(line_3(a_2(2)+4:a_1(3)+3));
a14 = str2double(line_3(a_2(3)+4:a_1(4)+3));

% Creating folder
mkdir(['C:\Users\dell 1\Desktop\fileparsing\',species_name]);

T = linspace(t1,t3,1000);
R = 8.314;

% to get array of specific heat, enthalpy and entropy
 for k = 1:length(T)

     % to compare species temperature to assign the coefficients
     %a1-a7(high temperature coefficients), a8-a14(low temperature
     %coefficients)
     if T(k)>t2

    % high temperature coefficients

    cp = (a1 + a2.*T+a3.*T.^2 + a4.*T.^3+a5.*T.^4)*R;
    H = (a1+(a2.*T)/2+(a3.*T.^2)/3+(a4.*T.^3)/4+(a5.*T.^4)/5+(a6./T))*R.*T;
    S = (a1.*log(T)+a2.*T+(a3.*T.^2)/2+(a4.*T.^3)/3+(a5.*T.^4)/4+a7)*R;

     else
         %low temperature coefficients
         cp = (a8+a9.*T+a10.*T.^2+a11.*T.^3+a12.*T.^4)*R;
         H = (a8+(a9.*T)/2+(a10.*T.^2)/3+(a11.*T.^3)/4+(a12.*T.^4)/5+(a13./T))*R.*T;
         S = (a8.*log(T)+a9.*T+(a10.*T.^2)/2+(a11.*T.^3)/3+(a12.*T.^4)/4+a14)*R;
     end
 end

 % plotting the graphs

 figure(1)
 plot(T,cp)
 grid on
 title(species_name)
 xlabel('temperature')
 ylabel('Specific Heat')

 figure(2)
 plot(T,H)
 grid on
 title(species_name)
 xlabel('temperature')
 ylabel('Enthalpy')

 figure(3)
 plot(T,S)
 grid on
 title(species_name)
 xlabel('temperature')
 ylabel('Entropy')

 % changing the directory and saving the file
 saving = (['C:\Users\dell 1\Desktop\fileparsing\',species_name]);
 cd(saving);
 saveas(1,'specific heat','jpg');
 saveas(2,'enthalpy','jpg');
 saveas(3,'entropy','jpg');

 %molecular mass calculation
 species = species_name;
 elements = ['H','C','O','N','AR'];
 atomic_weight = [1.008 12.011 15.999 14.007 39.948];
 mol_mass = 0;
 for i=1:length(species)
     for m=1:length(elements)
         if strcmpi(species(i),elements(m))
             mol_mass = mol_mass+atomic_weight(m);
             position=m;
         end
     end
 end
 n = str2double(species(i));
 if n>1
     mol_mass = mol_mass + elements(position)*(n-1);
 end
 fprintf('Molecular Weight of %s:%f u\n',species,mol_mass)
end
fclose(f1);
Explanation and steps to program:
- We have to open THERMO.dat file and read thgis file using fopen command
- Using fgetl command we read the lines and split temperatutre data using strsplit command
- Then convert the string into number by str2num command to find low, mid and high temperature
- Now we run loop to locate all 53 species using fgetl command
- In order to read the coefficient in data file we will first find the E stringusing strfind command to find before and after numbers of coefficients then we will find remaining 14 coefficients and convert them into strings
- We create folder to store the plots by using mkdir command
- Using if and else loop we assign high and low temperature to the calculation of properties of species in the given formula
- We plot the graphs of specific heat, enthalpy and entropy vs temperature and label them respective to their axes.
- There are basic 5 elements by which all 53 species are formed, so we made a array of that elements and array of there respective atomic weight.
- Now we run for and if loop to calculate the molecular mass of the species
- Using fprintf command we display the molecular mass of all 53 species.
OUTPUTS:
1) Screenshot of directory.
2) plot of O2
3) plot of N2
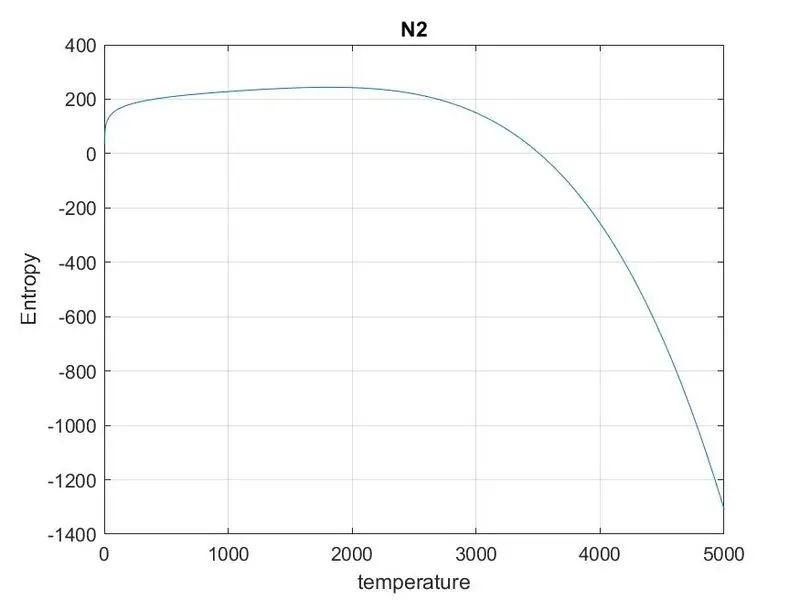
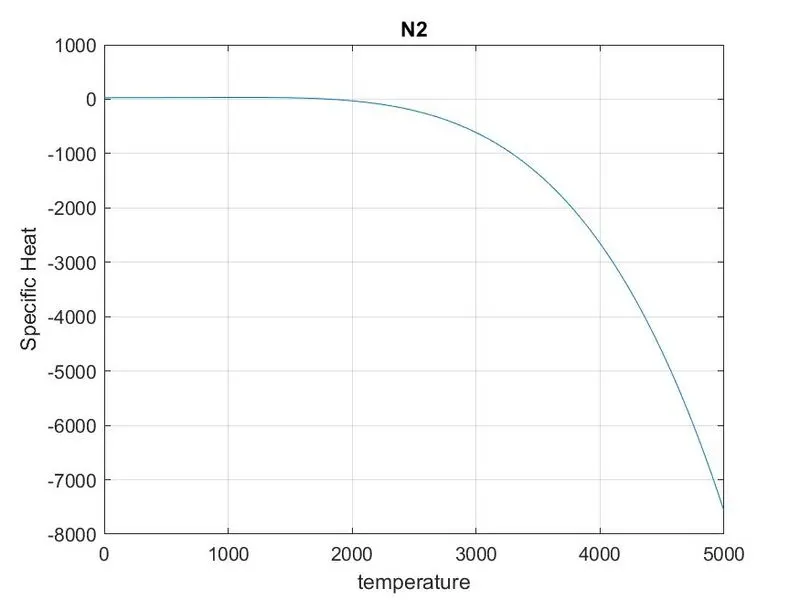
3) plot of CO
4) Molecular Weight in command window: