Project 1 - Data Cleaning and Transformation using Pivot table and Charts for the Report on requirement of Team Hiring
Data Cleaning and Reporting Project for Company ABC Private Limited:
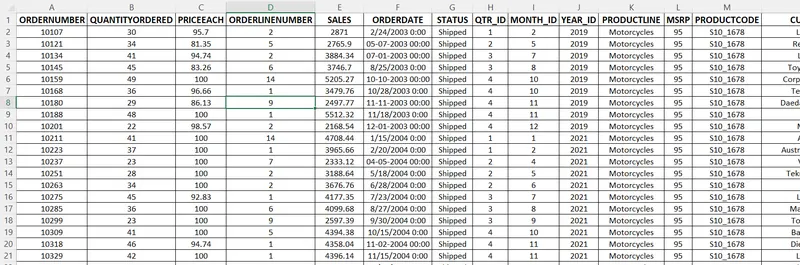
a. Do proper formatting of the data with using borders, font size and appropriate alignment of the content.
Ans:
b. Make summary of Products Sales by providing:
Total Sum of Sales
Average of Sales
Standard Deviation of Sales
Variance of Sales
Maximum Sales
Minimum Sales
Ans:
Using Pivot Table:

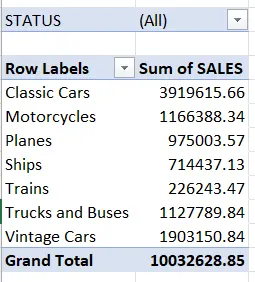
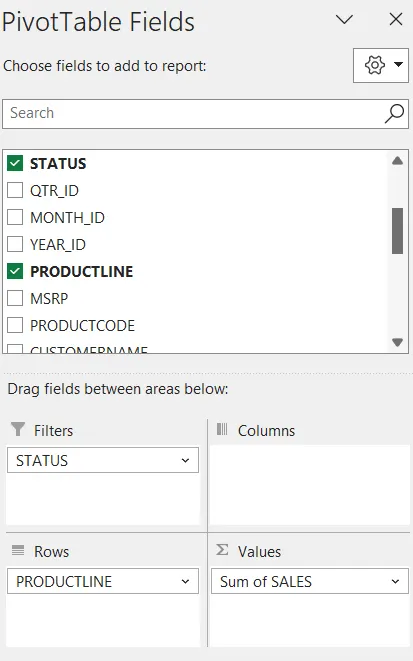
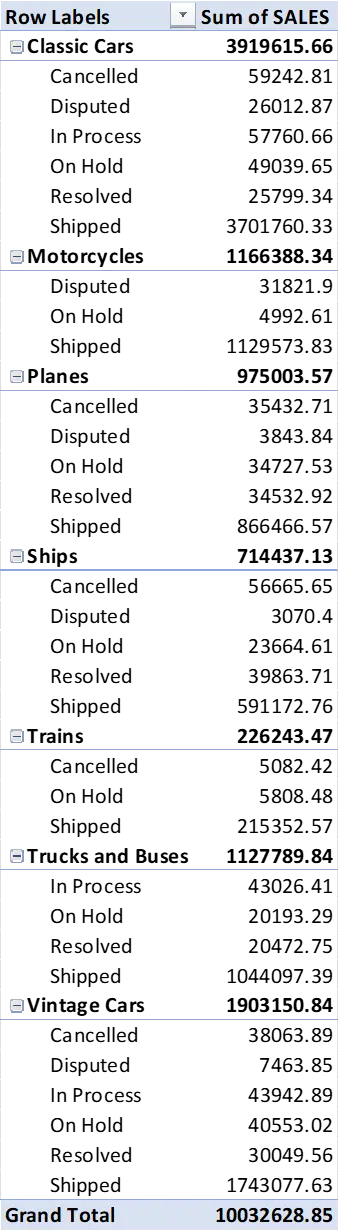
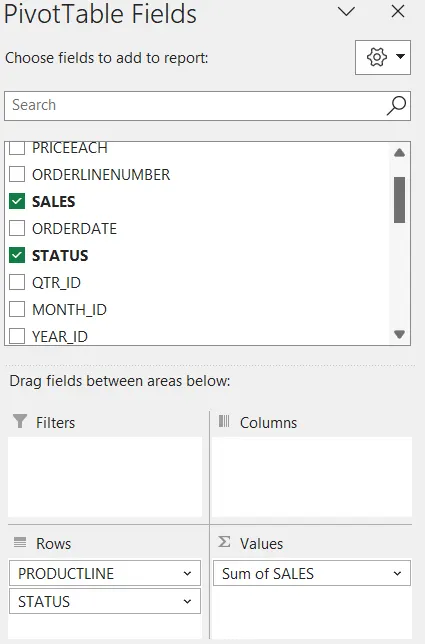
c. Make worksheet from the given Data for categorical representation of table based on fields Status, ProductLine and Sales using Pivot Table.
Ans:
Row LabelsSum of SALESGrand Total10032628.85
| STATUS | (All) |
| Classic Cars | 3919615.66 |
| Motorcycles | 1166388.34 |
| Planes | 975003.57 |
| Ships | 714437.13 |
| Trains | 226243.47 |
| Trucks and Buses | 1127789.84 |
| Vintage Cars | 1903150.84 |
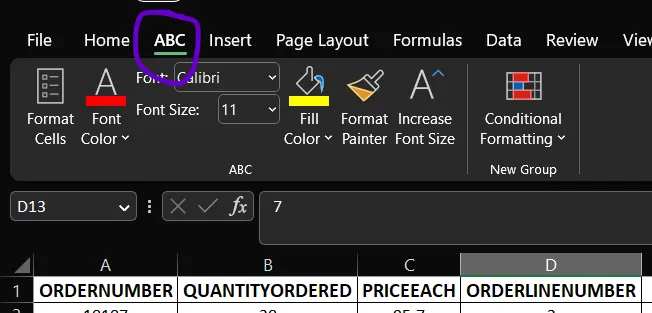
d. Make Customized Ribbon by naming ABC and keep all data formatting commands in the newly created Ribbon.
Ans:
Created a new ribbon named ABC:
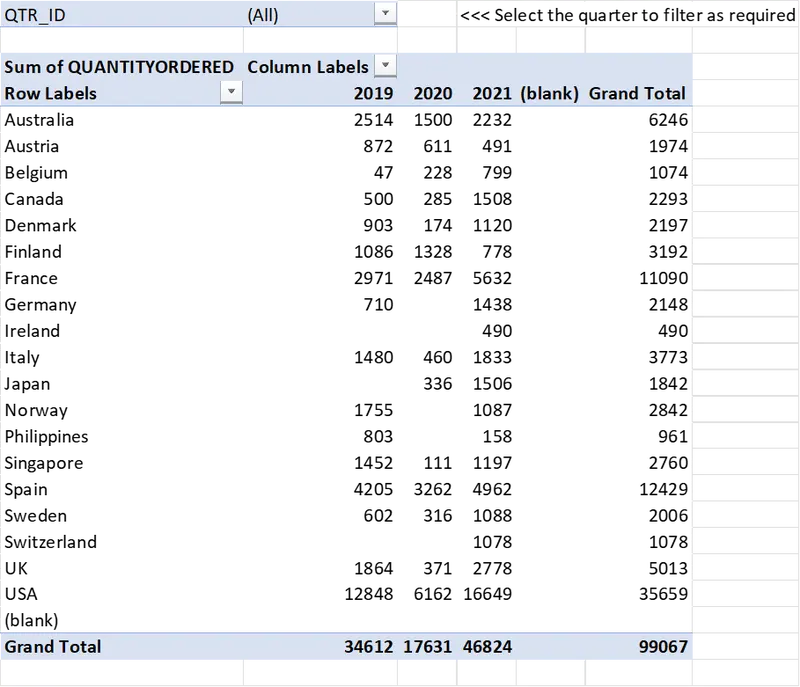
e. Analyse the Quantities ordered by each Country in Year 2019,2020 and 2021 for different Quarters using Pivot Table.
Ans:
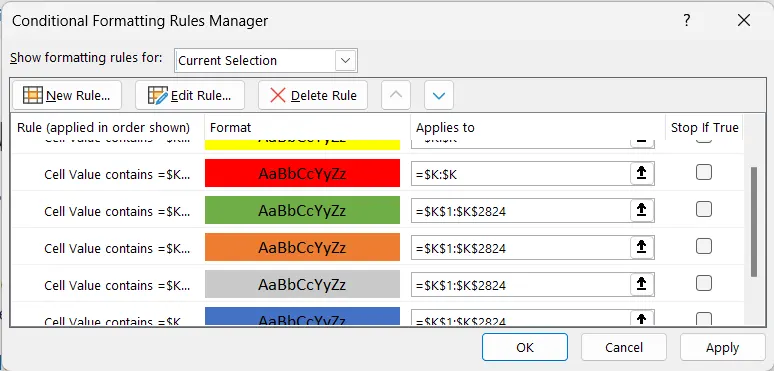
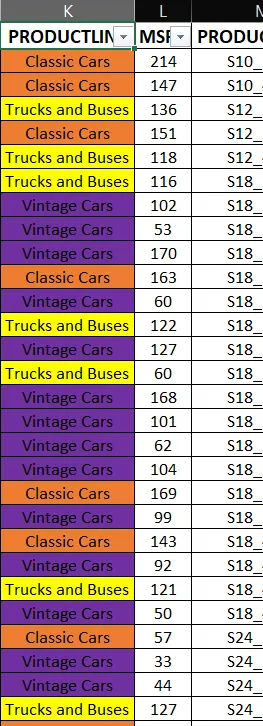
f. Present the data in different colours for values in field Status and ProductLine using conditional formatting.
Ans:
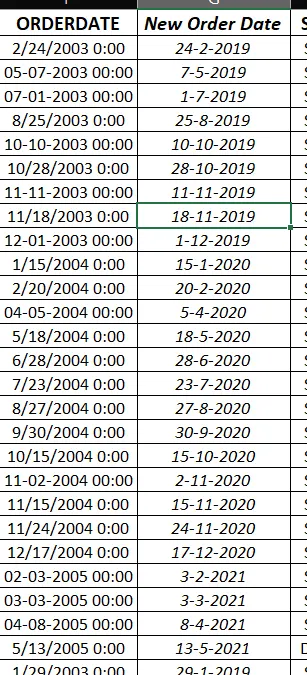
g. Clean the Data with respect to date by proper date formatting and change values of 2003 to 2019, 2004 to 2020 and 2005 to 2021.
Ans:
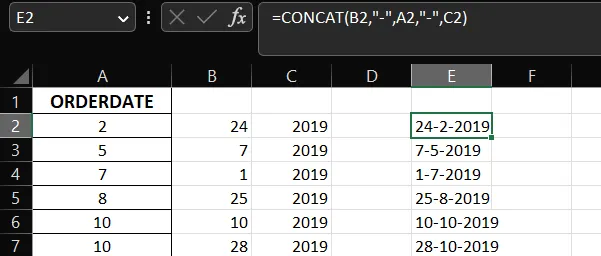
Steps followed:
- Used Text -To-Column for the given column to remove the trailing time stamps
- Used Text -To-Column again on the processed column to get date month and year in saperate columns
- Find and Replace - Replaced 2003 with 2019, 2004 with 2020, and 2005 with 2021
- used =CONCAT() to combine the date in a new column
- used =DATEVALUE
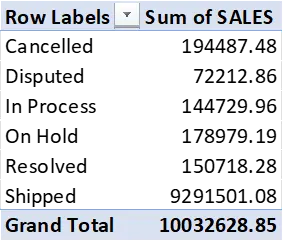
h. Calculate the total sales of all “Shipped”, “Cancelled”, “Disputed”, “In Process”, “On Hold”, “Resolved” products.:
Ans:
Using Pivot Table:
Row LabelsSum of SALESGrand Total10032628.85
| Cancelled | 194487.48 |
| Disputed | 72212.86 |
| In Process | 144729.96 |
| On Hold | 178979.19 |
| Resolved | 150718.28 |
| Shipped | 9291501.08 |
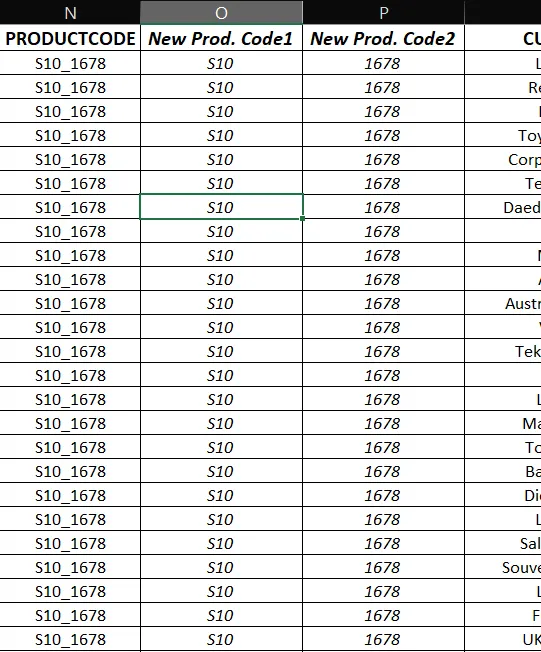
i. Add two new fields in data sheet with reference to Productcode using text functions - Example S10_1678 to be split as S10 in one column and 1678 in another column.
Ans:
Added 2 new columns on the right of PRODUCTCODE column and Used Text -To-Column to split the code in 2 new fields:
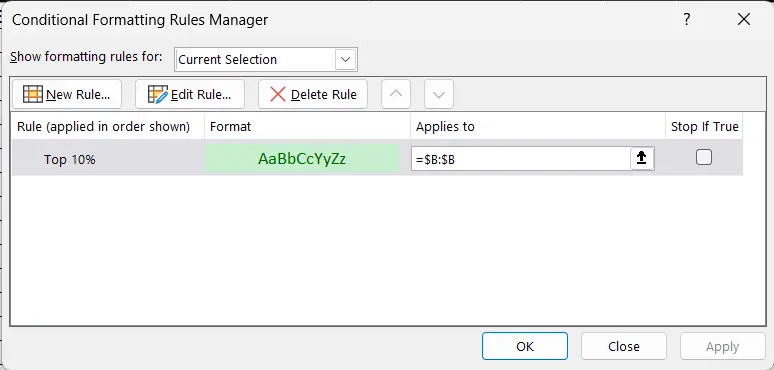
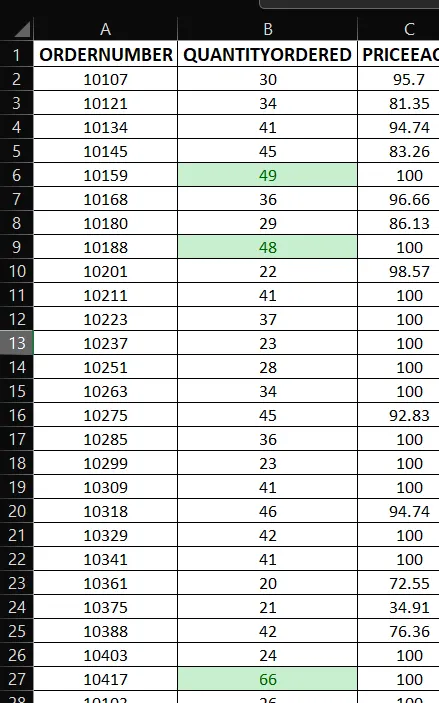
j. Highlight the top 10% values of QuantityOrdered field using Conditional Formatting
Ans:
Used Conditional Formatting with the Top 10% rule: