Project 1_Comparative study of different storey buildings for Seismic forces
AIM:- to do a comparative study of 10 different buildings for the following aspects
- factors influencing the dynamic characteristics of the building
- factors influencing the natural period of a building
- factors influencing the mode shape of oscillations
GIVEN DATA:-
- height of the story as 3m
- height of the plinth as 1.5m
- dead load on the beam from wall infill is 10KN/m
- live load is taken as 3kn/m^2
- the thickness of the slab as 150mm
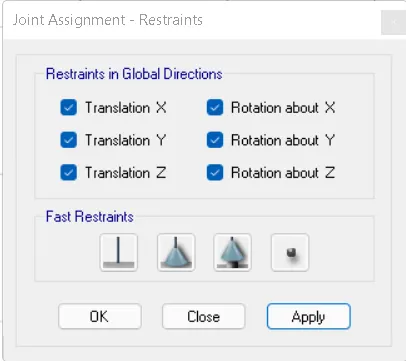
- the base of the structure is pinned
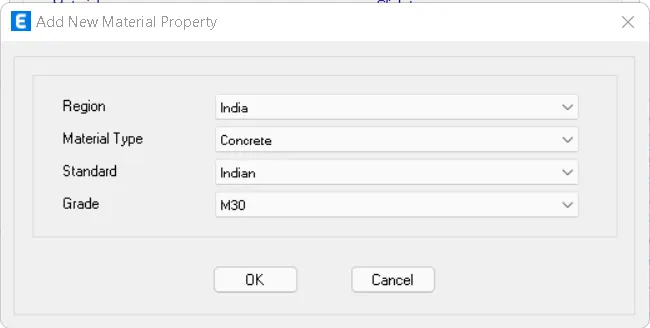
- grade of the concrete as M30
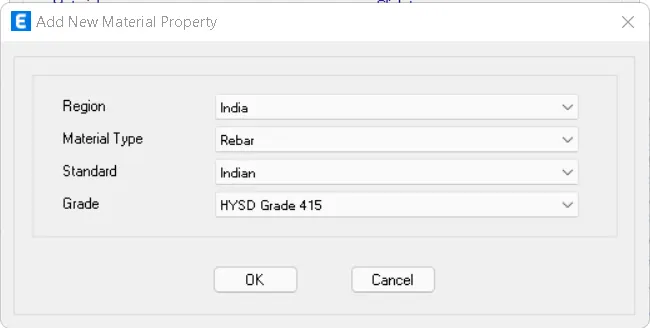
- grade of the reinforcement as Fe415
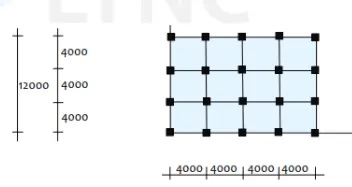
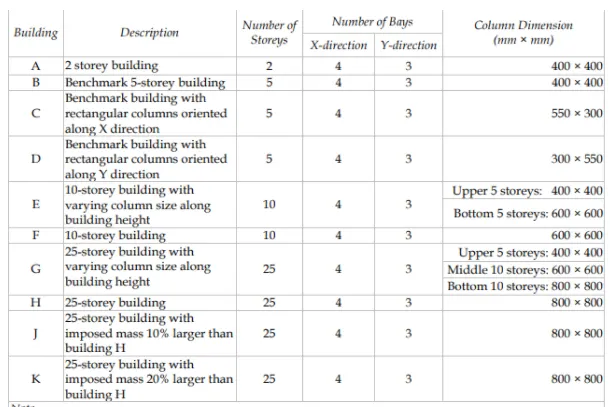
- DETAILS OF EACH BUILDING ARE GIVEN AS FOLLOWS
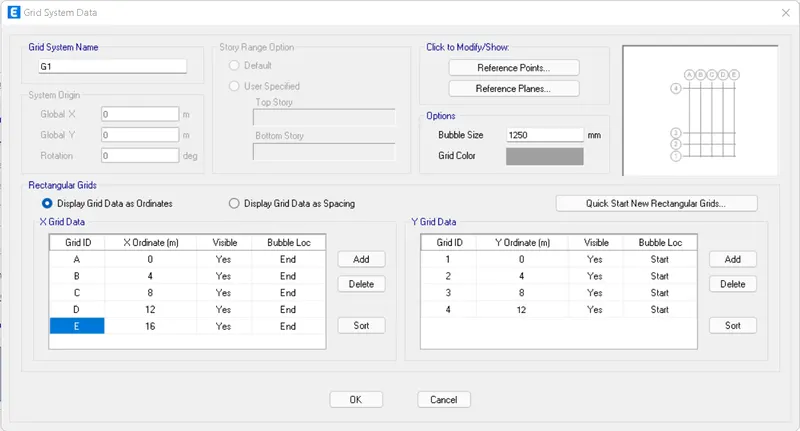
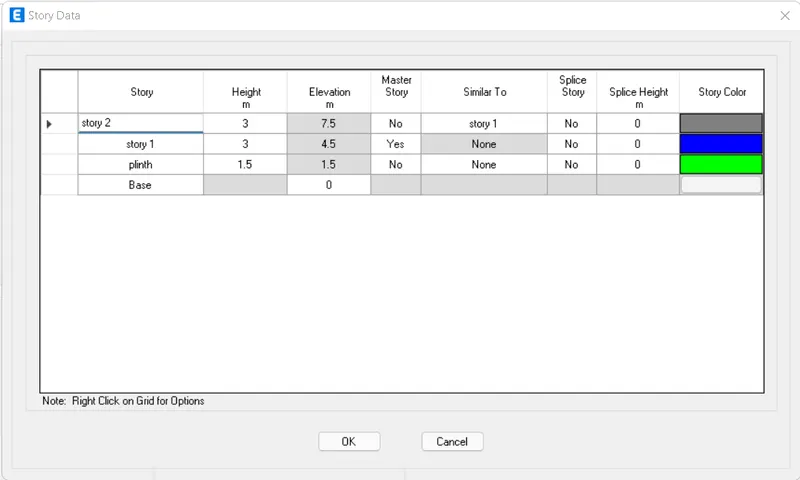
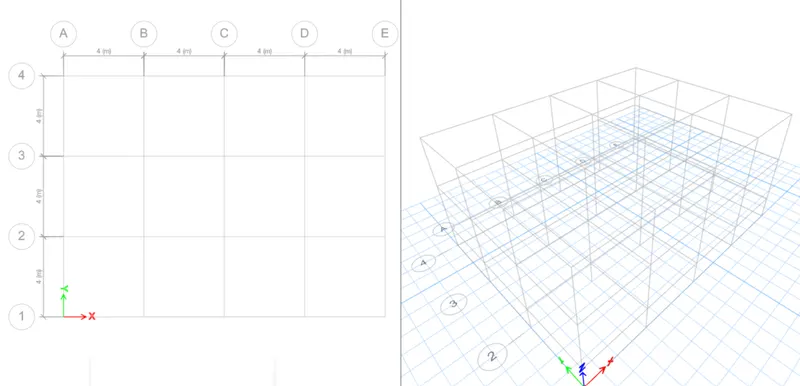
step 1:- to create grid and story data
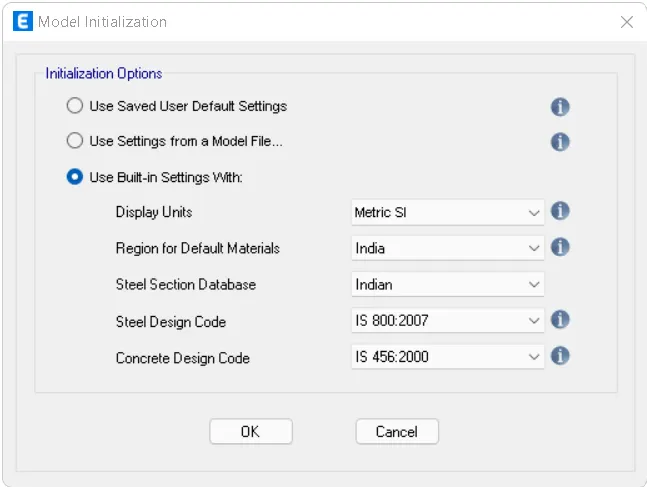
- open etabs> new model
- give the input as per the Indian standards
- go to custom grid data
- and modify the parameters
- go to custom story data and modify the parameters
step 2:- define material properties
- go to define the menu
- click on material properties
- add concrete and reinforcement details as given in the question
step 3:- to add details of structural elements
- go to define
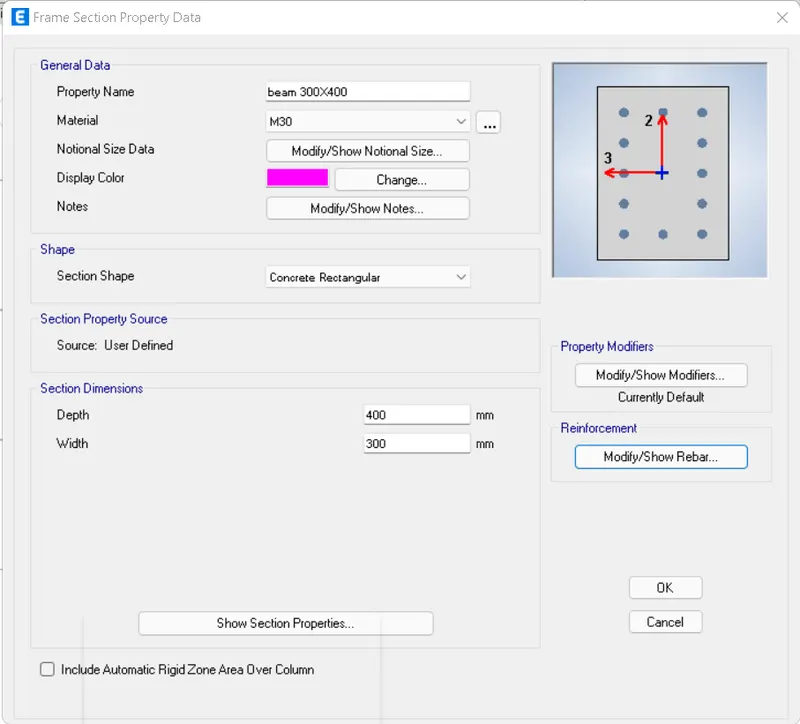
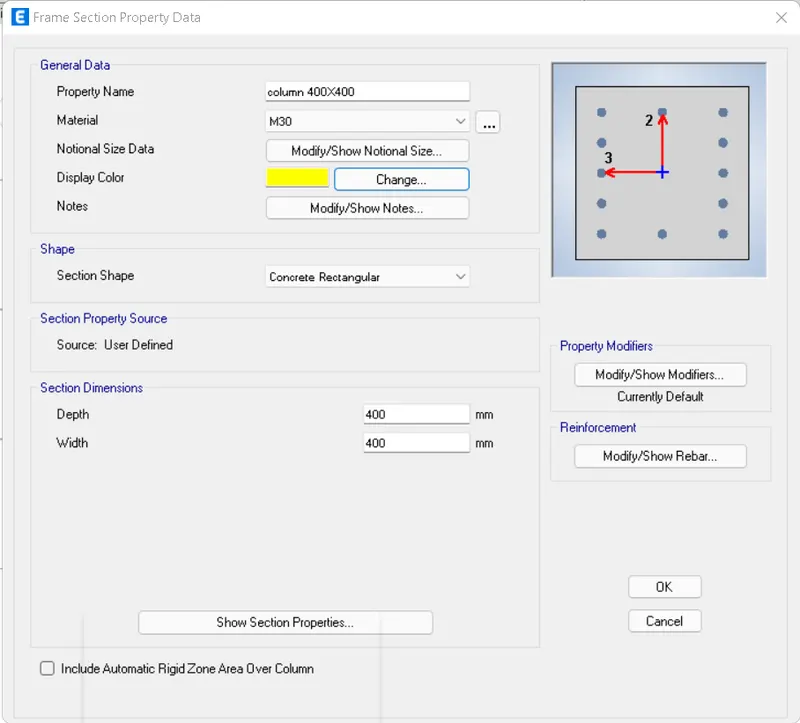
- Click on section properties> frame sections
- then click on add new properties
- add size and shape of beams and columns
- go to define
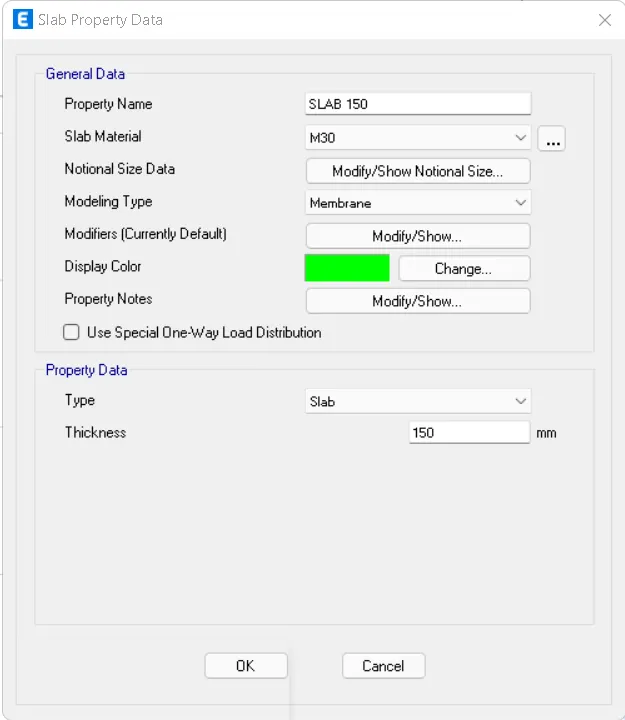
- Click on section properties > slab sections
- add the slab element with a thickness of 150mm
step 4:- to add loads and load cases
- Go to define
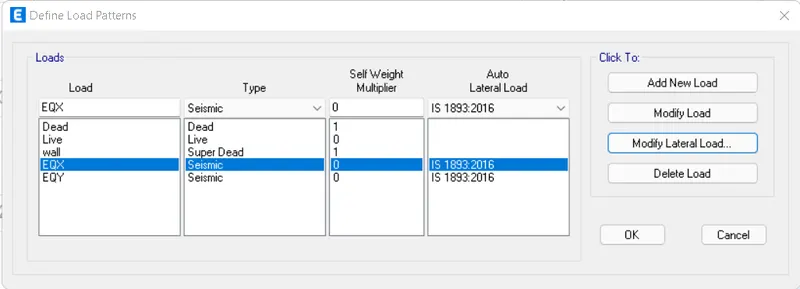
- click on load patterns
- add new loads cases
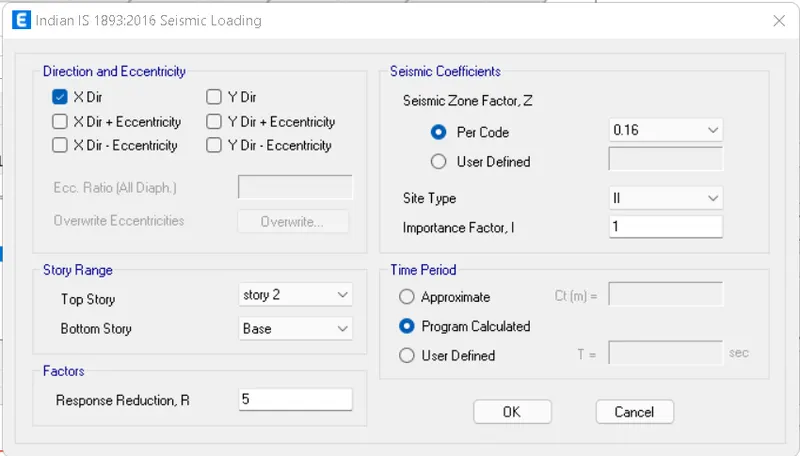
- modify the lateral loading parameters add a zone, influence factor for the seismic loading
- Click on OK
- add load combinations
- go to define
- select load combinations
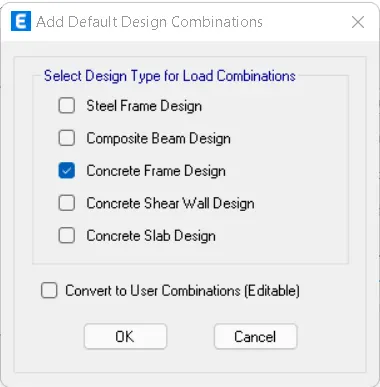
- click on add default design combinations
- select load combination as concrete fame design
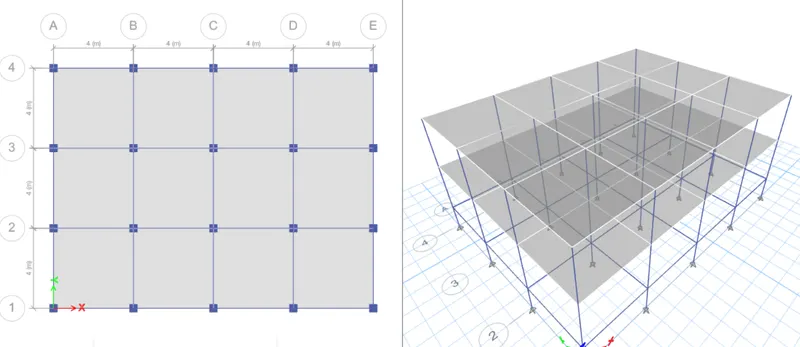
STEP 5:- to model the structure
STEP 6:- To assign loads
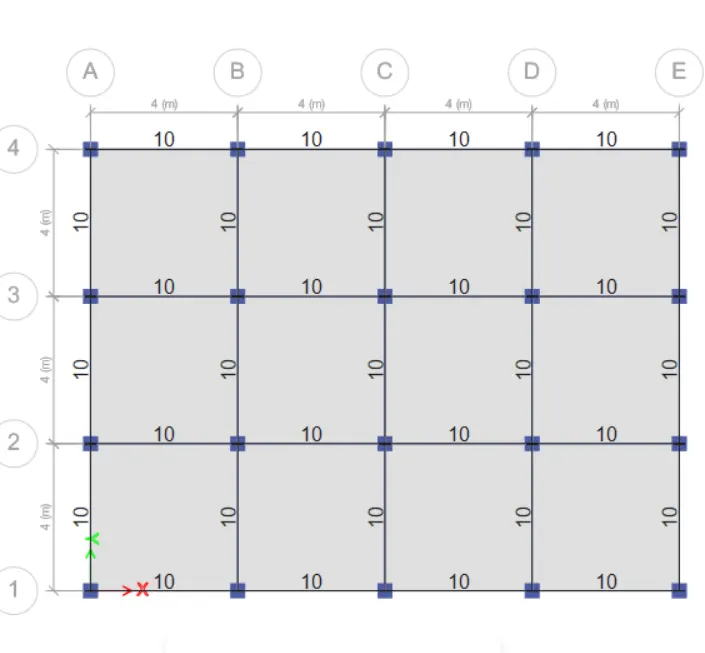
- select the elements for which loads should be assigned
- go to select> properties
- frame sections> beams
- then go to assign
- frame loads
- then give the input as 10kn/m as wall dead load
- then click on ok
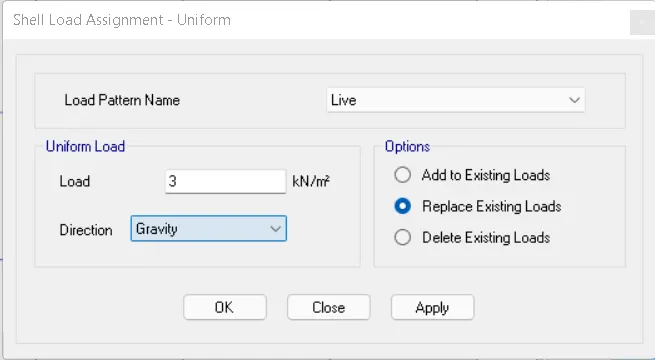
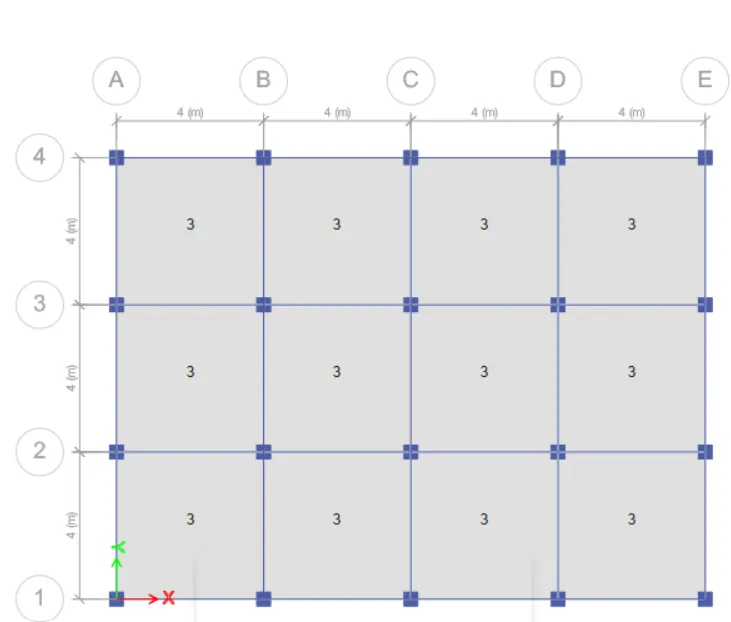
- select all the slab elements
- go to assign
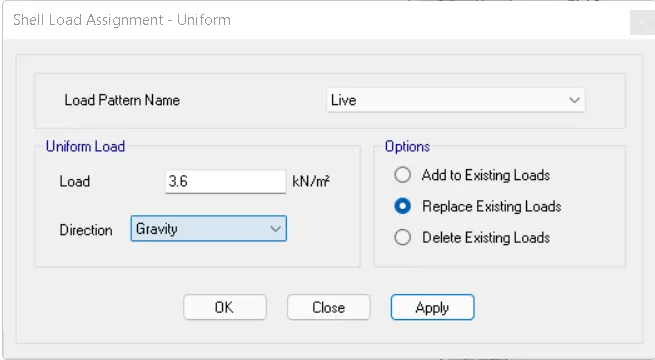
- click on shell loads> uniformly distributed loads
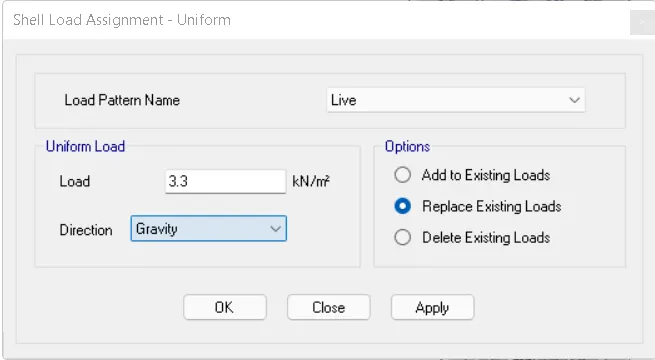
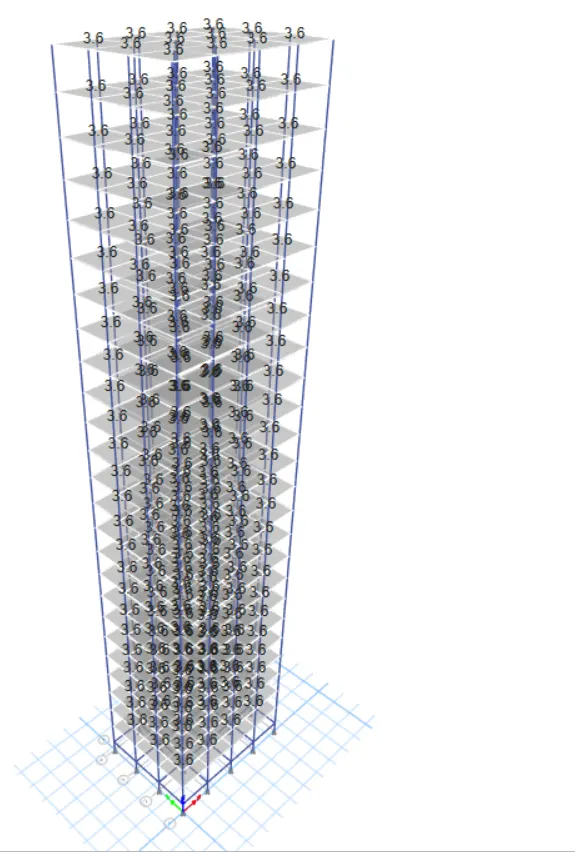
- give the input for the live load as 3
- then click on ok
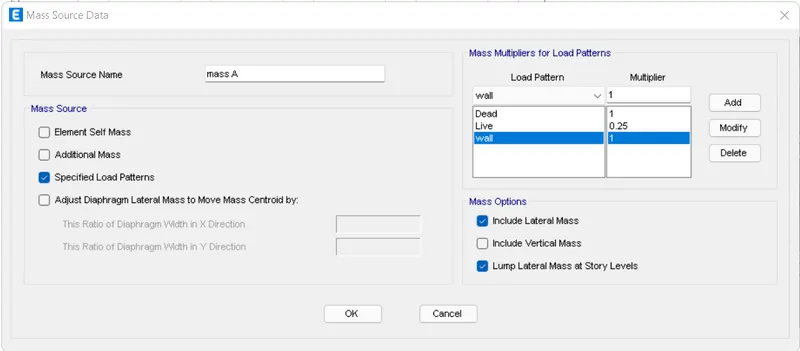
- then assign mass source for the structure
- select all the slab elements
- go to assign a tab
- click on shells
- select diaphragms
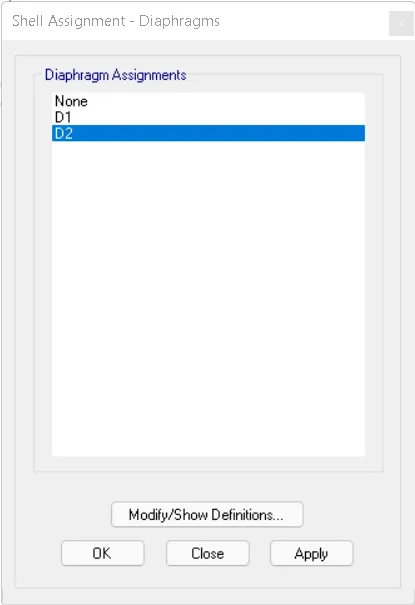
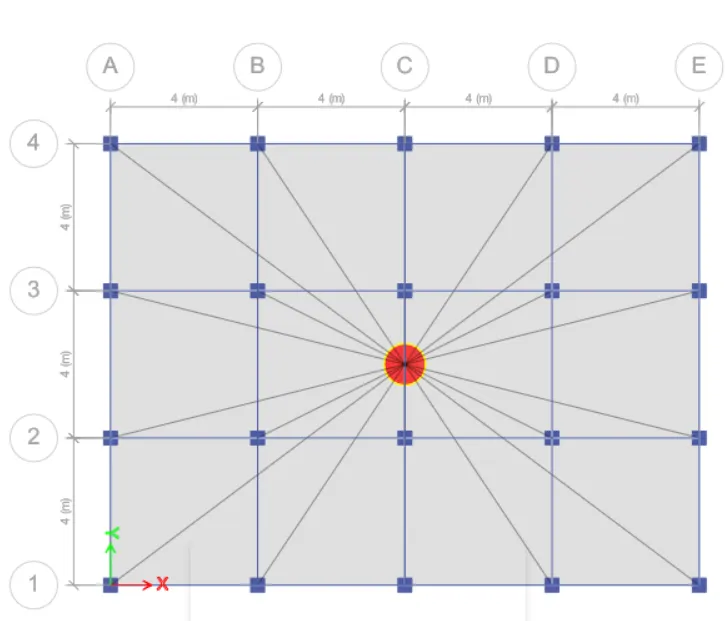
then click on run analysis to get the mode points, time periods, and deformations under the assigned loads
RESULTS:-
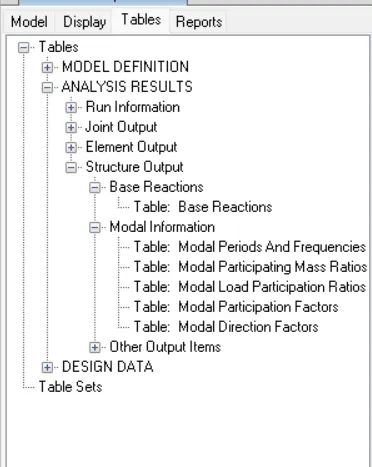
- modal periods and frequencies table
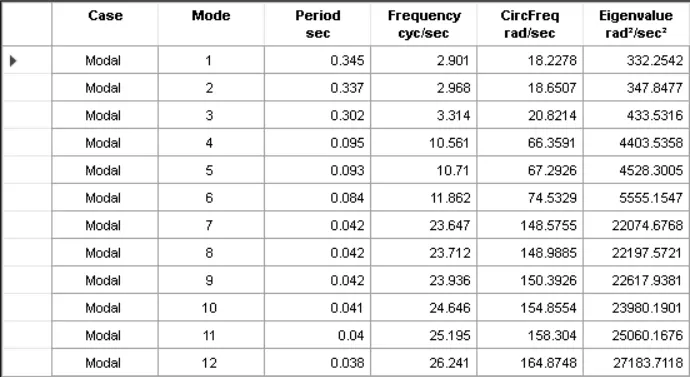
- modal mass participating ratio table
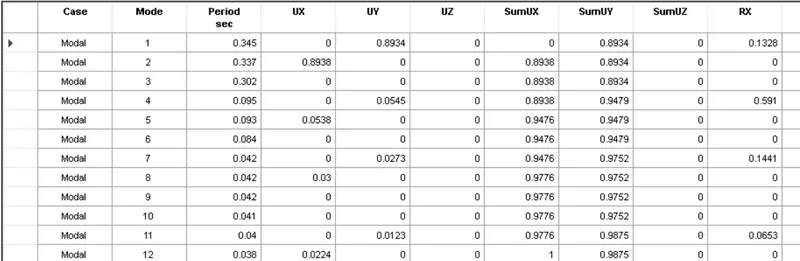
MODEL B
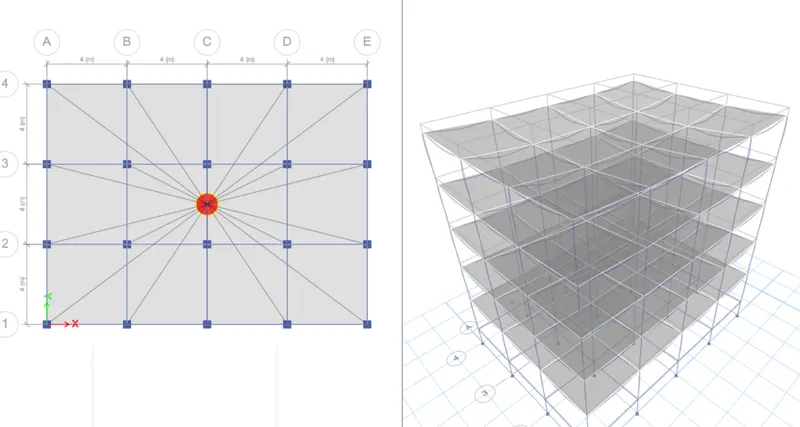
- given size of the beam 300 x 400
- size of the column 400 x 400
- no of storey 5
- height of the storey 3m
- height of the plinth 1.5m
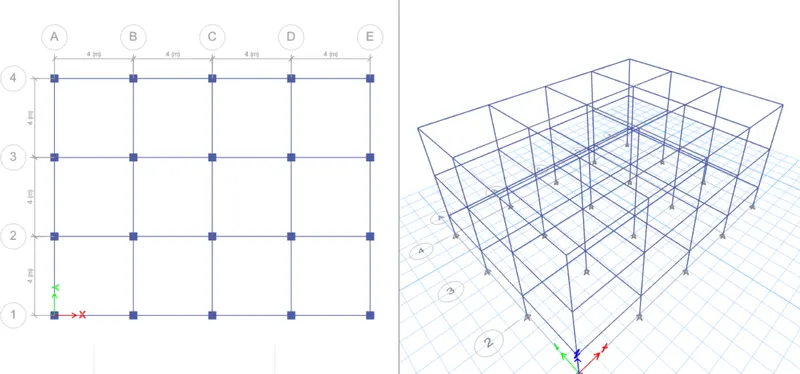
- similar to the model A construct a structure as per the given data
- and run analysis to view the deformations
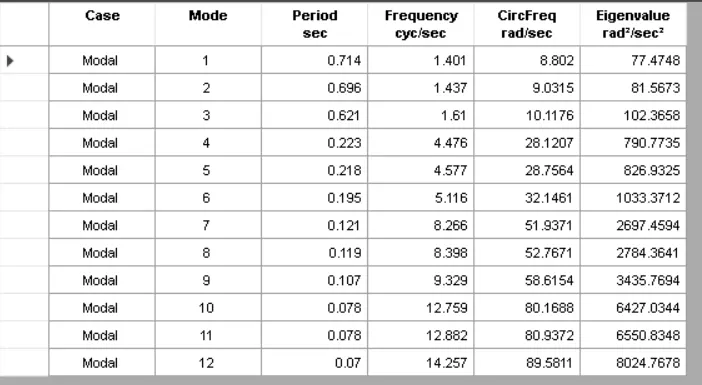
- modal periods and frequencies table
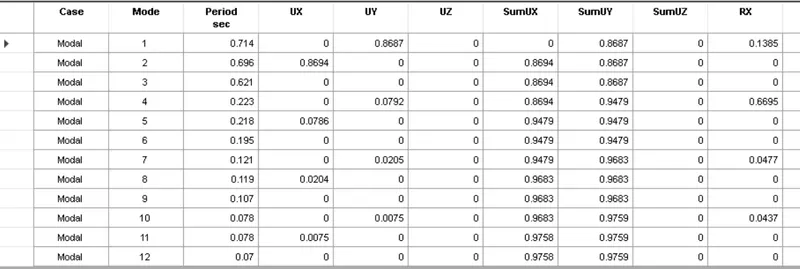
- modal mass participating ratio table
MODEL C
- given size of the beam 300 x 400
- size of the column 550 x 300(rectangular column oriented along X-axis)
- no of storey 5
- height of the storey 3m
- height of the plinth 1.5m
- similar to the model A construct a structure as per the given data
- and run analysis to view the deformations
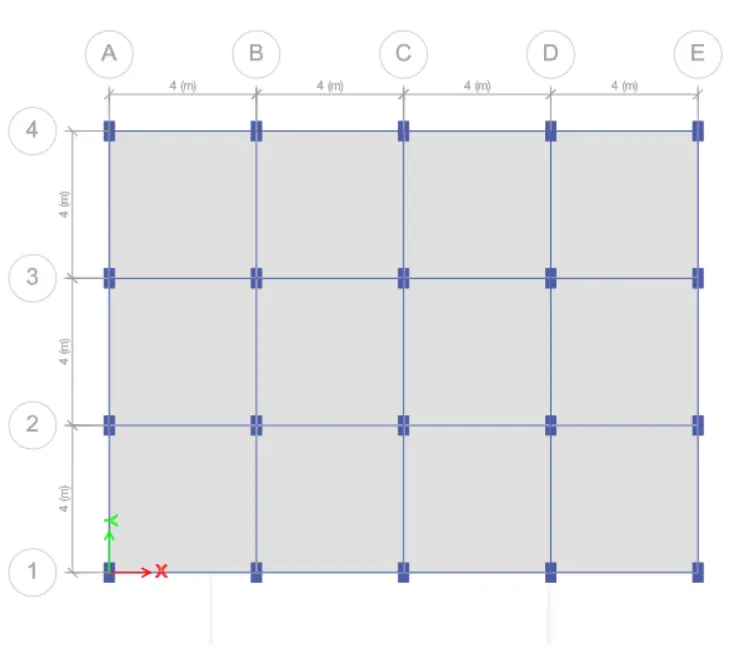
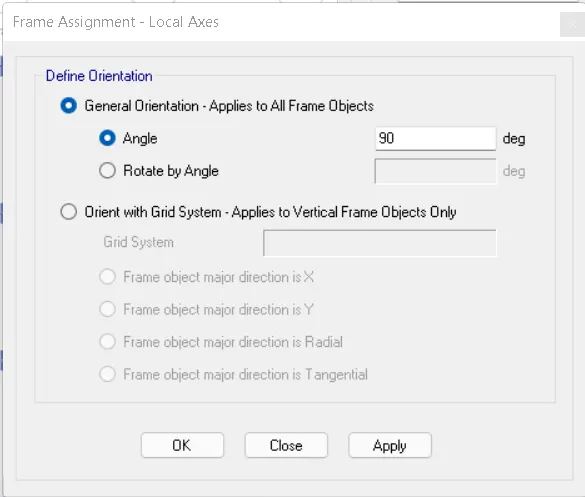
- To orient the columns along x-axis
- select all the columns
- go to assign
- frame> local axes
- given the angle as 90
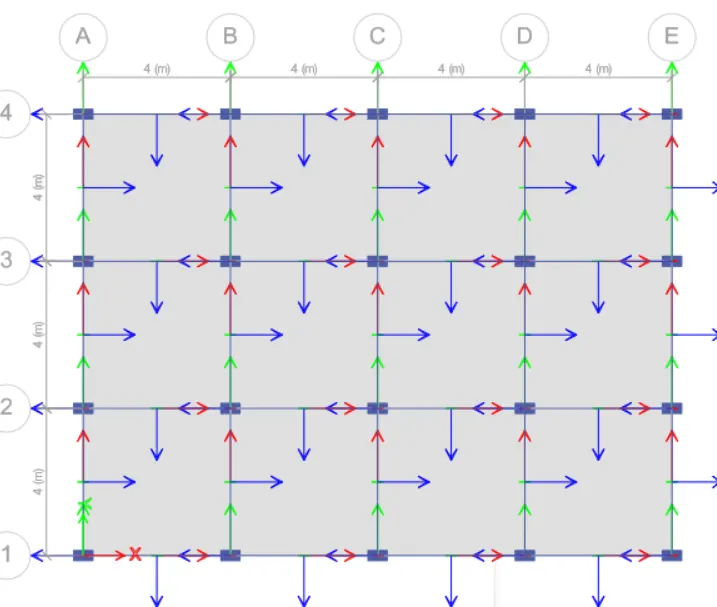
- then assign the diaphragm loads and run analysis to check the deformations
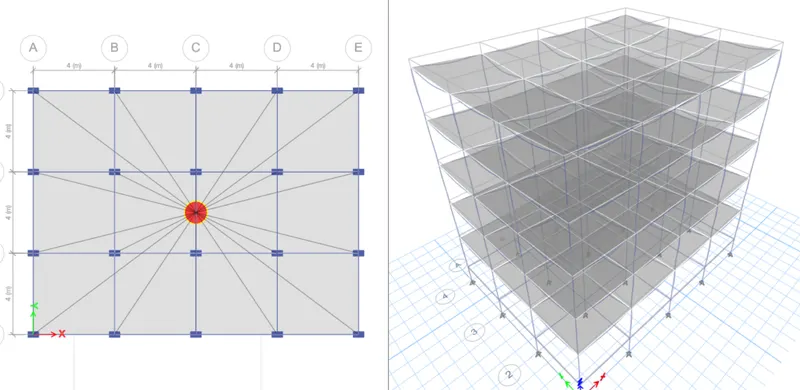
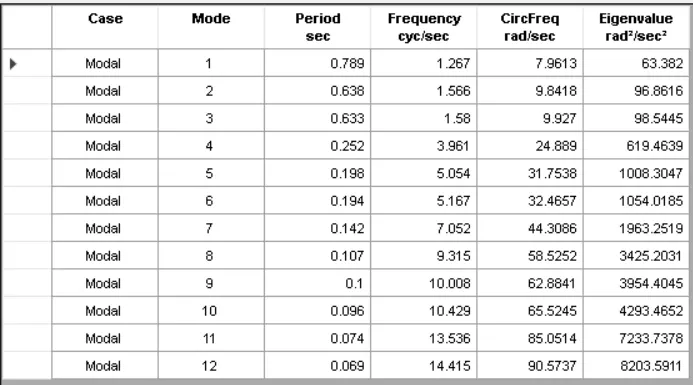
- modal periods and frequencies table
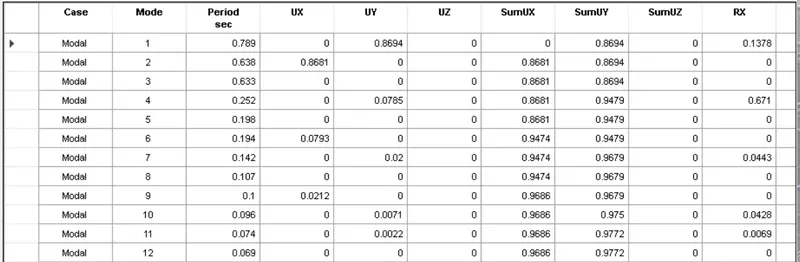
- modal mass participating ratio table
MODEL D
- given size of the beam 300 x 400
- size of the column 550 x 300(rectangular column oriented along X-axis)
- no of storey 5
- height of the storey 3m
- height of the plinth 1.5m
- similar to the model A construct a structure as per the given data
- and run analysis to view the deformations
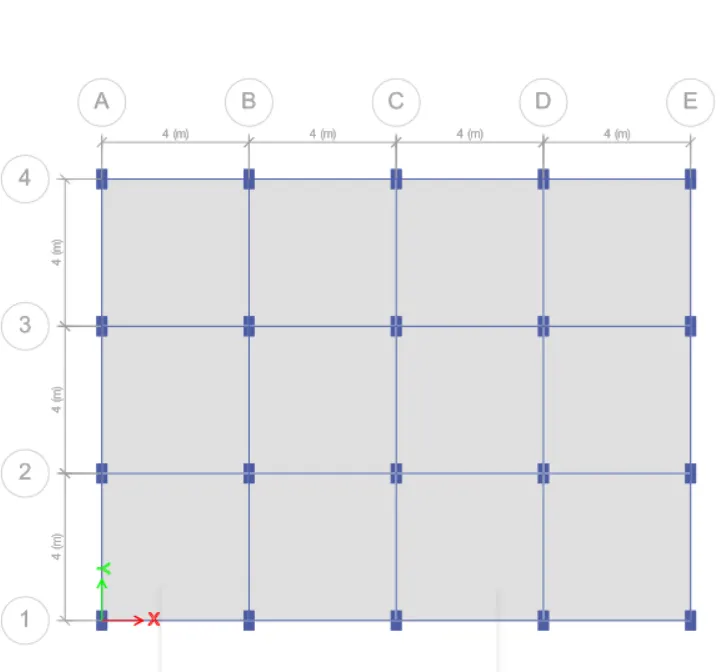
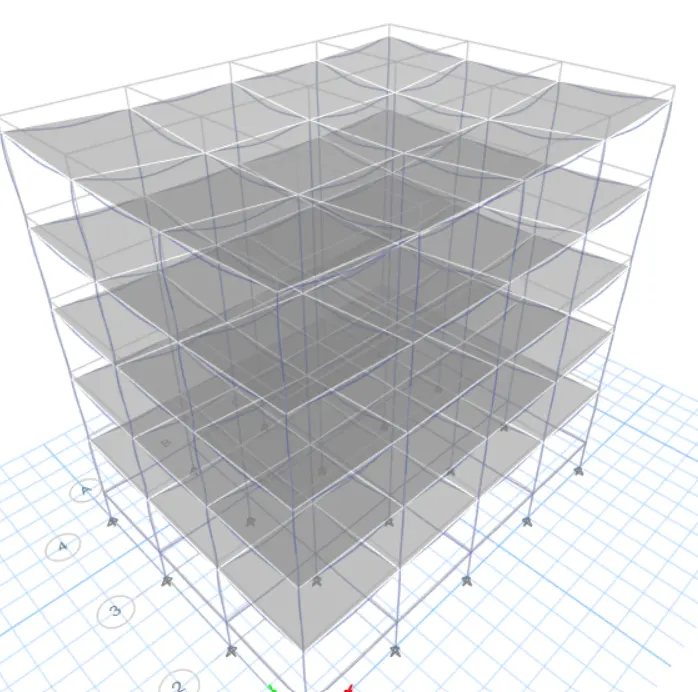
DEFORMED SHAPE OF THE STRUCTURE
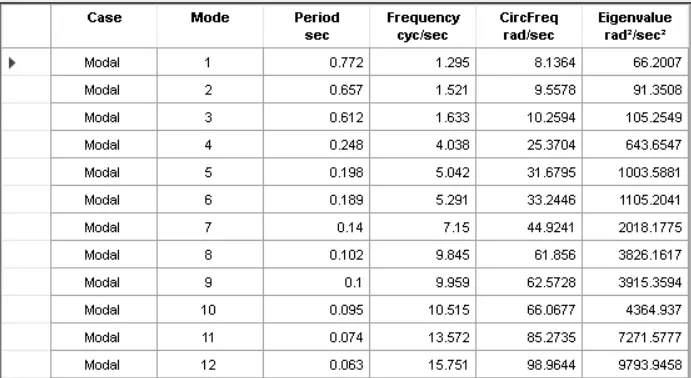
- modal periods and frequencies table
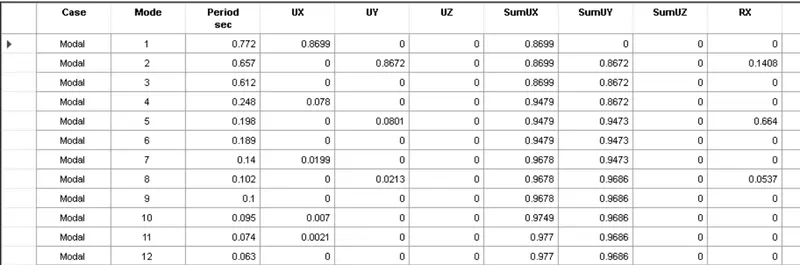
- modal mass participating ratio table
MODEL E
- given size of the beam 300 x 400
- size of the column 600 X 600 (from base to story 5)
- size of the column400 x 400 (from story 6 to story 5)
- no of storey 10
- height of the storey 3m
- height of the plinth 1.5m
- similar to the model A construct a structure as per the given data
- and run analysis to view the deformations
TO ASSIGN DIFFERENT COLUMN SIZES AT DIFFERENT LEVELS
- firstly assign the column sizes as 600x600 for all storys
- then go to view
- select set building view limits from story6 to story 10
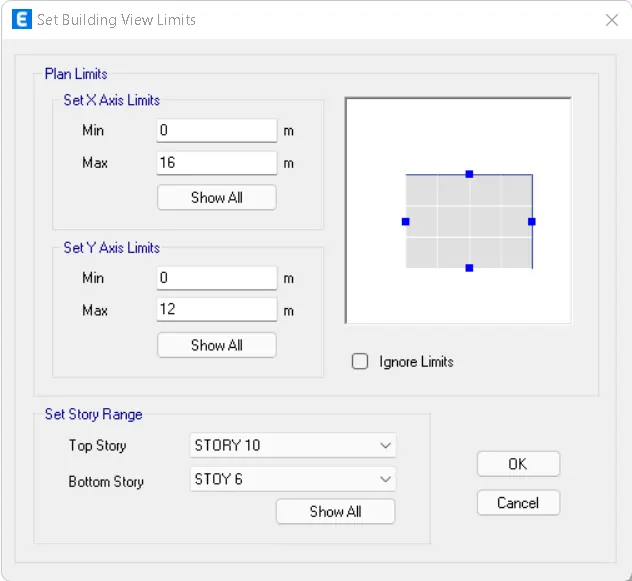
- then select all the columns
- go to assign >frame sections
- select the column size as 400x400
- click on OK
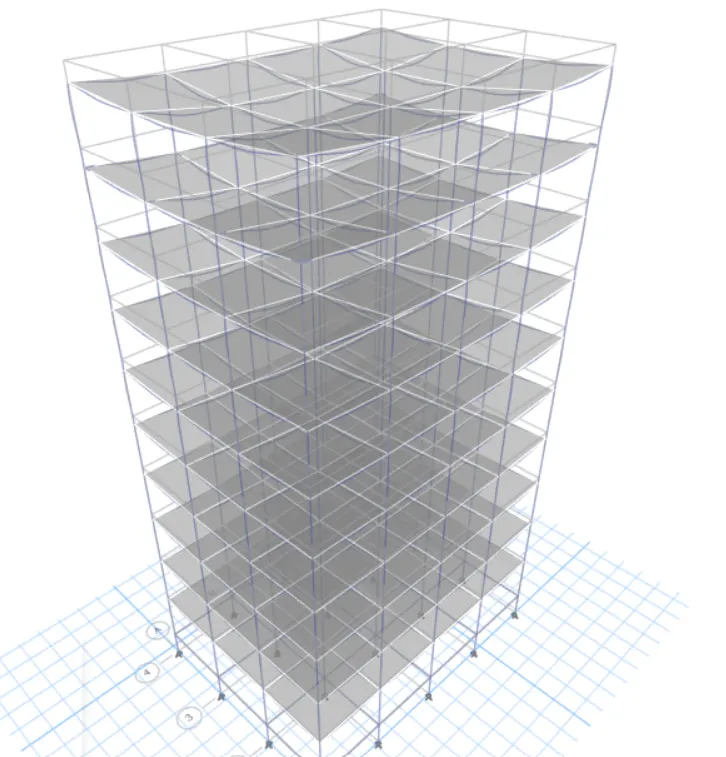
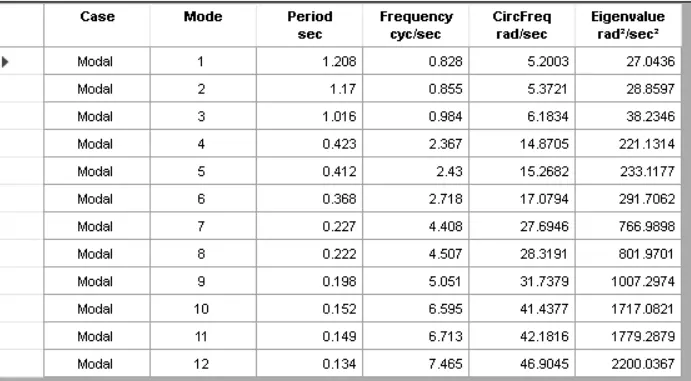
- modal periods and frequencies table
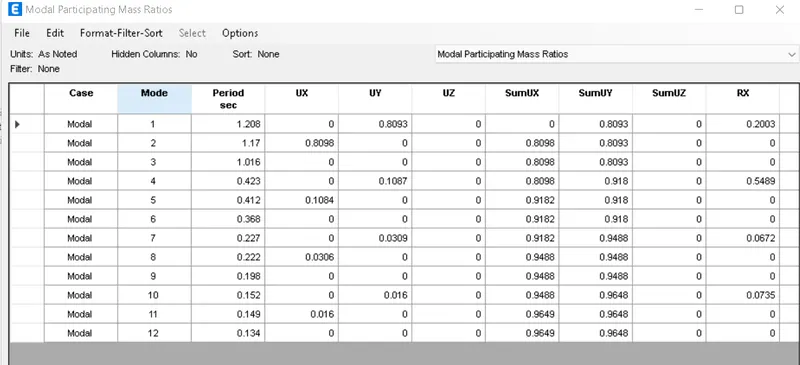
- modal mass participating ratio table
MODEL F
- given size of the beam 300 x 400
- size of the column 600 X 600
- no of storey 10
- height of the storey 3m
- height of the plinth 1.5m
- similar to the model A construct a structure as per the given data
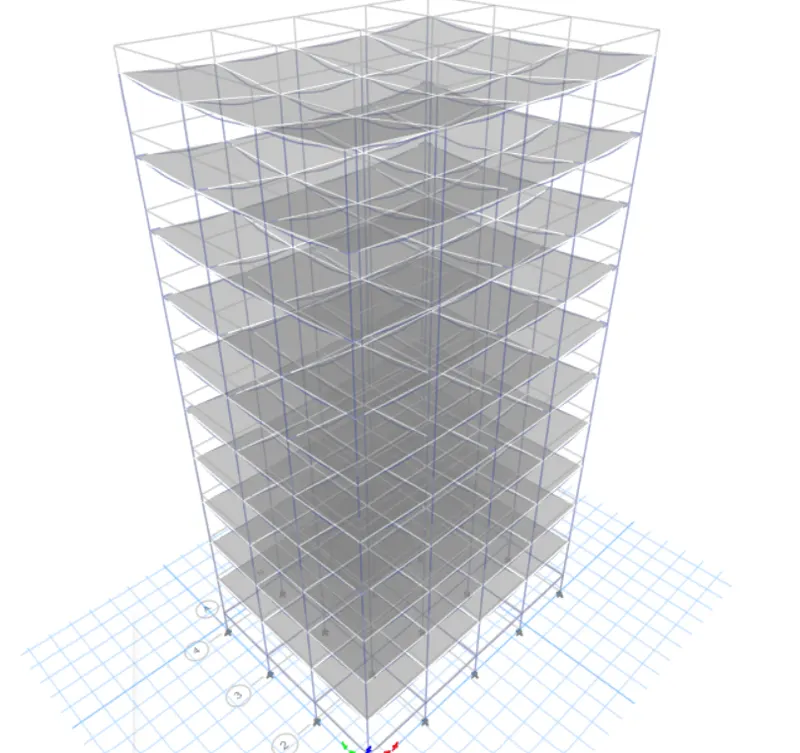
- and run analysis to view the deformations
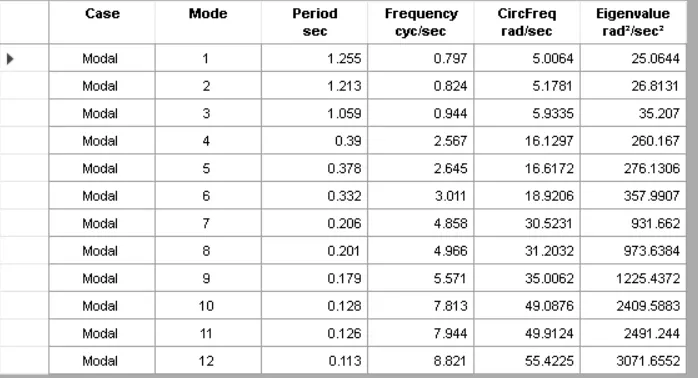
- modal periods and frequencies table
- modal mass participating ratio table
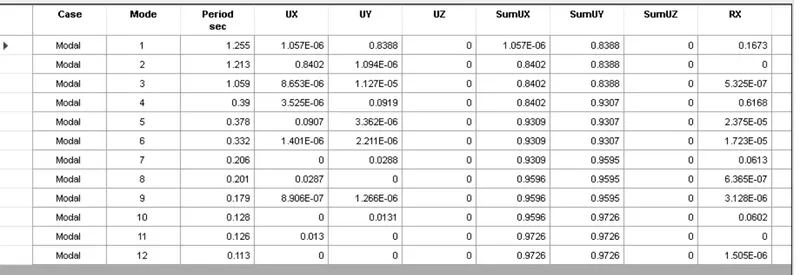
MODEL G
- given size of the beam 300 x 400
- size of the column 800 X 800 (from base to story 10)
- size of the column 600 x 600 (from story11 to story 20)
- size of the column 400 x 400 (from story21 to story 25)
- no of storey 25
- height of the storey 3m
- height of the plinth 1.5m
- similar to the model A construct a structure as per the given data
- and run analysis to view the deformations
firstly create a 25 story model with column size as 800 x 800 at all levels
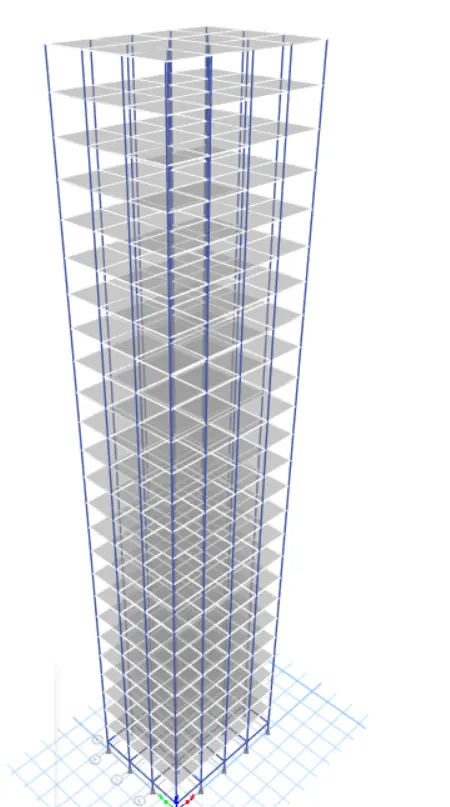
- select set building view limits from story11 to story 20
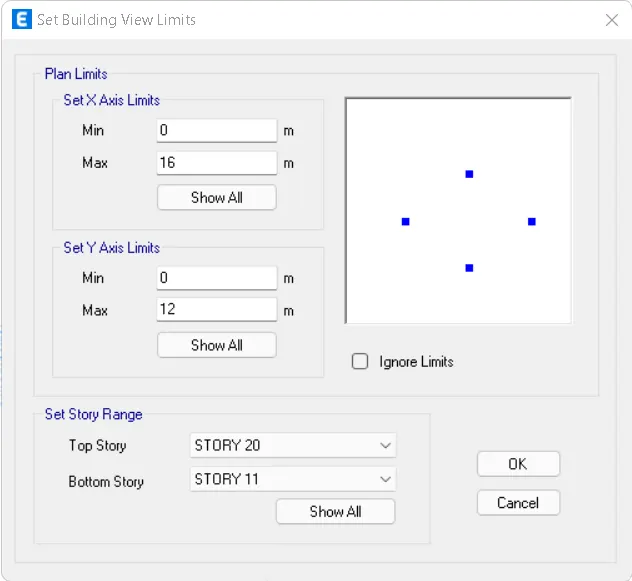
- then select all the columns
- go to assign >frame sections
- select the column size as 600x600
- click on OK
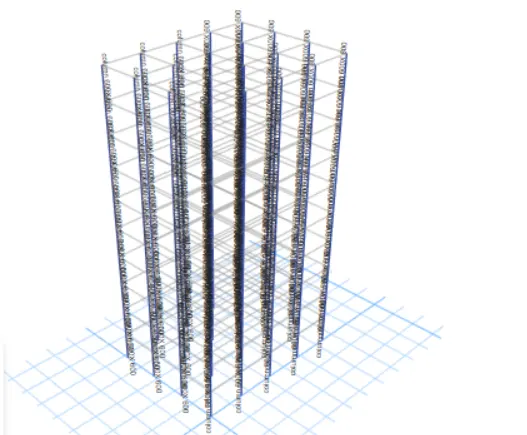
- similarly assign the column size as 400 x 400 for the top 5 storeys
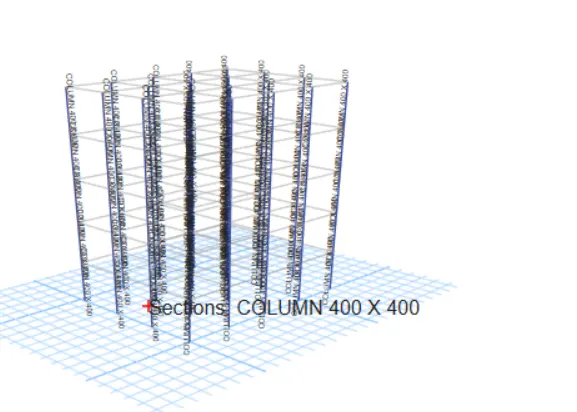
- ensure that the live loads and dead loads are assigned
- then select all the slab elements
- go to assign
- select shell> diaphragm
- then click on OK
- then save the model and run analysis to view the deformations
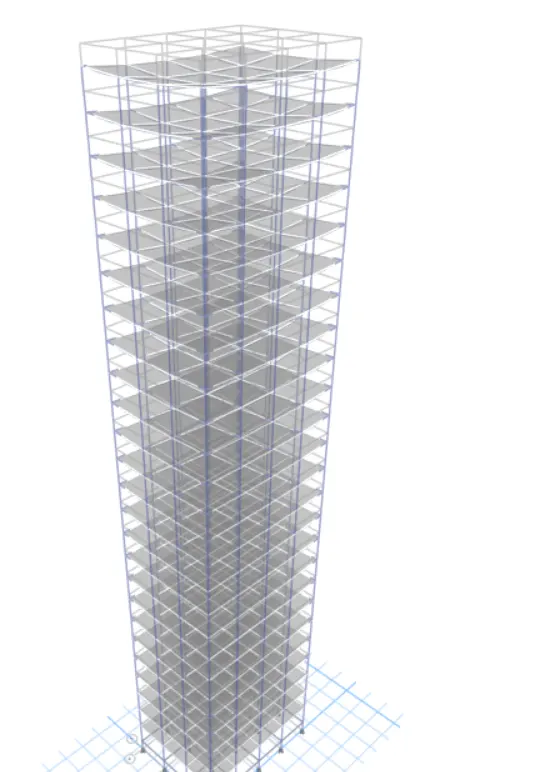
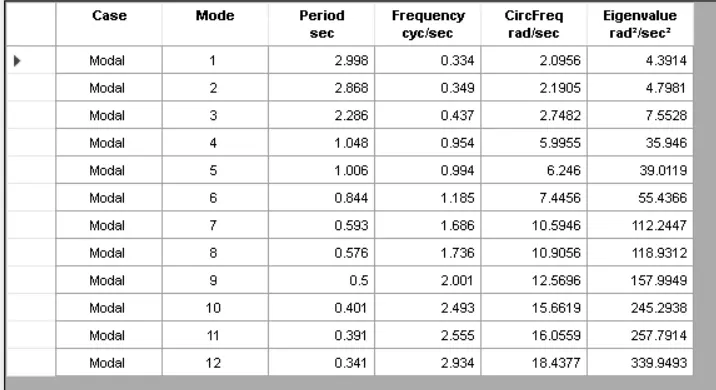
- modal periods and frequencies table
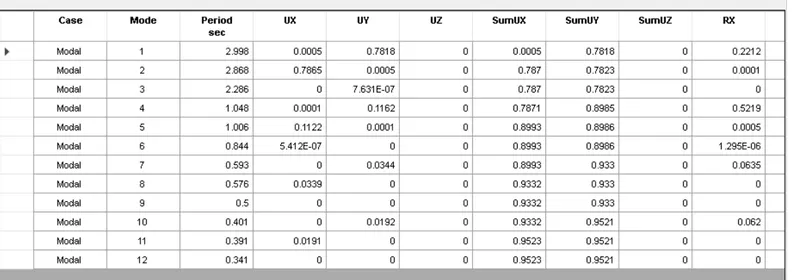
- modal mass participating ratio table
MODEL H
- given size of the beam 300 x 400
- size of the column 800 X 800
- no of storey 25
- height of the storey 3m
- height of the plinth 1.5m
- similar to the model A construct a structure as per the given data
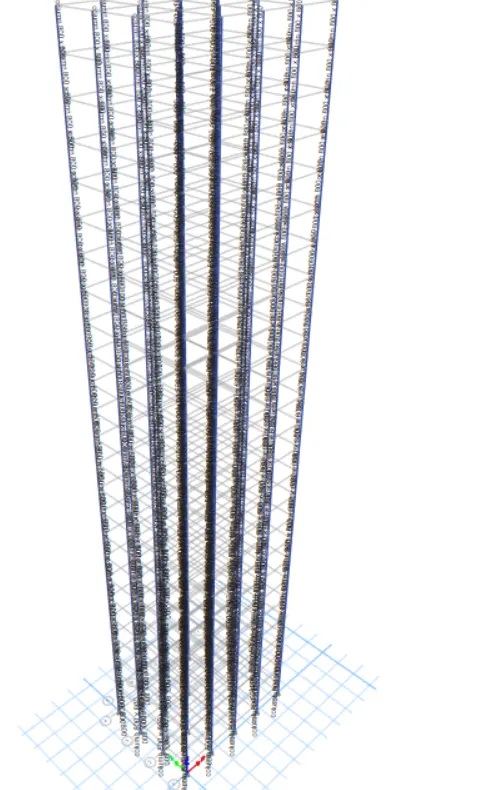
- and run analysis to view the deformations
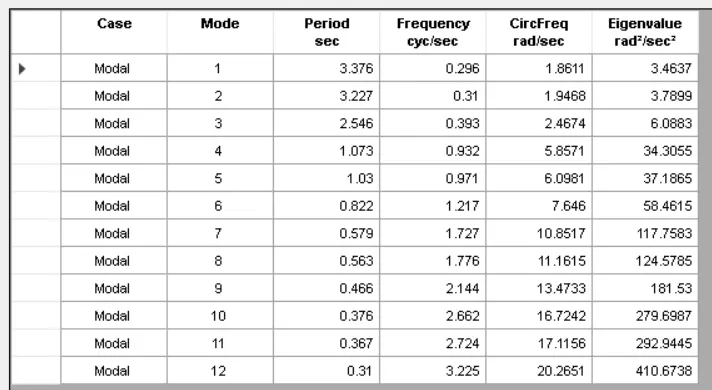
- modal periods and frequencies table
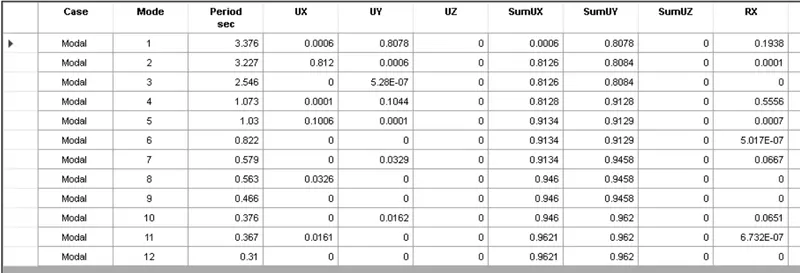
- modal mass participating ratio table
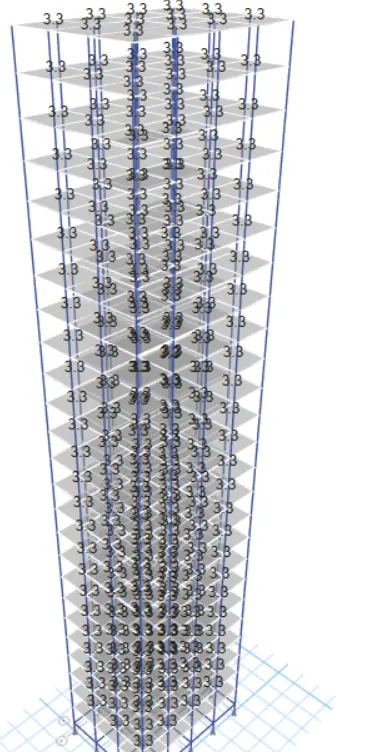
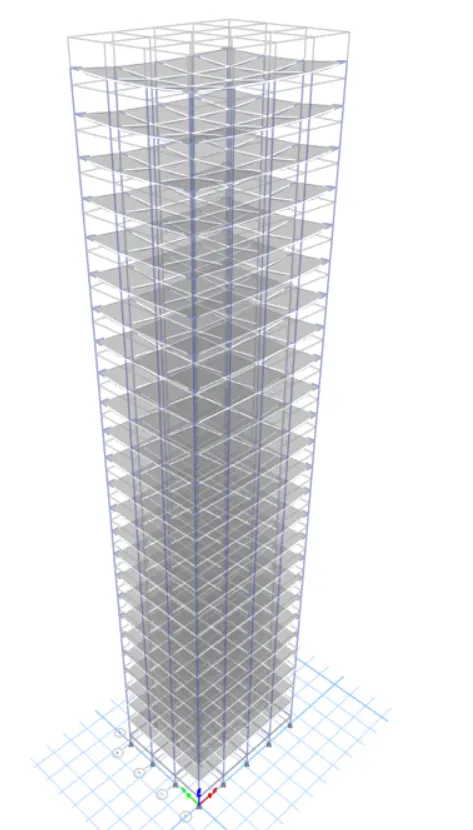
MODEL J
- given size of the beam 300 x 400
- size of the column 800 X 800
- no of storey 25 with imposed mass 10% larger than the model H
- height of the storey 3m
- height of the plinth 1.5m
- similar to the model A construct a structure as per the given data
- and run analysis to view the deformations
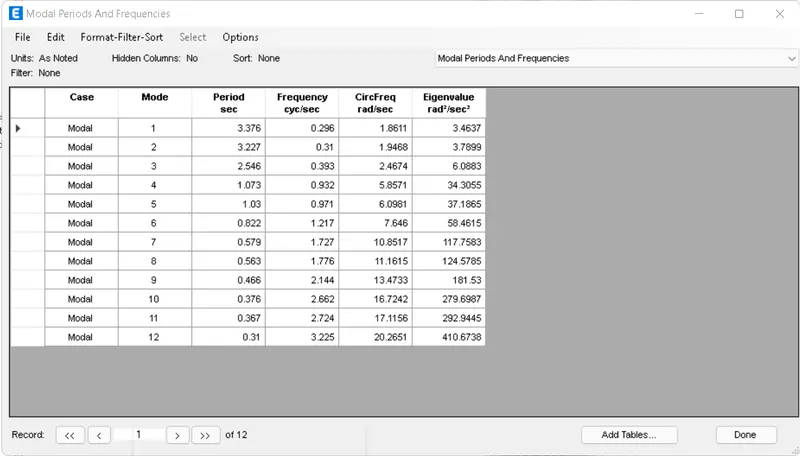
- modal periods and frequencies table
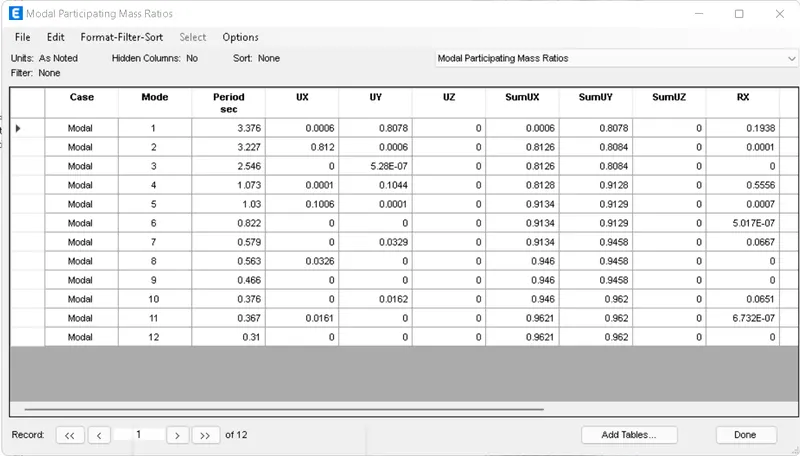
- modal mass participating ratio table
MODEL k
- given size of the beam 300 x 400
- size of the column 800 X 800
- no of storey 25 with imposed mass 20% larger than the model H
- height of the storey 3m
- height of the plinth 1.5m
- similar to the model A construct a structure as per the given data
- and run analysis to view the deformations
- modal periods and frequencies table
- modal mass participating ratio table
RESULTS:-
- EFFECT OF STIFFNESS ON TIME PERIOD
time period of building E with uniform column size is 1.208sec
time period of building F with varying column size is 1.25sec
Conclusion:- comparaing the time period of building E and F we can conclude that there is no effect of stiffnesss on time period
- EFFECT OF BUILDING HEIGHT ON TIME PERIOD
time period of the building A with 2 storey is 0.345s
time period of the building B with 5 storey is 0.714s
time period of the building F with 10 storey is 1.255s
time period of the building H with 25 storey is 3.37s
CONCLUSION:- we know that the height of the building is directly proportional to time period we can conclude that if height of the building increases time period also increases
- EFFECT OF COLUMN ORIENTATION ON TIME PERIOD
time period of the building B with column size 400 x 400 is 0.714S
time period of the building C with column size 550 x 300 is 0.789s
time period of the building D with column size 300 x 550 is 0.772s
CONCLUSION:- we can conclude that oientation of the columns influence the magnitude of lateral deformation
- EFFECT OF FLEXURAL STIFFNESS OF STRUCTURAL ELEMENTS ON MODE SHAPES(considering the building B)
flexural stiffness of the beams close to zero inertia (considering 5% of inertia) is 2.482s
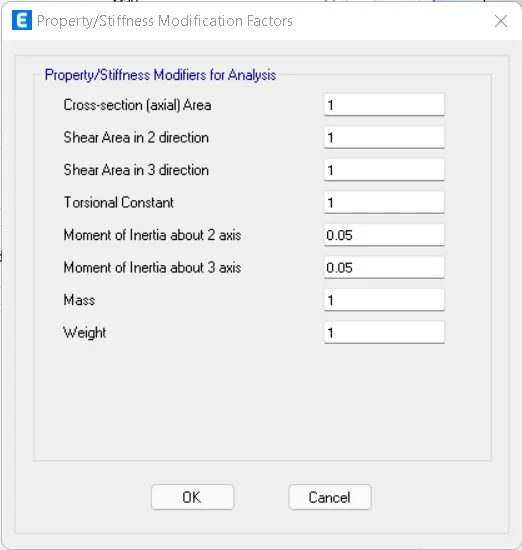
flexural stiffness of the beams with 100% of inertia is 0.741s
CONCLUSION:- inertia of the beams which influences the stiffness of the beam increases the time period
- EFFECT OF AXIAL STIFFNESS OF VERTICAL MEMBERS ON MODE SHAPES
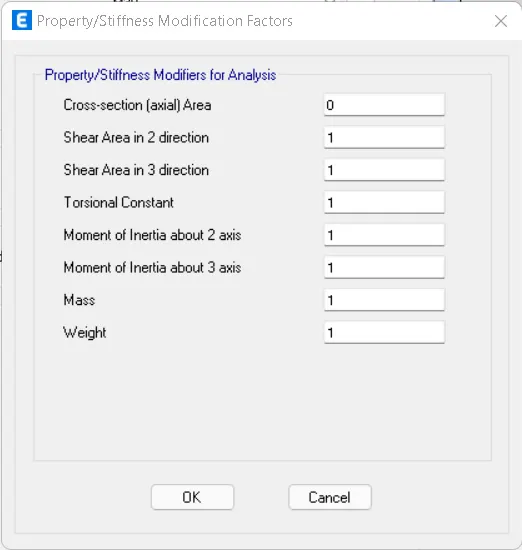
consideing the building H for example
time period of the building H (regular) is 3.37s
time period of the building H (with zero axial area) is 6.23s
EFFECT OF BASE OF FOUNDATION ON TIME PERIOD
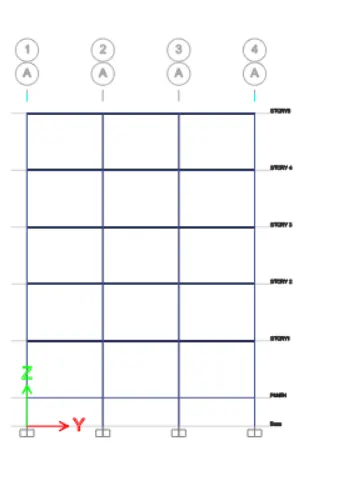
time peroid of building B with pinned supports is 0.741s
time period of the building B with fixed supports is 0.648s
CONCLUSION:- we can conclude that if the base of the structure is restrained the effect of time period on the mode point will be less