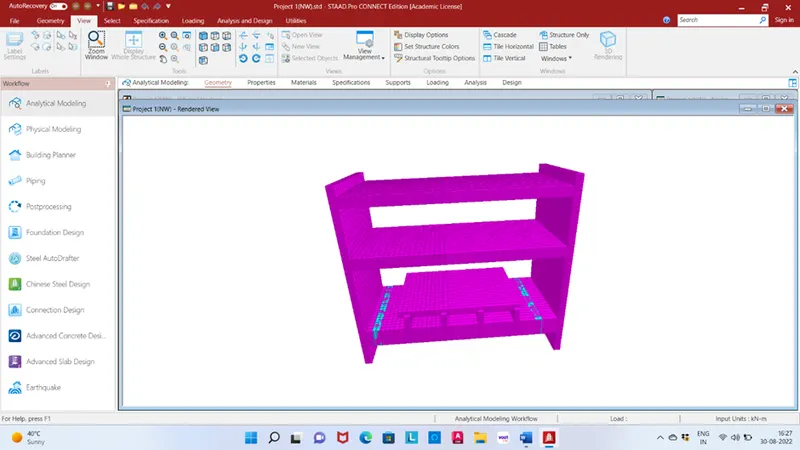
Project 1
Aim: Calculate the dead load, IRS live load, Earth pressure load, wind load and seismic loads for the bridge structure and applying these loads on STAAD Pro.
Given data:
Unit weight of soil = 18kN/m3
Location of the bridge = Ahmedabad
Wind load calculation as per IS 875
Seismic load calculation as per IS 1893
STAAD pro. Model is given
Theory:
Dead load: A constant load in a structure (such as a bridge, building) that is due to the weight of the member, the supported structure, and permanent attachments.
Unit weight of reinforced cement concrete=25KN/M3
Dead load of structure (KN) = unit weight X volume of structure (cross section of the structural X span length)
UDL of structure (KN/M) = Dead load of structure / span length
Live load: The simply supported structures shall be designed for one of the loading envelopes (Light, Medium or Heavy) tabulated in the Annexure I. The loading envelope chosen shall be as per the Rolling Stock planned to be used on the Metro system. Alternately, metro shall work out the EUDL chart for the actual train loads planned to be used and this EUDL chart shall be a part of the DBR.
Loads other than standard trains like track machines, cranes, any new rolling stock etc. which may come on this structure should be within the loading envelope initially decided by the metro as above.
For special structures like continuous structures, cable stayed bridges, etc the actual train loads may be used for design.
The various IRS loads for design of bridges includes
- Metro rail loading
- Broad gauge loading
- Electric train
- Gauge A and gauge B loading
Earth pressure: The lateral earth pressure is important because it affects the consolidation behaviour and strength of the soil and because it is considered in the design of geotechnical engineering structures such as retaining walls, basements, tunnels, deep foundations and braced excavations.
Soil report and borehole Drawing
- It is the report which contains detailed information about the soil layers present in the site and the various test results showing the shear strength c and ϕ parameters, N values and ground water table level.
- It is providing the Safe Bearing Capacity values based on the test conducted on soil samples.
- Borehole diagram is provided in the soil report.
- Borehole Diagram is the diagram which shows the type of soil layers variations with properties below ground level till the termination level of borehole.
- It indicates the ground water table level and RL of starting and ending of different types of soil present below ground level.
There are three types of earth pressures on the basis of the movement of the wall.
- Earth Pressure at rest.
- Active Earth Pressure.
- Passive Earth Pressure.
Earth Pressure at rest:
When the vertical structural member is rigid and unyielding, the soil mass is in a state of rest and there will be no deformations and displacement. The Earth pressure corresponding to this state is Earth Pressure at rest.
Active Earth Pressure:
When the vertical structural member moves away from the backfill, the soil mass expands and there is a decrease in pressure. The Earth pressure corresponding to this is state is called as Active Earth Pressure.
Passive Earth Pressure:
When the vertical structural member moves towards the backfill, the soil mass is compressed and the shear resistance developed towards the vertical member and there is increase in pressure. The Earth pressure corresponding to this state is called as Passive Earth Pressure.
Dry unit weight: It is defined as the weight of dry soil Ws per unit volume V.
Saturated unit weight: It is the ratio of weight of fully saturated soil Wsat to total volume V.
Submerged unit weight: It is equal to saturated unit weight minus unit weight of water.
Uplift pressure which is also known as hydrostatic uplift, is an upward pressure applied to a structure that has the potential to raise it relative to its surroundings.
Unit Weight of Soil is defined as the total weight of soil mass W per unit of total volume V.
Wind load is an important consideration when designing and building a barn or other structure. Wind load is the load, in pounds per square foot, placed on the exterior of a structure by wind. This will depend on:
- The angle at which the wind strikes the structure
- The shape of the structure (height, width, etc.)
Preventing wind damage involves strengthening areas where buildings could come apart. The walls, roof and foundation must be strong, and the attachments between them must be strong and secure. For a structure to resist hurricane and weak tornadic winds, it must have a continuous load path from the roof to the foundation -- connections that tie all structural parts together and can resist types of wind loads that could push and pull on the building in a storm. Depending on the location, a typical “wind load” is 80 mph or 16 lb/ft2. Wind loads are calculated as per IS 875-part III 2015 and it is provided the basic wind speed map of India.
Wind exerts three types of forces on a structure:
- Uplift load - Wind flow pressures that create a strong lifting effect, much like the effect on airplane wings. Wind flow under a roof push upward; wind flow over a roof pull upward.
- Shear load – Horizontal wind pressure that could cause racking of walls, making a building tilt.
- Lateral load – Horizontal pushing and pulling pressure on walls that could make a structure slide off the foundation or overturn.
Design wind speed Vz = Vb*K1*K2*K3*K4
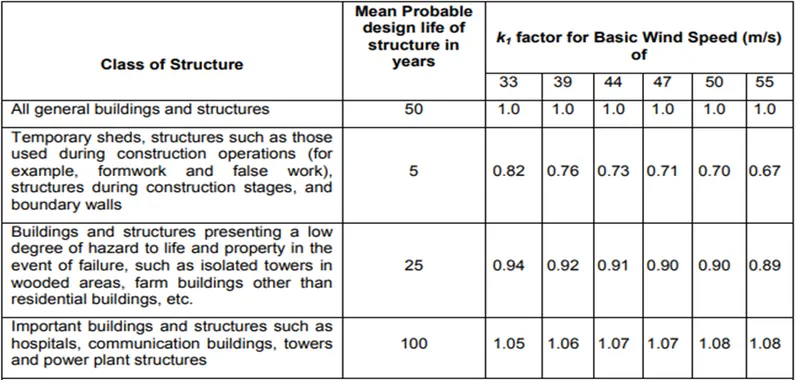
K1 = probability factor (risk coefficient)
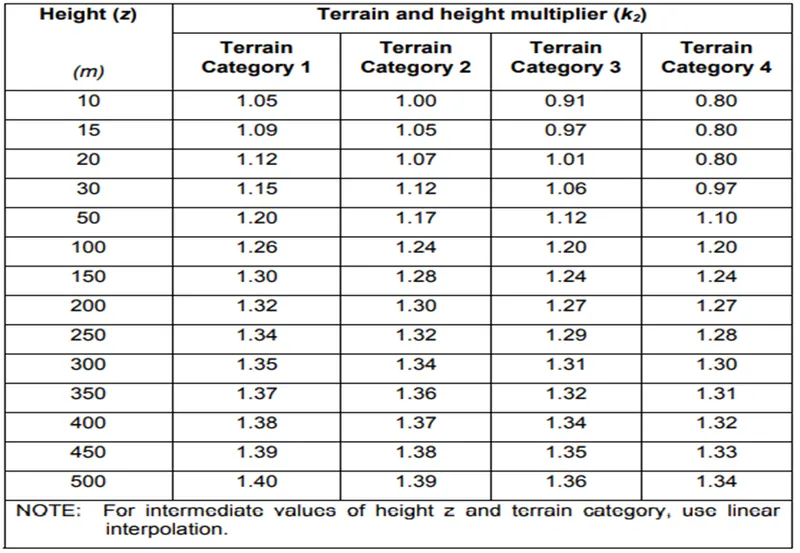
K2 = Terrain roughness and Height factor
K3 = Topography factor
K4 = Importance factor for the cyclonic region
Basic Wind speed zone of India
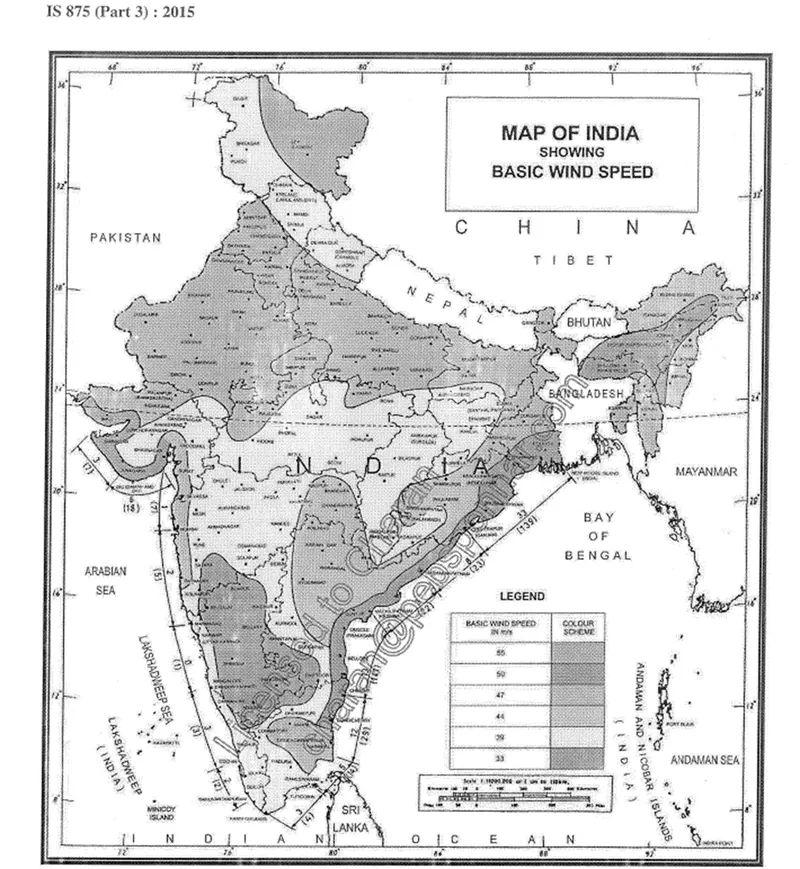
K1, K2, K3, K4 all are determined from IS code 875-part III 2015
Risk coefficient (k1 factor): This figure gives basic wind speed for terrain category 2 as applicable at 10m above ground level based on 50 years mean return period. The suggested life period to be assumed in design and the corresponding k1 factor for different class of structures for the purpose of design are given in Table. In the design of building and structures, a regional basic wind speed having a mean return period of 50 years shall be used except as specified in the note of table.
Terrain height factor (k2 factor): Terrain in which a specific stand shall be assessed as being one of the following terrain categories.
- Category 1 – Exposed open terrain with a few or no obstructions and in which the average height of any object surrounding the structure is less than 1.5 m. NOTE – This category includes open sea coasts and flat treeless plains.
- Category 2 – Open terrain with well-scattered obstructions having height generally between 1.5 and 10 m. NOTE – This is the criterion for measurement of regional basic wind speeds and includes airfields, open parklands and undeveloped sparsely built-up outskirts of towns and suburbs. Open land adjacent to seacoast may also be classified as Category 2 due to roughness of large sea waves at high winds.
- Category 3 – Terrain with numerous closely spaced obstructions having the size of building-structures up to 10 m in height with or without a few isolated tall structures. The equivalent aerodynamic roughness height, (z0.3) for this terrain is 0.2m. this category represents well wooded areas, and shrubs, towns and industrial areas full or partially developed. It is likely that the, next higher category than this will not exist in most design situations and that selection of more severe category will be deliberate.
- Category 4 – Terrain with numerous large high closely spaced obstructions. This category includes large city centres, generally with obstructions taller than 25 m and well-developed industrial complexes.
Topography (k3 factor): The basic wind speed Vb given in Figure takes account of the general level of site above sea level. This does not allow for local topographic features such as hills, valleys, cliffs, escarpments, or ridges, which can significantly affect the wind speed in their vicinity. The effect of topography is to accelerate wind near the summits of hills or crests of cliffs, escarpments or ridges and decelerate the wind in valleys or near the foot of cliffs, steep escarpments, or ridges.
Importance Factor for Cyclonic Region (k4): Cyclonic storms usually occur on the east coast of the country in addition to the Gujarat coast on the west. Studies of wind speed and damage to buildings and structures point to the fact that the speeds given in the basic wind speed map are often exceeded during the cyclones. The effect of cyclonic storms is largely felt in a belt of approximately 60 km width at the coast. In order to ensure greater safety of structures in this region (60 km wide on the east coast as well as on the Gujarat coast), the following values of k4 are stipulated, as applicable according to the importance of the structure:
- Structures of post–cyclone importance for emergency services (such as cyclone shelters, hospitals, school, communication towers, etc) 1.30
- Industrial structures 1.15
- All other structures 1.00
Wind pressure: The wind pressure at any height above mean ground level ground level shall be obtained by following relationship between wind pressure and wind speed.
Pz = 0.6*
Where
Pz = Wind pressure at height z in N/sqm
Vz = Design wind speed at height z in m/s
The design wind speed pressure Pd can be obtained as,
Pd = Kd*Ka*Kc*Pz
Where
Kd = wind directionality factor (1.0 for circular, semi-circular and 0.9 for rectangular, square etc)
Ka = Area averaging factor (actual area exposed to wind)
Kc = combination factor (0.9 is considered per IS 875 which is recommended value) we will now these equations for the calculation of wind load on our structure.
Seismic load
Seismic loading is one of the basic concepts of earthquake engineering which means application of a seismic oscillation to a structure. It happens at contact surfaces of a structure either with the ground or with adjacent structures. Seismic loading depends, primarily on seismic hazard, geotechnical parameters of the site, and structure's natural frequency etc.
There are horizontal and vertical components of earthquake ground motions, but the horizontal component of earthquake ground motion is the main cause of bridge damages. Where both horizontal and vertical seismic forces are taken into account, load combination specified in shall be considered.
- ± ELx ± 0.3ELỵ ± 0.3ELz,
- ± 0.3ELx ± 0.3ELỵ ± ELz,
- ± 0.3ELx ± ELỵ ± 0.3ELz,
Percentage increase in net bearing pressure and skin friction of soil.
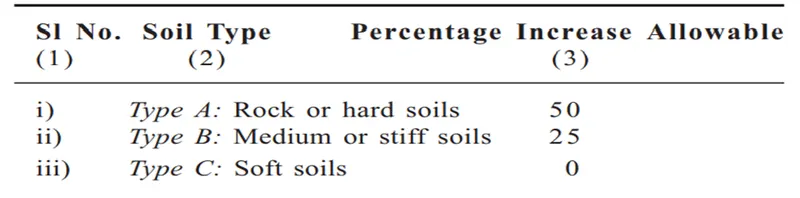
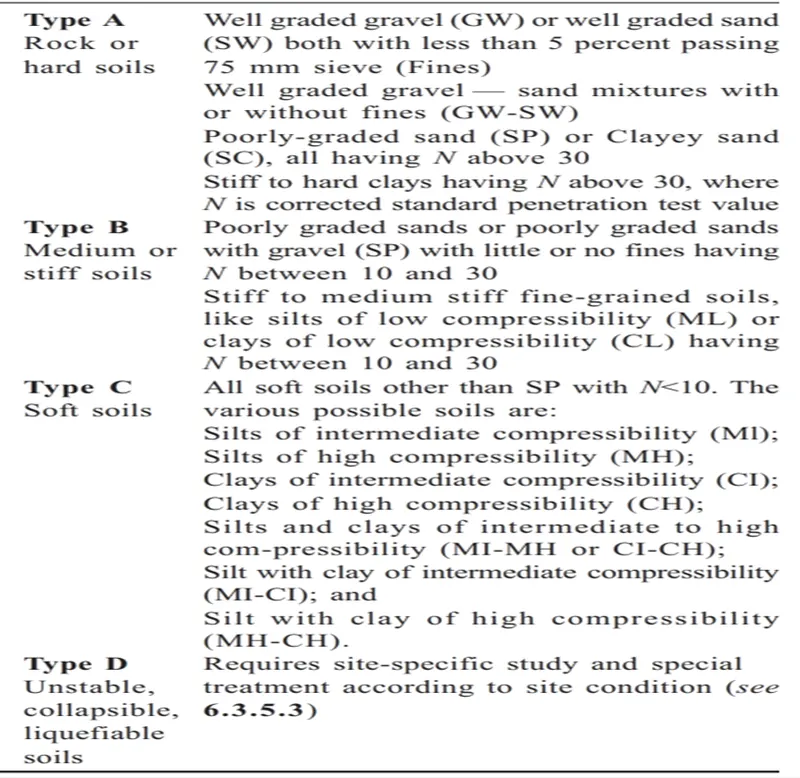
Classification of types of soils for determining percentage increase in net bearing pressure and skin friction
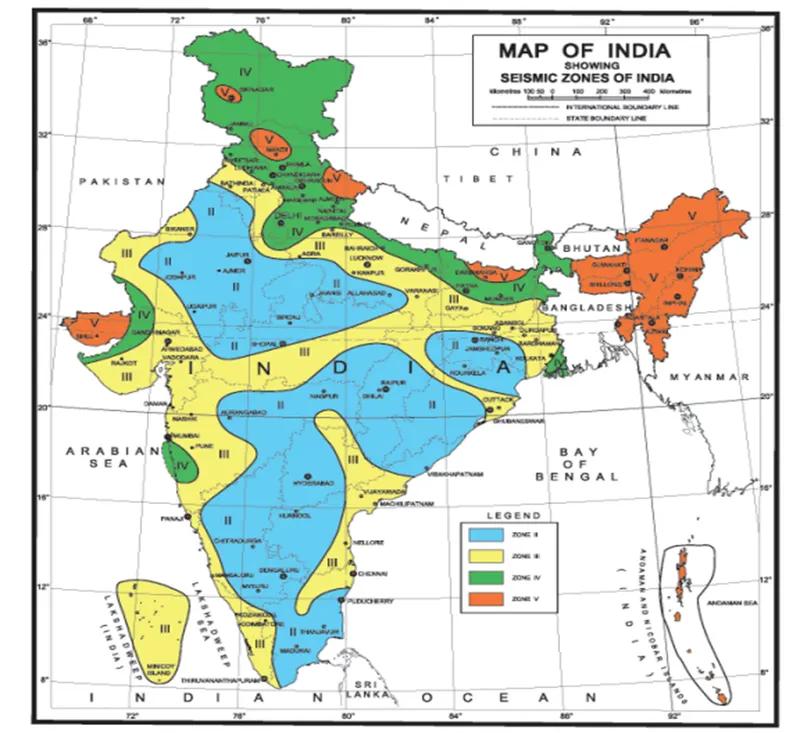
Seismic zone
|
Seismic zone factor |
II |
III |
IV |
V |
|
Z |
0.10 |
0.16 |
0.24 |
0.36 |
Calculation:
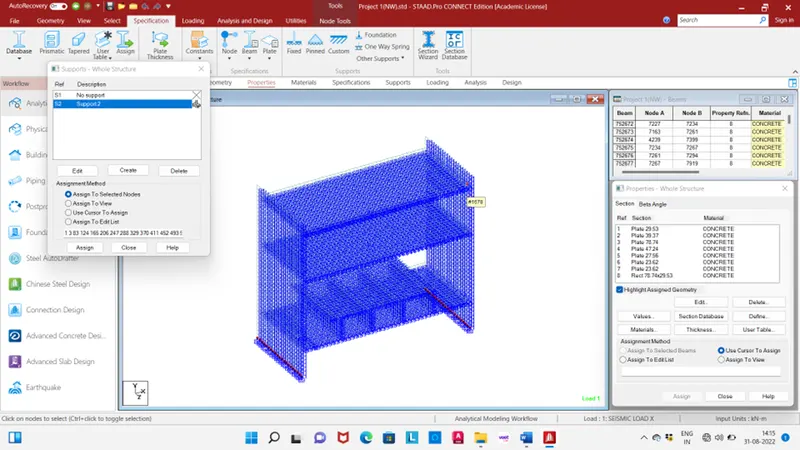
Model is given and, in this model, uses plate and beam element. Section of beam are given and thickness of plate are given.
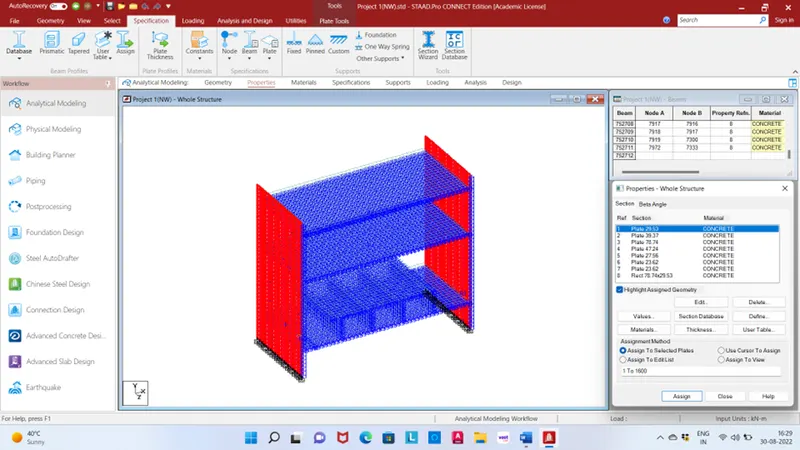
In the foundation fixed support are given in model.
Seismic load:
Go to the definition and defined seismic load by IS: 1893-2016 fill all data city Ahmedabad, Response reduction factor RC buildings with special moment resisting, importance factor important building.
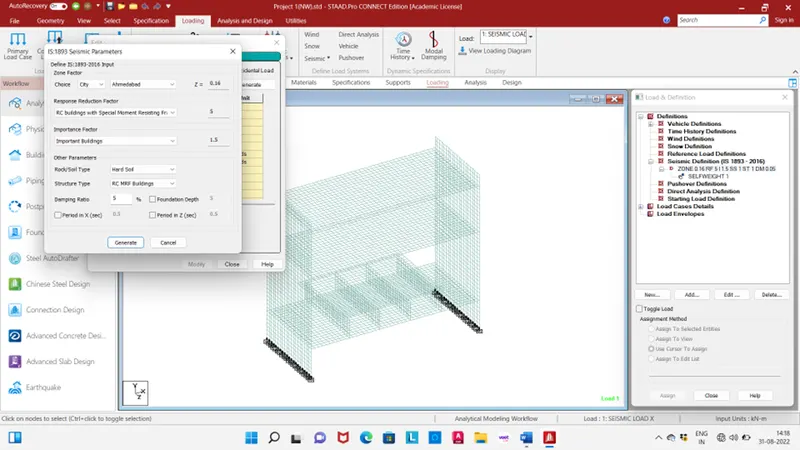
In the seismic load definition load due to self-weight of structure.

Seismic load case details, loading type seismic H, title seismic load X.

Then Factor and direction will be defined factor 1 and direction X.

Seismic load case details, loading type seismic V, title seismic load Y.

Then Factor and direction will be defined factor 1 and direction Y.

Seismic load case details, loading type seismic H, title seismic load Z.
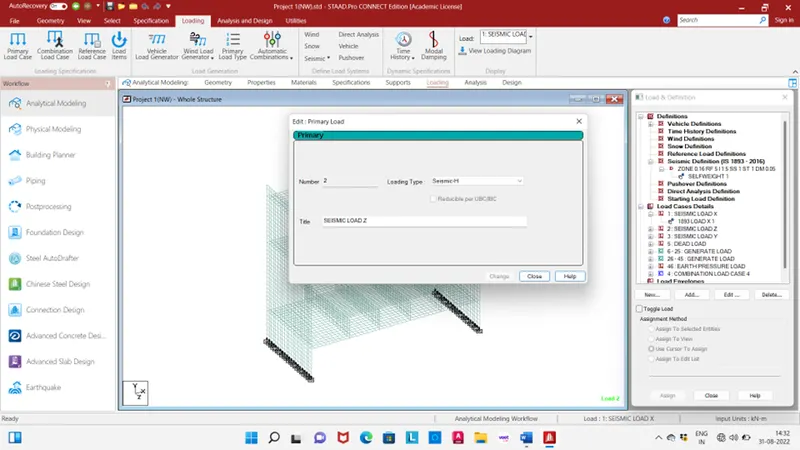
Then Factor and direction will be defined factor 1 and direction Z.

Dead load:
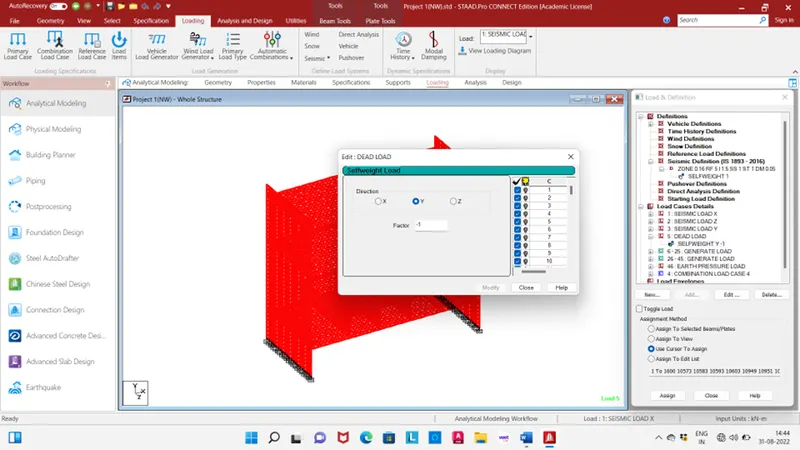
Load case details for dead load

Dead load due to self-weight in Y direction factor -1.
IRS vehicles load:
Vehicles load definition width of vehicles 1m, load and distance 170kN-2.15m, 170kN-2.2m, 170kN-12.4m, 170kN-2.15m, 170kN-2.2m.

No. of load generation = length of model /load increment, hence
= 10/0.5
= 20

Define load generation initial position of load x=2.5, y=3.5, z=0 range Z=10 increment in Z direction 0.5

No. of load generation = length of model /load increment, hence
= 10/0.5
= 20
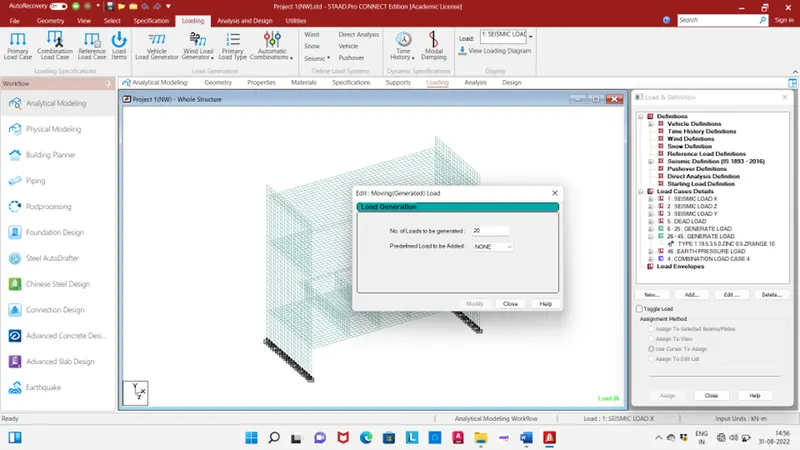
Define load generation initial position of load x=19.5, y=3.5, z=0 range Z=10 increment in Z direction 0.5

Earth pressure load:
Load due to earth pressure acting on structure = ka(ɣ)h
= 0.33*18*20
=118.8kN/m
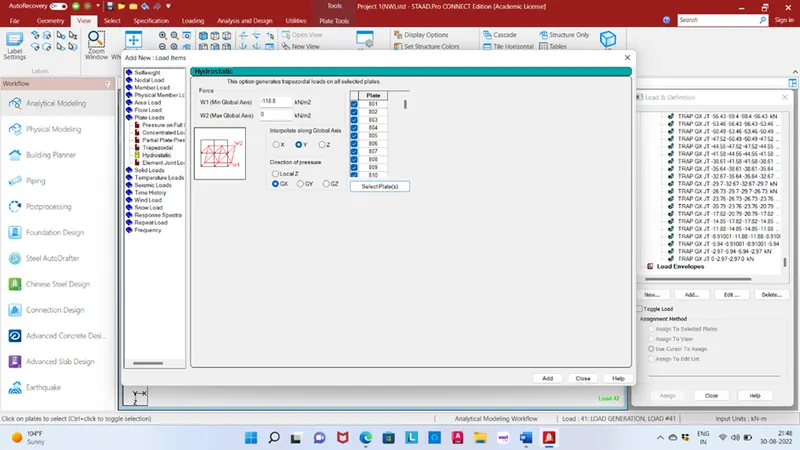
The earth pressure applied in this model. In global X direction both side 118.8kN/m and -118.8kN/m select plate and assigned it.
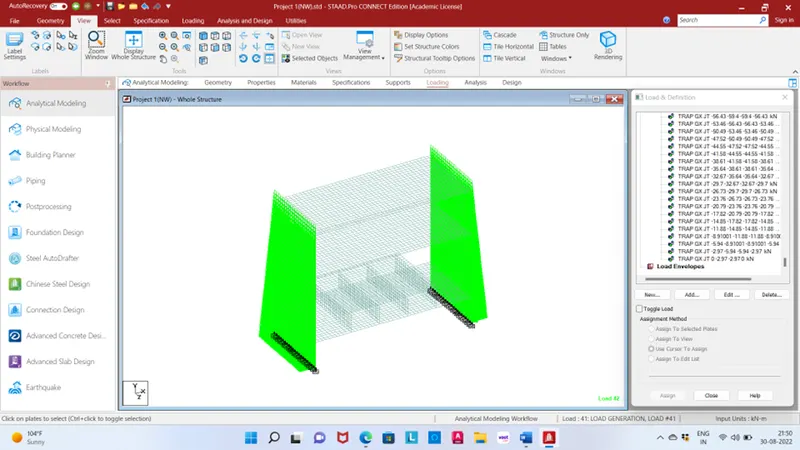
Wind load:
Wind load will be applied when the structure above the ground level but hear structure below the ground level hence wind load not applied.
Go to run and analysis and design and run it.
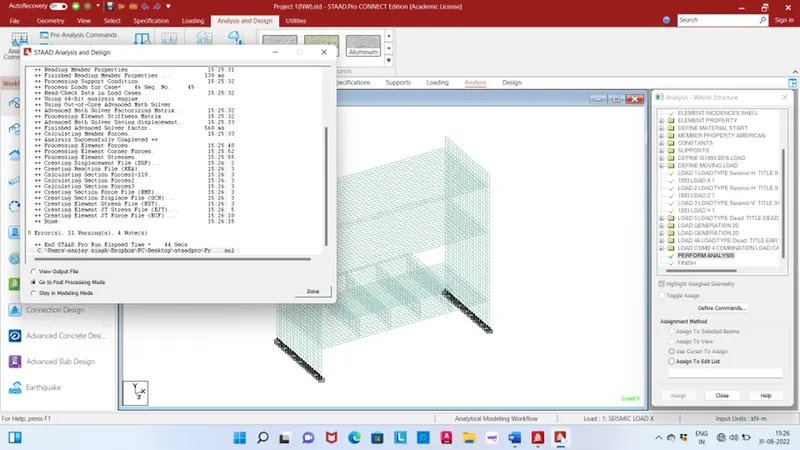
Result:
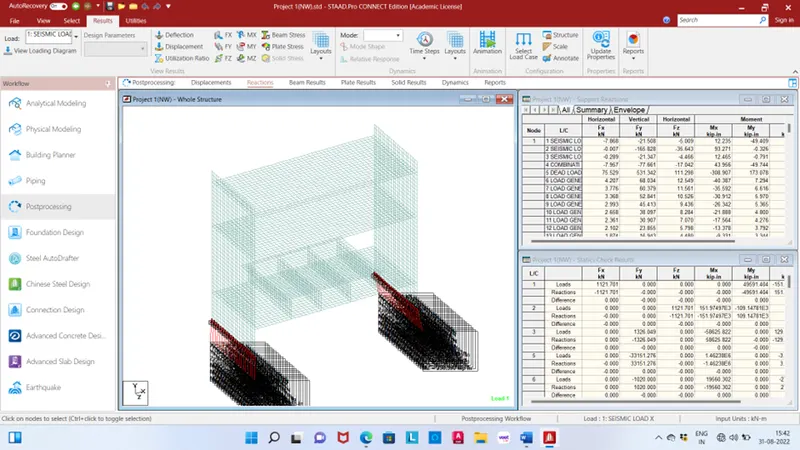
Rection: Rection of support go to the summery and check all rection of the support.
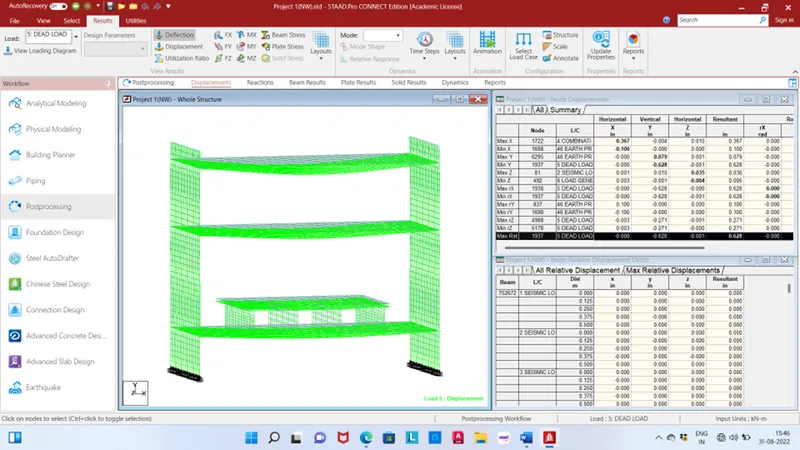
Displacement: Displacement of member go to summery and check all direction maximum and minimum deflection.
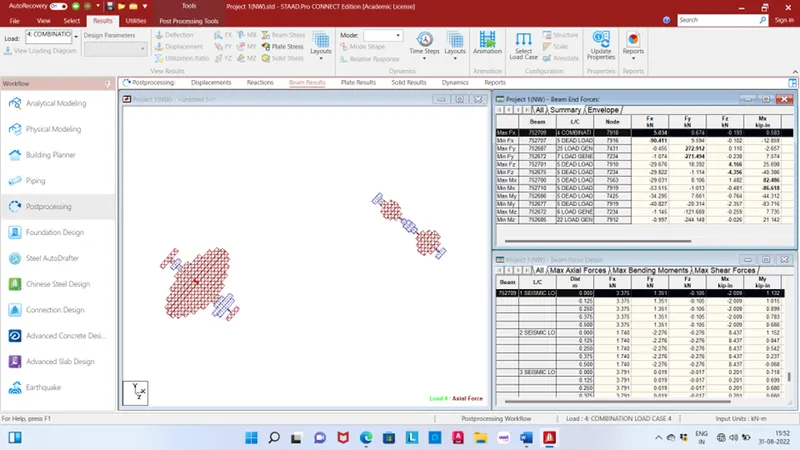
Beam:
Maximum axial force in X direction max. 5.034kN load case no. 4 load combination of seismic load X, Y, Z.
Minimum axial force in X direction max. -90.411kN load case no. 5 Dead load.
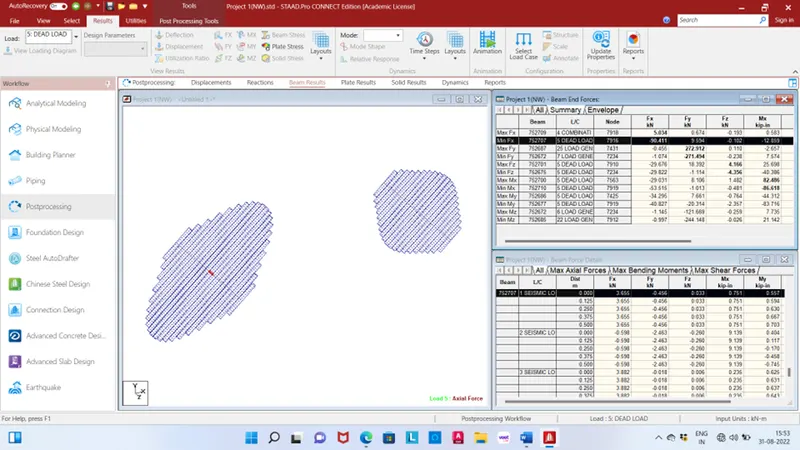
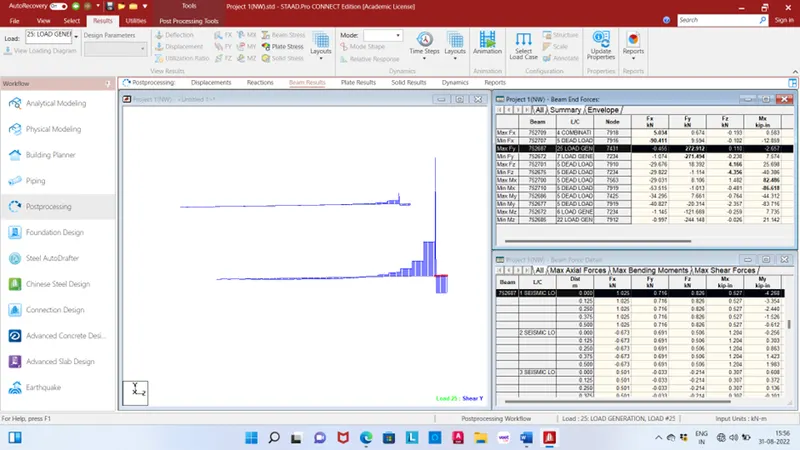
Maximum shear Y direction is 272.912kN for load case no. 25 load generation.
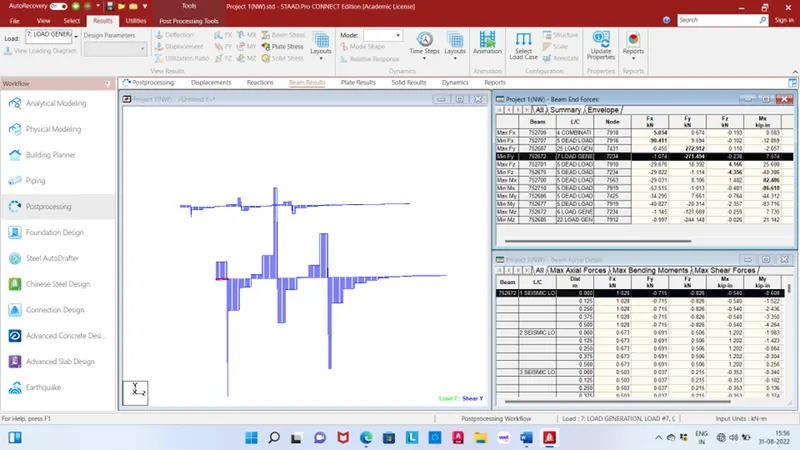
Minimum shear Y direction is -271.494kN for load case no. 7 load generation.
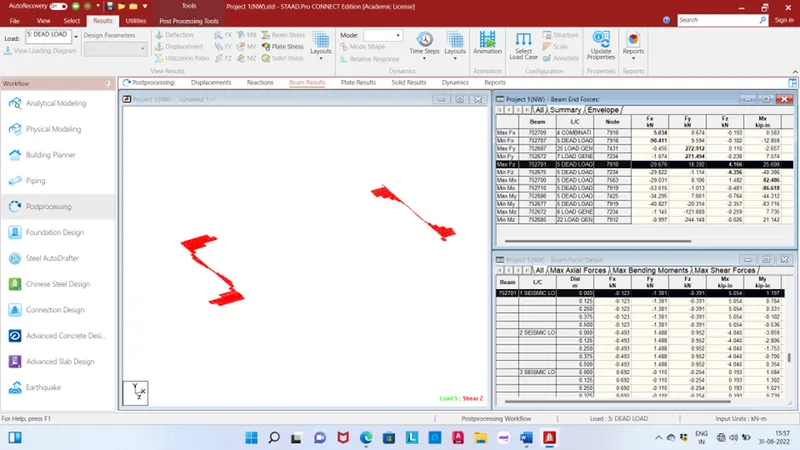
Maximum shear Z direction is 4.166kN for load case no. 5 Dead load and min. shear Z direction is -4.356kN for load case no. 5 dead load.
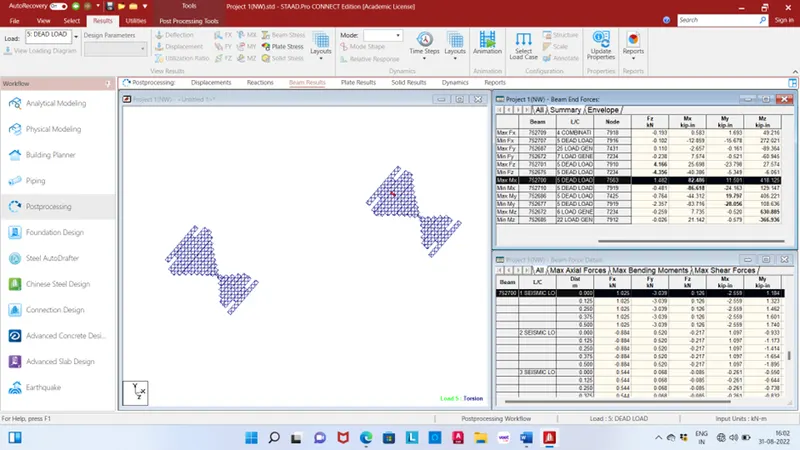
Maximum and minimum torsion in X Direction is 82.486kip-in and -86.618kip-in for load case no. 5 dead load.
Maximum bending in Z direction is 630.885kip-in for load generation no.6.
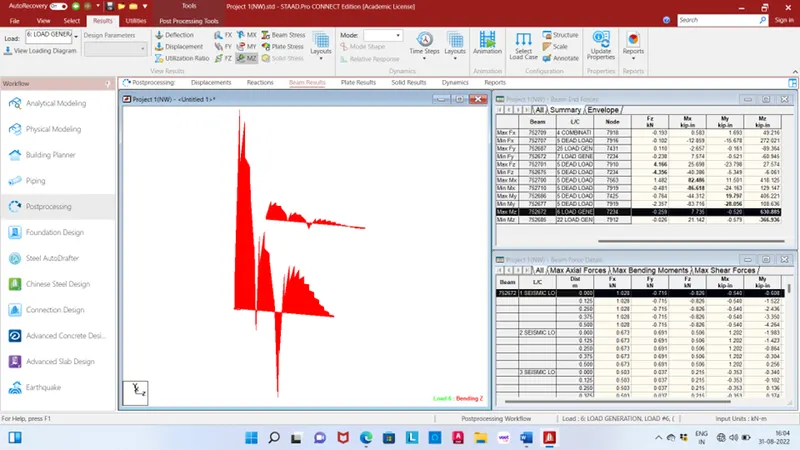
Minimum bending in Z direction is -366.936kip-in for load generation no.22.
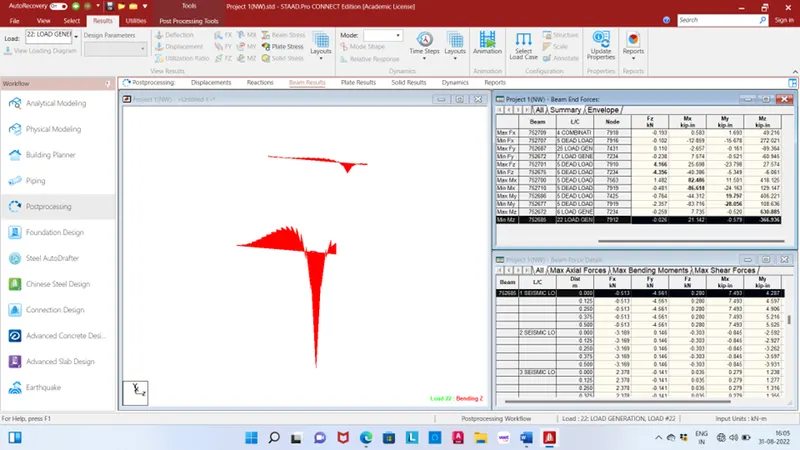
Maximum and minimum bending in Y Direction is 19.797kip-in and -28.056kip-in for load case no. 5 dead load.
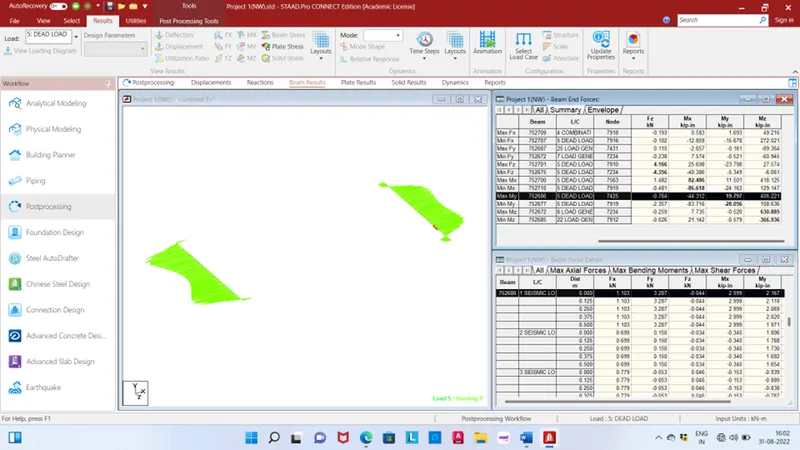
Plate:
Maximum and minimum plate in X direction bending is 453.896kip-in/in and -454.568kip-in/in for load case no 5 dead load.
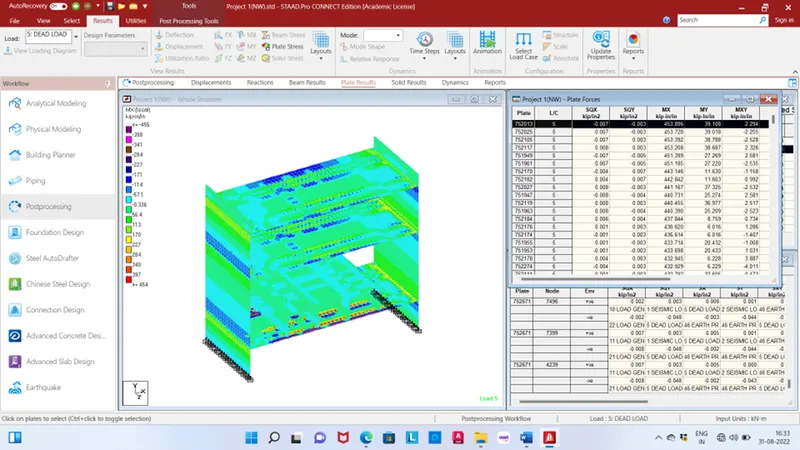
Maximum and minimum plate bending in Y direction is 454.621kip-in/in and -221.773kip-in/in for load case no 5 dead load.
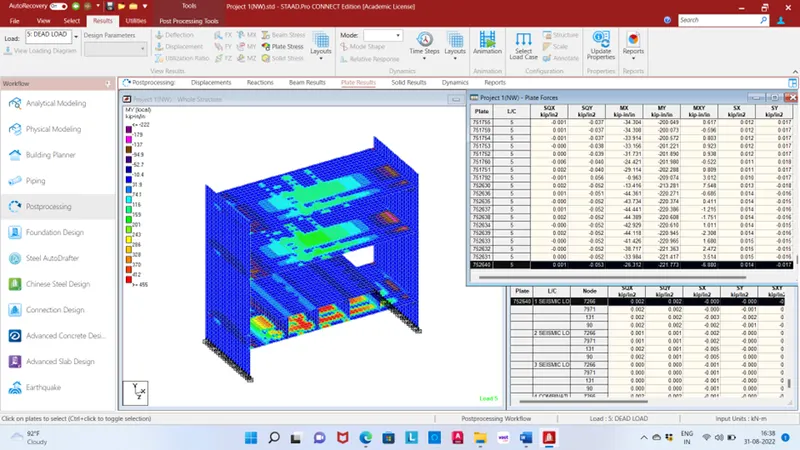
3D VIEW: