Project 1
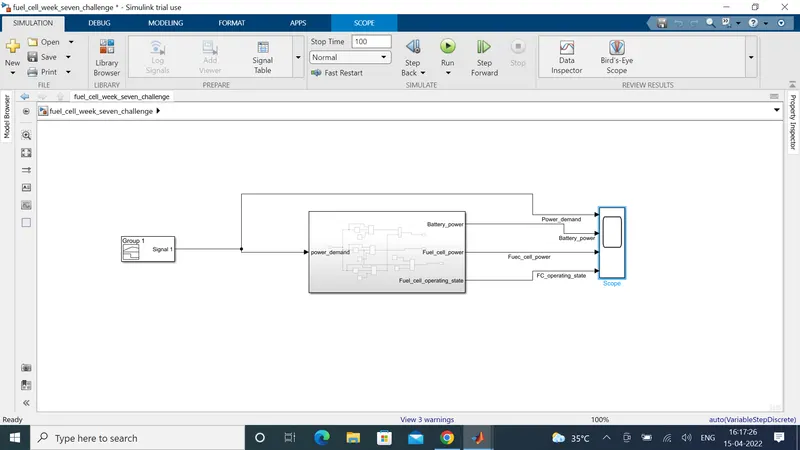
Simulink model for the flowchart
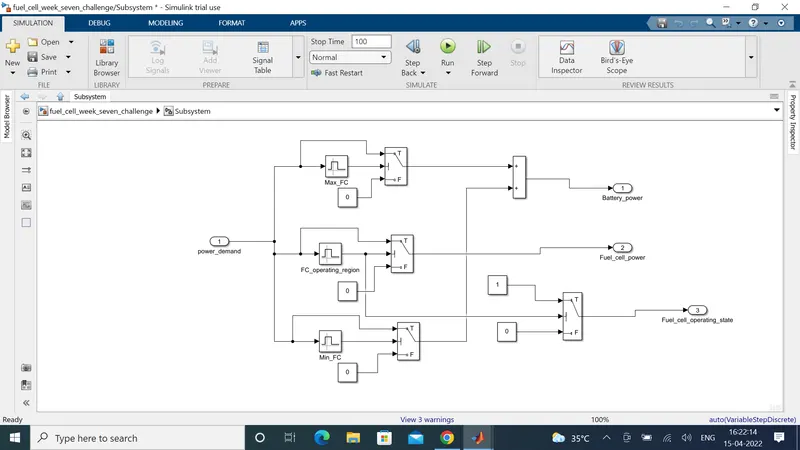
Subsystem model
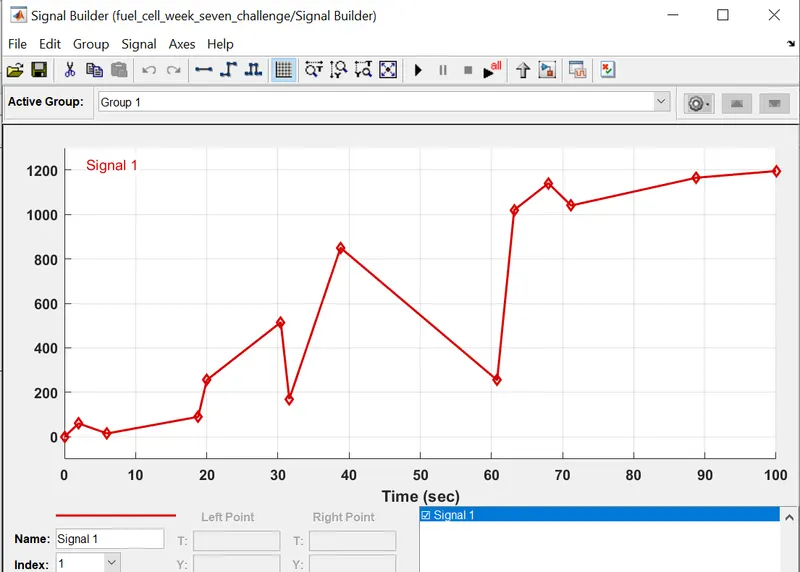
The power demand for the vehicle is created by using a signal builder as shown below
The output obtained as graph is shown below
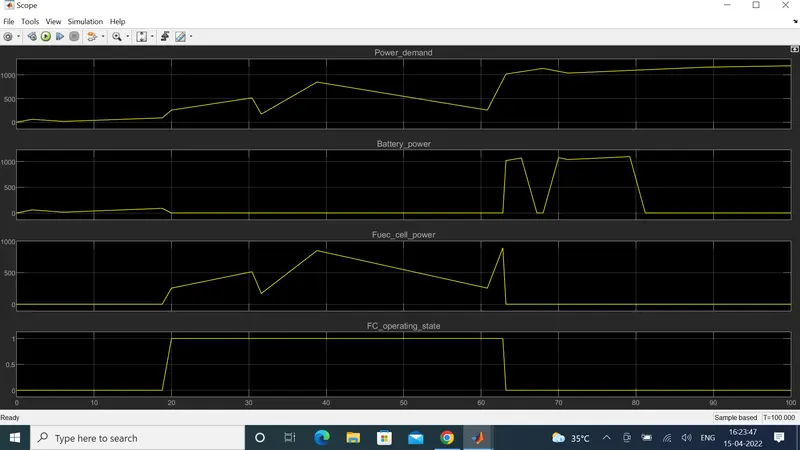
It is clear from the graph that whenever the power demand is above 1000 or below 100 the battery will supply the demand and whenever the demand is between 100 to 1000 the fuel cell will supply the power demand. The state of fuel cell is also shown as 1 and 0 for onn and off. It is understood that whenever the battery supplies the demand the fuel cell is standstill and whenever the fuel cell supplies the demand the battery is standstill.