Week 7 State of charge estimation
1. BMS Model
A Battery Management System (BMS) is an electronic system that manages a rechargable battery pack by protecting the battery from operating outside safe operating region, monitoring its state, calculating the datas, reporting those datas and controlling its environment. The BMS is responsible for battery life under diverse charge discharge condition.
The main datas which are to be maintained while designing a BMS are as follows
1. Cell voltage
2. Temperature
3. State of charge
4. State of health
5. Charging profile
The simulink model of BMS is shown below.
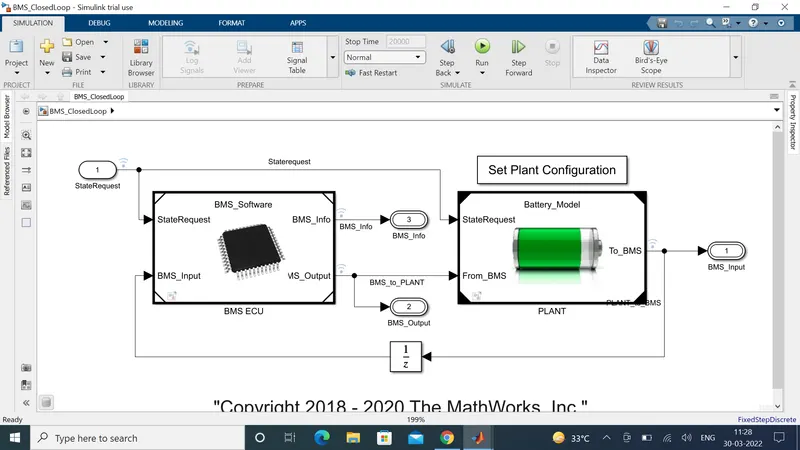
The BMS model consists of a BMS ECU(Electronic control Unit) and a battery plant.
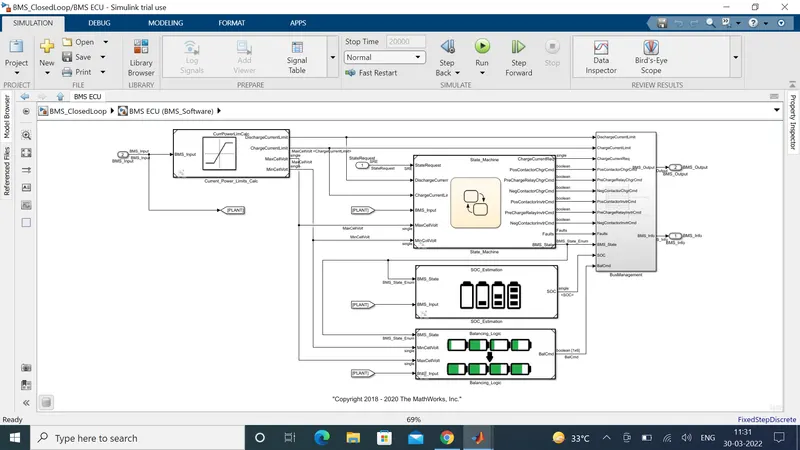
This is the BMS subsystem and it consists of
1. Current power limits
2. State machine
3. SOC estimation
4. Balancing logic
State machine defines the main operating states of BMS
The first state defines the variable BMS state which indicates standby, driving, charging and fault
The second state switches the fault state ON in case a current, voltage or temperature value reaches an unsafe level
The third and fourth state defines the contactor ON and OFF switching sequence for charger and inverter.
Simulating test cases from harness dash board
FIRST TEST SEQUENCE:
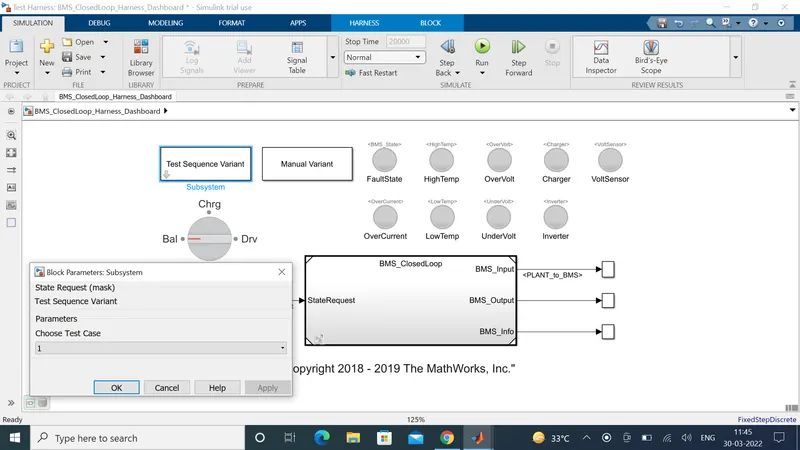
First test sequence variant is selected from harness dashboard and the model is simulated
The simulation result for the first test sequence is shown below
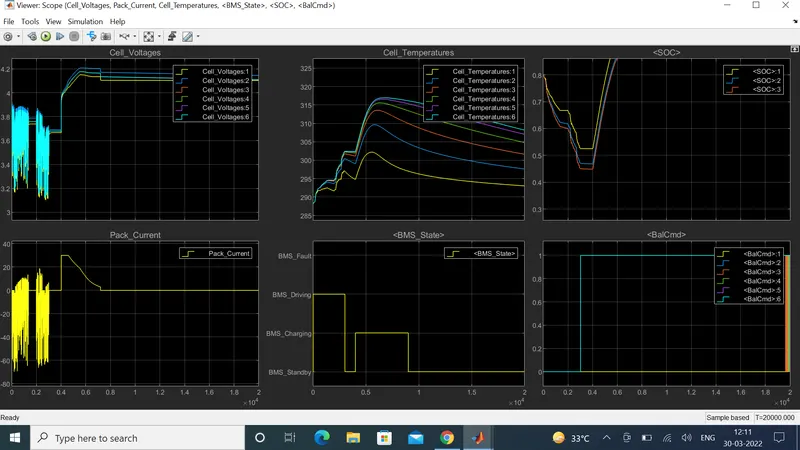
From the graph it is understood that as the BMS is in driving state the cell voltage and the pack current are varying according to the drive cycle and the temperature of all the cells are increasing. The temperature difference between the cells must be very less to avoid cell damage.
Usually centre cell will have high temperature and the outer cells have less temperature. So the cell balancing must be done to keep the temperature difference as low as possible.
When the BMS is in charging state the voltage and current rises based on constant voltage and constant current charge method.
The SOC increases from 0.4 as the BMS is in charging state.
Once the BMS is in standby mode all the cell voltage have a constant value of their nominal voltage, the temperature starts decreasing and the SOC is at constant.
SECOND TEST SEQUENCE
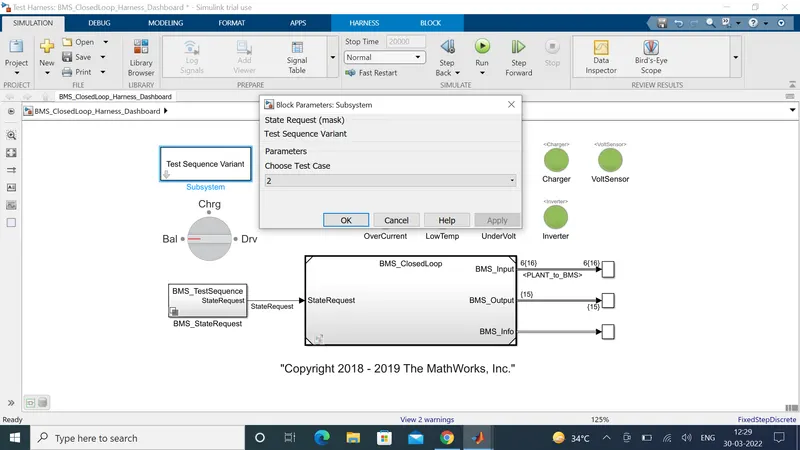
The simulation result for second test sequence is shown below
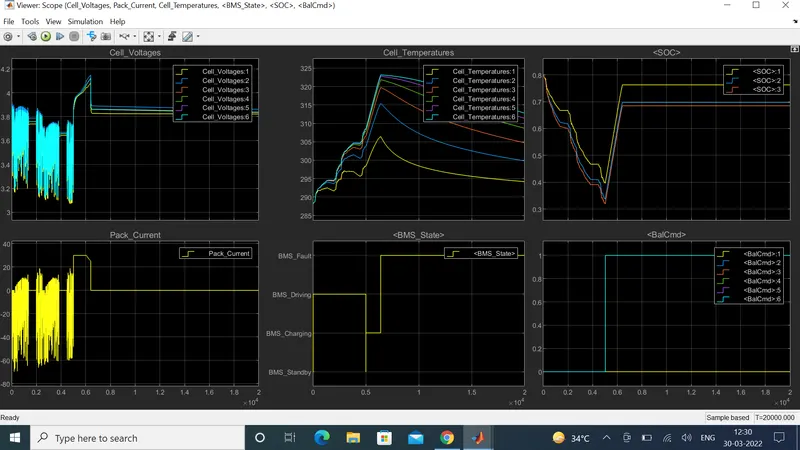
From the graph it is understood that
When the BMS is in driving mode the battery pack voltage and current increases according to its drive cycle, the cell temperatures increases and the SOC decreases.
Once the BMS is transfering from driving to Fault state all the temperature starts decreasing and the voltage is increasing because of constant voltage charging and the current also increases.
Once the fault state has reached the current becomes zero and the voltage falls back to its nominal voltage and all the cell temperature starts decreasing.
THIRD TEST SEQUENCE
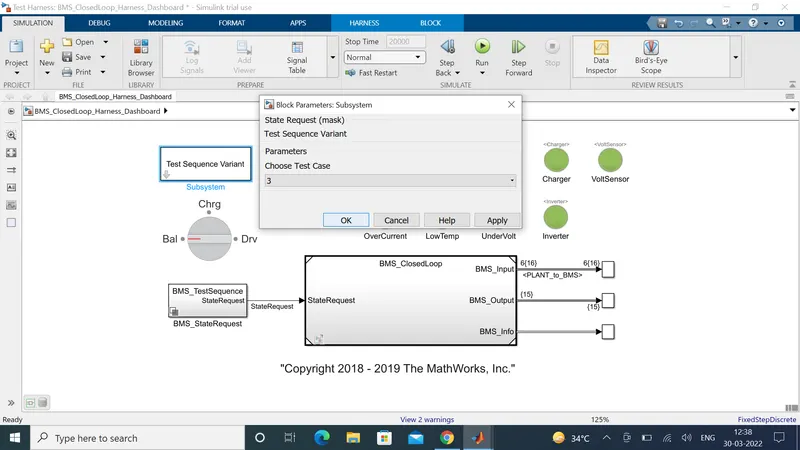
The simulation results for the third test sequence is shown below
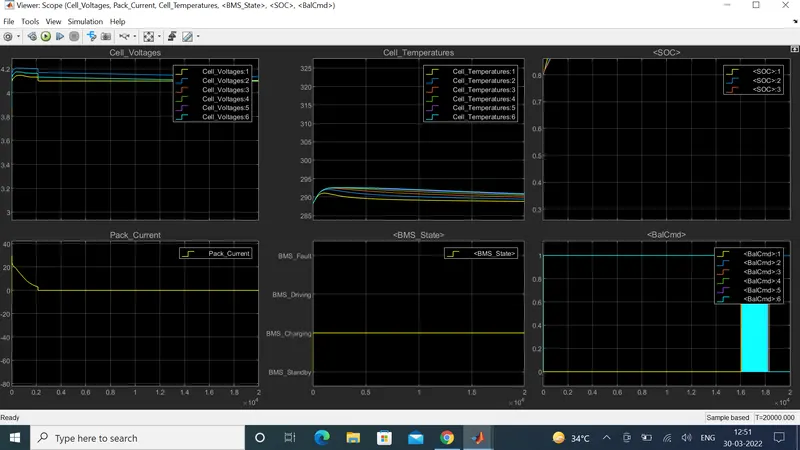
From the graph it is understood that when the BMS is in charging mode
The pack current goes to zero as the driving mode is off. It takes some time for the pack current to goes to zero because the BMS has transormed from driving to charging state.
The voltages of all the cells decreases from its peak value to the nominal value, and all the temperatures of the cells are maintained constant. The SOC increases as the BMS is in charging state.
2. Coulomb counting
The charging current or discharging current is integrated over a period of time to fing the remaining charge present in the battery. This process is called coulomb counting.
In the BMS model this is a subsystem of SOC estimation block. The technique behing coulomb counting is shown below.
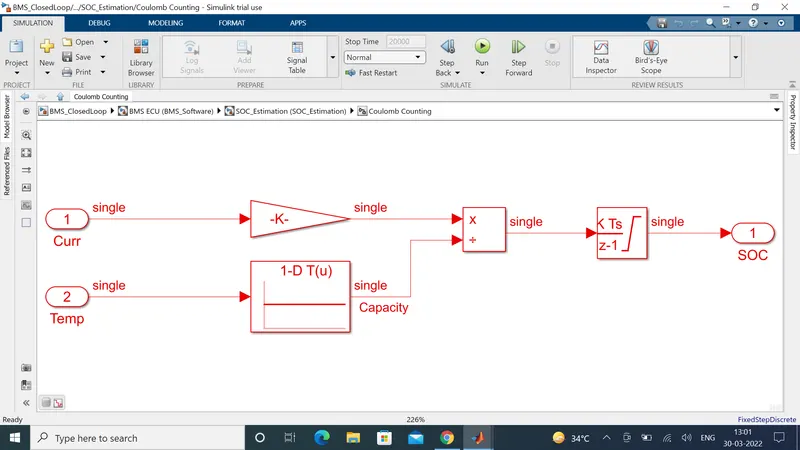
In this the current and the temperature are taken into consideration for calculating the SOC. The current is multiplied with a gain factor for certain period of time say one hour or some other value. The current obtained after multiplication is divided by the temperature which is taken after n number of samples. The obtained value is integrated over a time period which is the input drive cycle time and the obtained value will give the state of charge from initial to the final drive cycle time. Not only the time and temperature but the model uses kalman filters to obtain the exact state of chart.