Project 1
The Vehicle model is built using the given data and the pictures and the approriate simulink model is completed.
The Project1_InitFile.m is opened to load all the vehicle model parameters and data and the simulink model is initialized.
Additional To Workspace blocks have been added appropriately to directly send the simulink data to matlab script for post processing and to plot the graphs.
The Project1_ProcessingFile.m is finally executed and have been modified to draw the necessary graphs.
UDDS DRIVE CYCLE
Figure 1
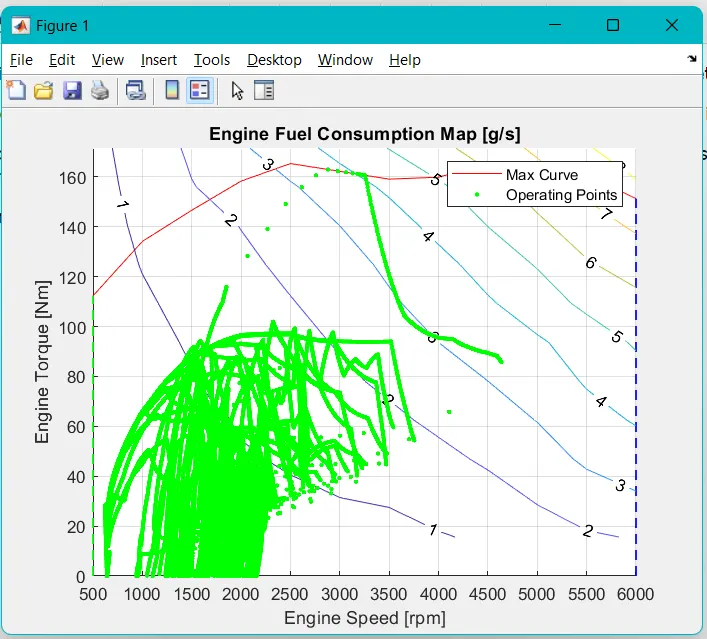
The Engine Fuel Consumption Map is given in the above image. It can be observed that the max curve peaks at 2500 rpm.
Figure 2
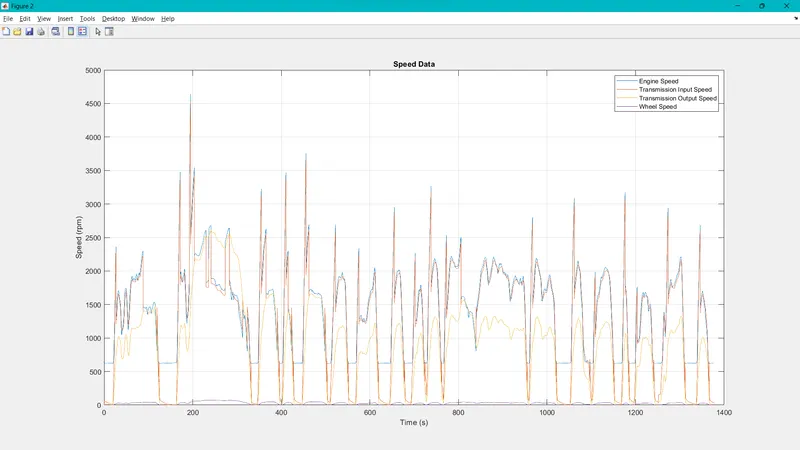
This graph shows the rpm of various components like the Engine Speed, Transmission Input Speed, Transmission Output Speed and the Wheel Speed. From the curve it is observed that the Transmission Input Speed and the Transmission Output Speed have the same profile. This is due to the fact they are interlinked and the difference in the speed is directly proportional to the corresponding gear ratio. The Wheel Speed is significantly small than the other speeds as it requires the highest amount of torque.
Figure 3
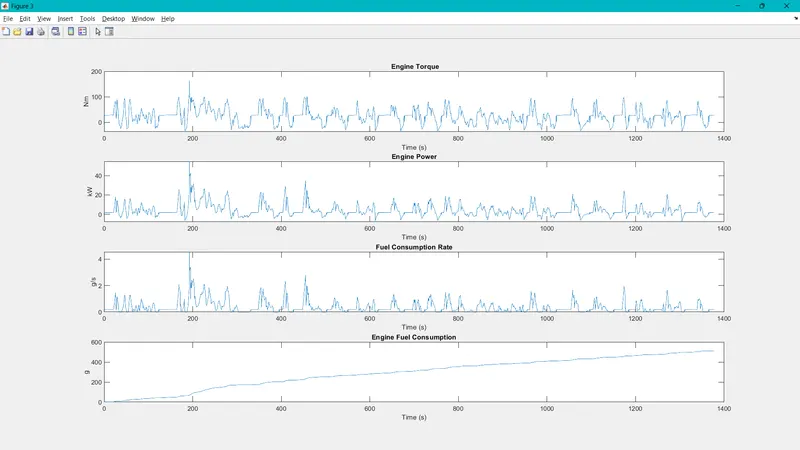
The Engine Torque, Engine Power, Engine Fuel Consumption Rate and the Total Engine Fuel Consumption is given in the above image for UDDS cycle. It is observed that the Peak Fuel Consumption rate is obtained when the Engine reaches its peak power.
Figure 4
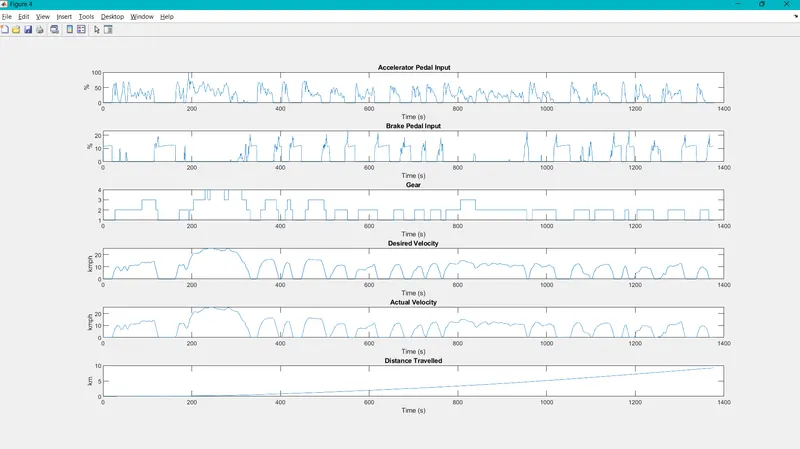
The above graph shows the input controls like the Accelerator, Brake and the Gear Inputs along with the desired speed and the actual speed with the total distance travelled. The actual velocity has the same curve as the Desired velocity proving the vehicle model is working correctly. The total distance travelled in 1400 seconds is 9.25km.
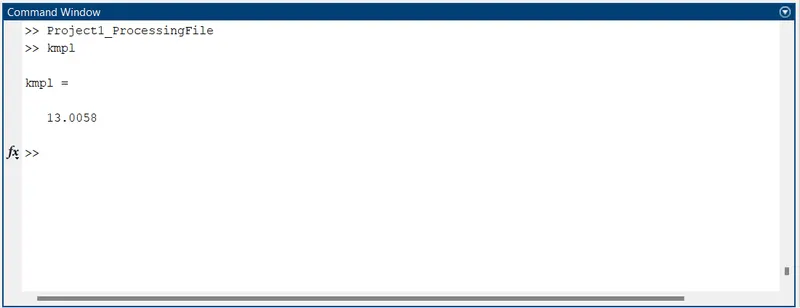
The Fuel Economy for UDDS cycle is 13.0058 kmpl
HWFET CYCLE
Figure 1
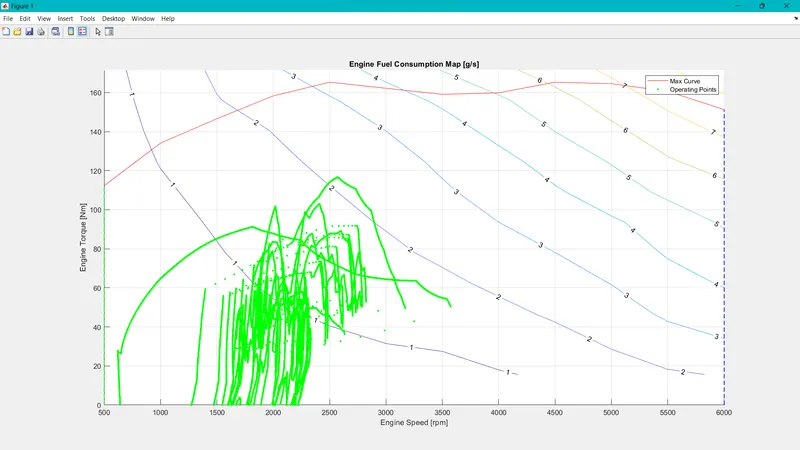
The Engine Fuel Consumption Map is given in the above image. It can be observed that the max curve peaks at 2500 rpm.
Figure 2
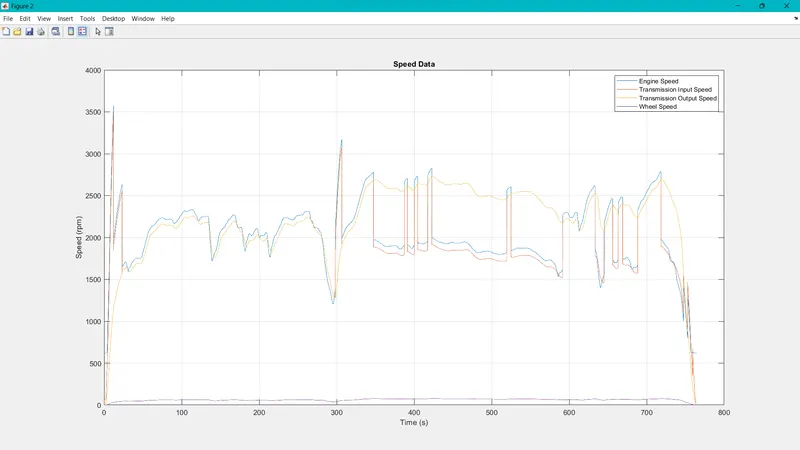
This graph shows the rpm of various components like the Engine Speed, Transmission Input Speed, Transmission Output Speed and the Wheel Speed. From the curve it is observed that the Transmission Input Speed and the Transmission Output Speed have the same profile. This is due to the fact they are interlinked and the difference in the speed is directly proportional to the corresponding gear ratio. The Wheel Speed is significantly small than the other speeds as it requires the highest amount of torque.
Figure 3
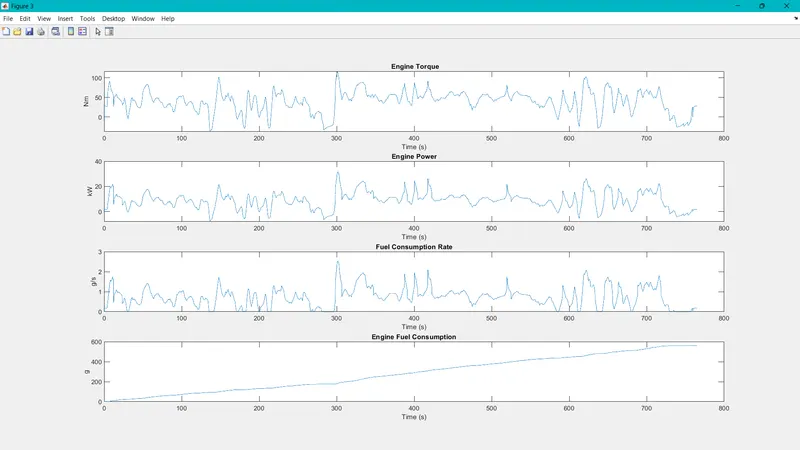
The Engine Torque, Engine Power, Engine Fuel Consumption Rate and the Total Engine Fuel Consumption is given in the above image for HWFET cycle. It is observed that the Peak Fuel Consumption rate is obtained when the Engine reaches its peak power.
Figure 4
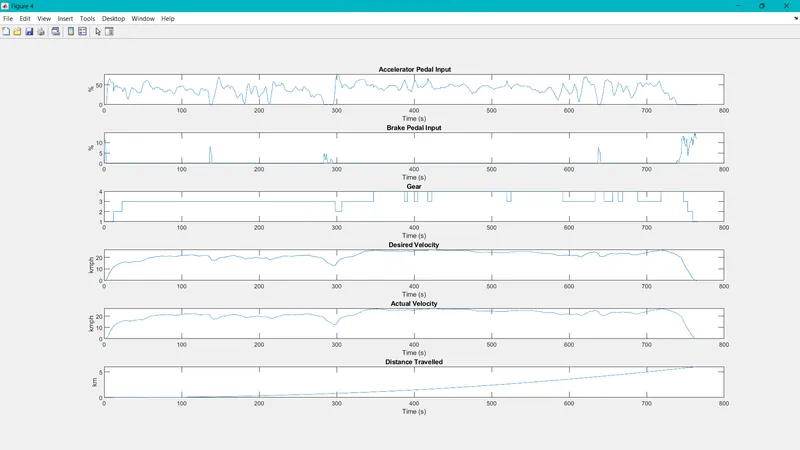
The above graph shows the input controls like the Accelerator, Brake and the Gear Inputs along with the desired speed and the actual speed with the total distance travelled. The actual velocity has the same curve as the Desired velocity proving the vehicle model is working correctly. The total distance travelled in 755 seconds is 5.8km.
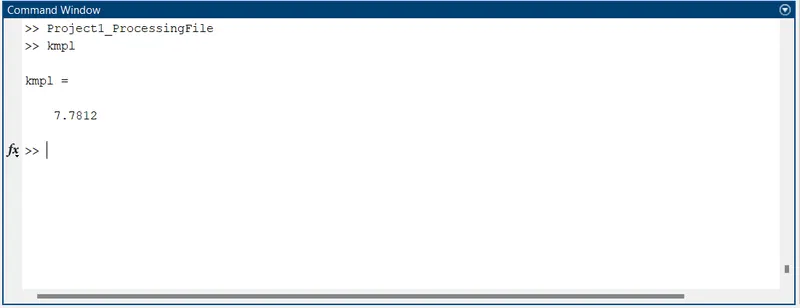
The Fuel Economy for the given HWFET cycle is 7.7812 kmpl