Project - Data Handling and Interpolation
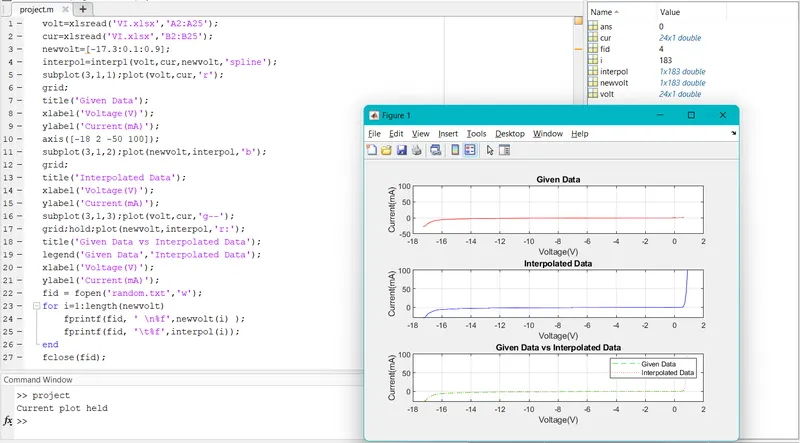
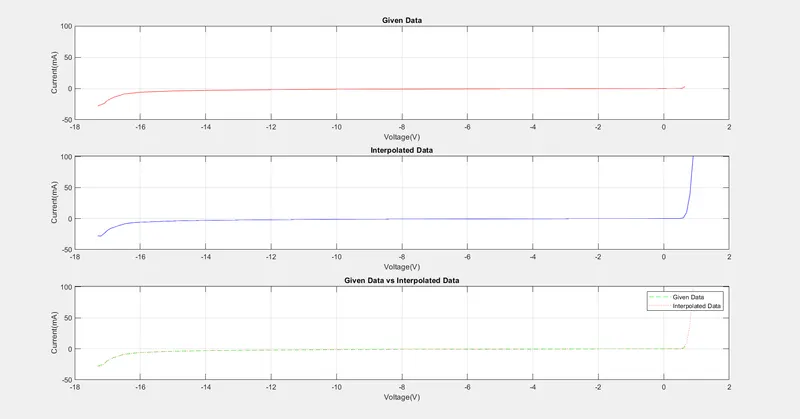
This program interpolates the given data to the given specific range and displays the given data, interpolated data and compares the given data with the interpolated data in a single subplot. The interpolated data then is saved in a notepad file called random.txt. The matlab code is given below
volt=xlsread('VI.xlsx','A2:A25');
cur=xlsread('VI.xlsx','B2:B25');
newvolt=[-17.3:0.1:0.9];
interpol=interp1(volt,cur,newvolt,'spline');
subplot(3,1,1);plot(volt,cur,'r');
grid;
title('Given Data');
xlabel('Voltage(V)');
ylabel('Current(mA)');
axis([-18 2 -50 100]);
subplot(3,1,2);plot(newvolt,interpol,'b');
grid;
title('Interpolated Data');
xlabel('Voltage(V)');
ylabel('Current(mA)');
subplot(3,1,3);plot(volt,cur,'g--');
grid;hold;plot(newvolt,interpol,'r:');
title('Given Data vs Interpolated Data');
legend('Given Data','Interpolated Data');
xlabel('Voltage(V)');
ylabel('Current(mA)');
fid = fopen('random.txt','w');
for i=1:length(newvolt)
fprintf(fid, ' \n%f',newvolt(i) );
fprintf(fid, '\t%f',interpol(i));
end
fclose(fid);
In the above program, the given Voltage and Current data from the excel sheet is read and saved in two variables "volt" and "cur" respectively. A new variable "newvolt" is created to define the range of interpolation. The interpolated data is stored in the variable "interpol". The type of interpolation used here is spline. The graphs are then generated with appropriate axis names and titles and are plotted in a single subplot. The interpolated data is finally stored in the text file called "random.txt".