Project 1(A Simulink model for power consumption using battery(Secondary storage) or from Fuel cell(Primary source) according to power demand limits)
PROJECT 1
Objective:
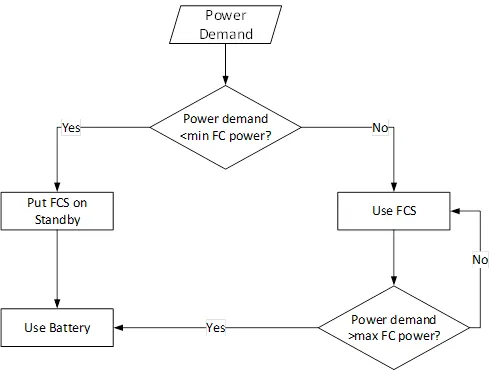
To create a simulink model for the given flowchart operation and create plot with given input and output parameters with respect to time.
The input to the model would be the power demand.
The output should be:
- Fuel cell power
- Battery power
- FC Operating state (running, standby)
Flow chart:
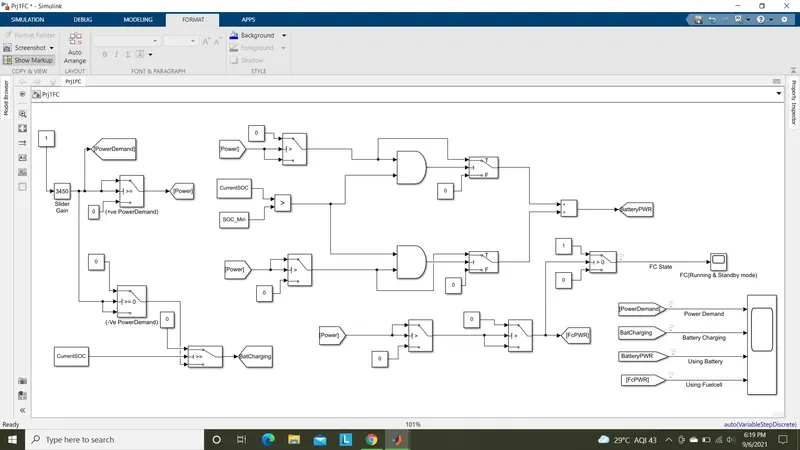
Simulink Model:
Matlab Workspace file:
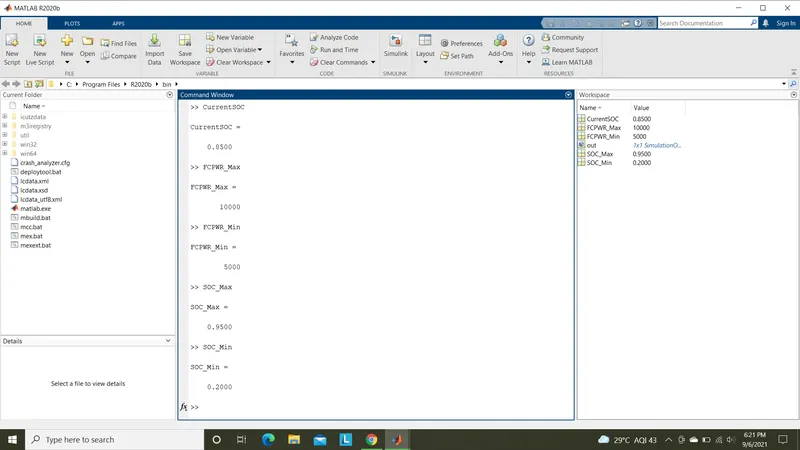
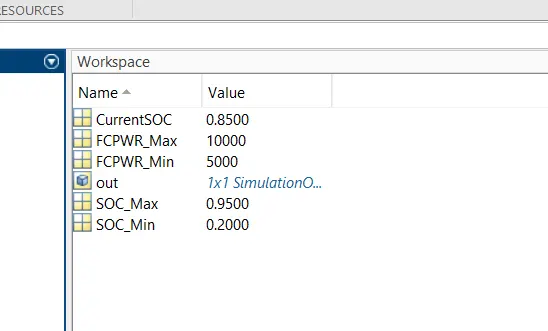
In this Workspace file,the variables to give input for the model are created from model configuration boxes and verified in command window as shown above.
We can also create this file directly from command window by giving input values to new variables.
The variables are,
- Current SOC of battery(CurrentSOC)
- Maximum Fuelcell Power production(FCPWR_Max)
- Minimum Fuelcell Power production(FCPWR_Min)
- Maximum SOC limit to stop charging(SOC_Max)
- Minimum SOC limit to use battery power(SOC_Min)
Operating principle:
As per the flow chart,
- Initially the power demand should be verified whether the power demand is positive or negative.
- If power demand is positive,the power should be drawn from battery or fuel cell.
- The power is drawn from battery when demand is less than FC minimum power producing level and greater than FC maximum power producing level.
- If power demand is in the operating range of fuel cell means ,power is drawn from fuel cell alone.
- If power demand is negative, the battery should get charge according to its SOC conditions, ultimately to maintain maximum charge limit of battery at every time.
- If SOC of battery reaches maximum charge limit as assigned the charging should not occur.
- If SOC of battery is less than the minimum discharge limit as assigned the power should not drawn from battery.
Construction and working of model:
Step 1:
Initially the power demand is given from a slider gain as shown below,
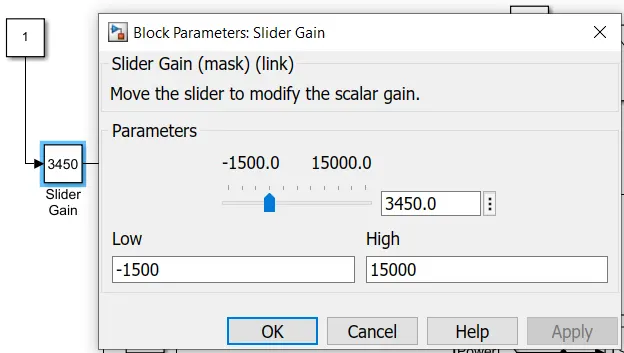
The power demand limit is set as from -1500 W to 15000W.
Then input power demand is verified for positive or negative demand by a two switches.
Positive power out from upper switch and negative power out from lower switch as shown below,
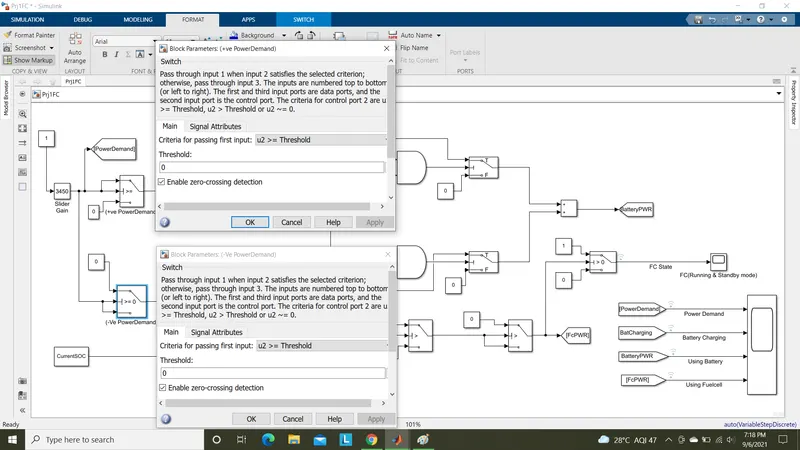
If the input power is >= to 0 ,gives positve power demand output.
If input power is < 0, gives negative power demand output.
Step 2:
Using battery power for less than FC minimum power production limit-
Positive power demand is compared with minimum FC power producing limit by a switch.
Also SOC of battery is verified whether initial SOC is less then maximum charge limit.
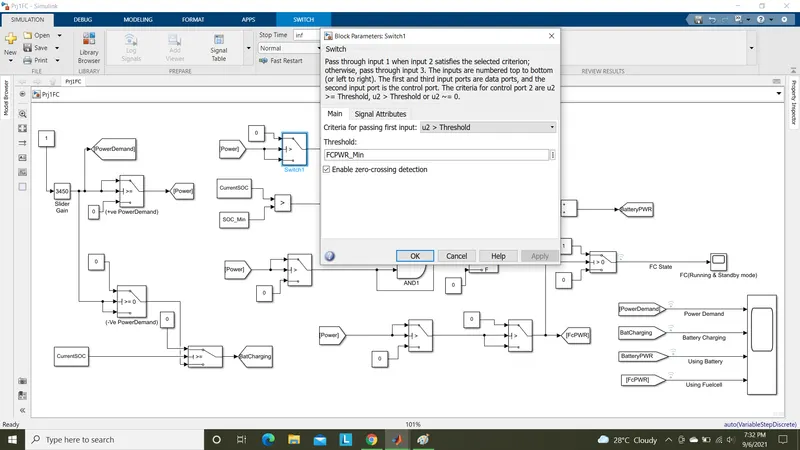
Both compared results are given as input to AND gate.
The result is 1 if both results are positive and result is 0,if even one of them becomes 0.
If output from AND is 1 then this power is taken from battery.
Using battery power for greater than FC maximum power production limit-
Positive power demand is compared with maximum FC power producing limit by a switch.
Also SOC of battery is verified whether initial SOC is less then maximum charge limit.
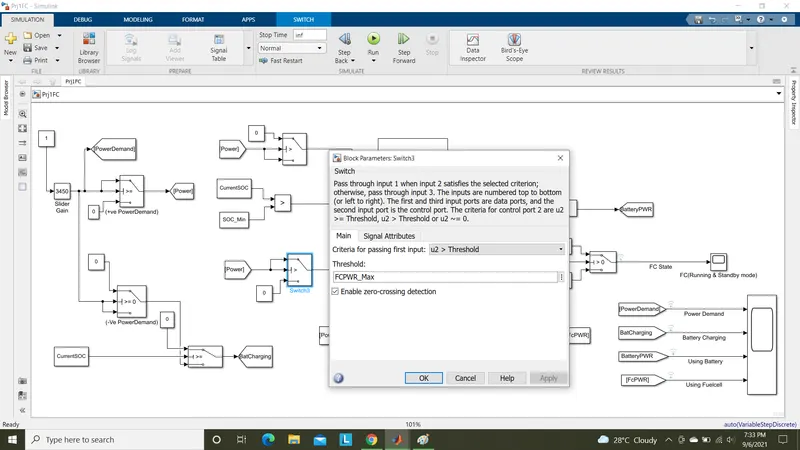
Both compared results are given as input to AND gate.
The result is 1 if both results are positive and result is 0,if even one of them becomes 0.
If output from AND is 1 then this power is taken from battery.
Both powers are added by a sum block to get the final power output drawn from battery.
In this both cases one battery power output is always 0 when another one power out is in action.
Step 3:
If the positive power demand is > than FC minimum power production limit and < than FC maximum power production limit,then power is drawn from fuel cell alone.
This can be created as shown below,
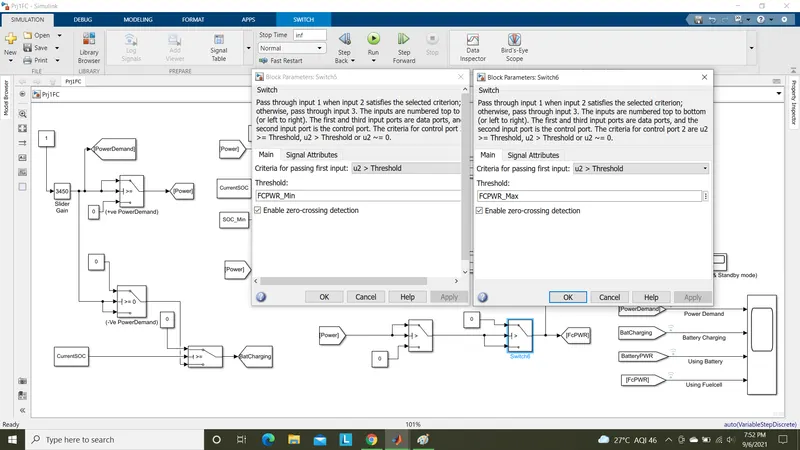
Result:
Mat file is updatted to model for assigned values.
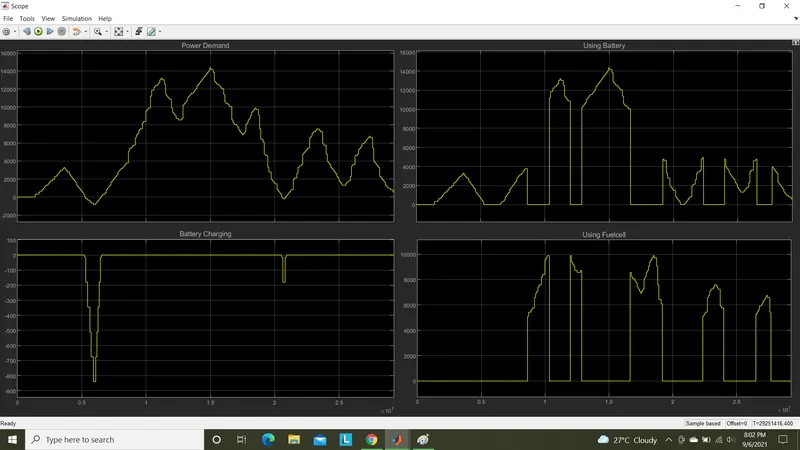
A random power demand profile is created from slider gain and results are seen as,
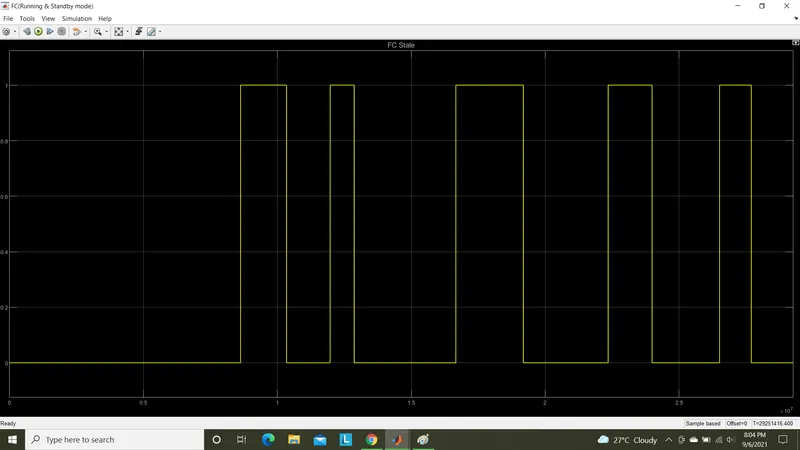
Fuel cell state(Running/standby mode),
All plots from data inspector as shown below,
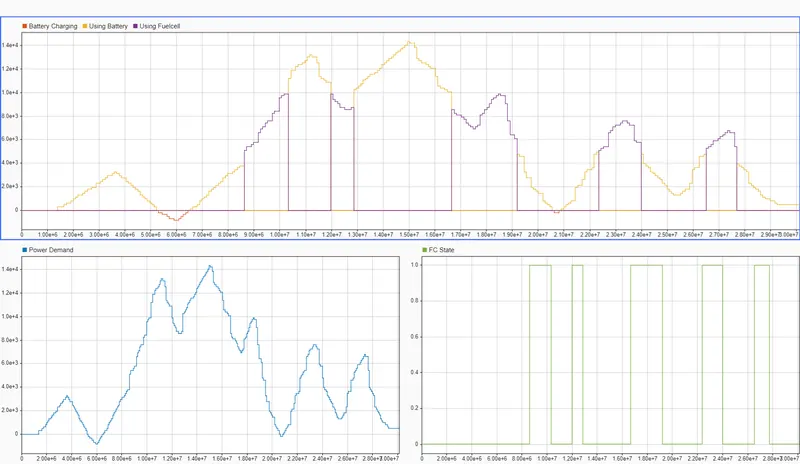
From plot 1 we can see the power demand drawn from battery below FC min.power limit(5000 W) and above FC max.power limit(10000W).
At FC operating limits power is drawned from fuel cell alone.
Negative power demand used for charging is also seen from plot 1.
Second plot shows the power demand and third plot shows the Fuel cell state(1-Running ,0-Standby mode).
Conclusion:
Thus a simulink model as per flow chart requirements is created and output plots with respect to time is justified.
Note: Simulink file and Mat file is attached with the submission.
Thank you.
Submitted by,
Praveen Kumar L V,
Date:6/9/2021.